The social business intelligence (BI) market size is projected to reach US$ 45.73 billion by 2031 from US$ 25.78 billion in 2023. The market is expected to register a CAGR of 7.4% during 2023–2031. The development of mobile platforms and increasing demand for end-to-end real-time data analysis are likely to remain key trends in the market.
Social Business Intelligence (BI) Market Analysis
The social business intelligence (BI) market has witnessed significant growth in recent years, driven by technological advancements, increasing need for data-driven decision-making, proliferation of social media usage, and growing focus on digital transformation. The growing need for cloud-based solutions is providing lucrative growth opportunities for the market. Furthermore, growing technological developments such as artificial intelligence (AI) and big data analytics are emerging as opportunities for market growth.
Social Business Intelligence (BI) Market Overview
Social business intelligence refers to the study of information from social media platforms like Facebook, LinkedIn, and Twitter. It is the process of creating reports and building dashboards that visualize social media analytics. To assist businesses in making better data-driven decisions, social BI is frequently combined with standard reporting and BI techniques. Social BI solutions assist users in gaining a better understanding of consumer preferences for products and services of an organization. These tools also assist users in identifying trends and pinpointing the significant changes at times. Social BI tools also help to monitor competitor activities. Businesses utilize social intelligence to gain insight into the thoughts and actions of their customers. Social BI tools provide various features such as:
Custom reports and dashboards: Social BI tools allow custom options, which means users can add what is meaningful to their organization and can eliminate the elements that make no sense for business decisions. Real-time monitoring: Social business intelligence tools gather data for certain periods and allow users to assess patterns and identify trends.
Benchmarks or scorecards for social business intelligence: Social business intelligence tools offer benchmarks so users can get a better understanding of their organization's performance and also provide industry scorecards to help performance measures.
Every aspect of today's modern life involves sharing and social interaction. As social media platform usage increases, the demand for social intelligence will take a broader role in the coming years.
Customize Research To Suit Your Requirement
We can optimize and tailor the analysis and scope which is unmet through our standard offerings. This flexibility will help you gain the exact information needed for your business planning and decision making.
Social Business Intelligence (BI) Market: Strategic Insights
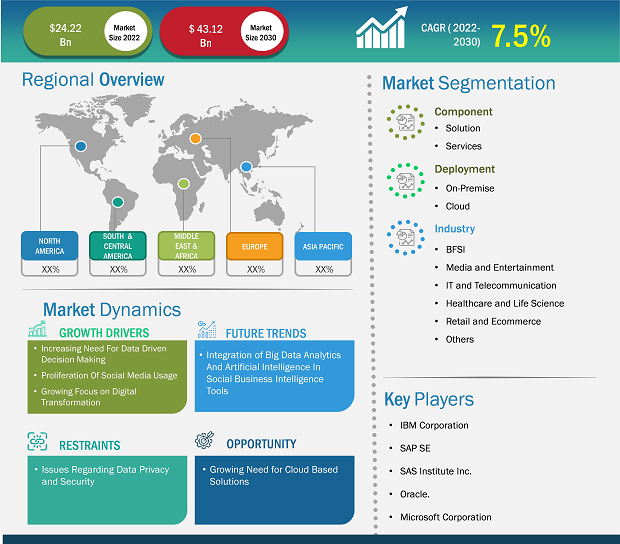
Market Size Value in US$ 24.22 billion in 2022 Market Size Value by US$ 43.12 billion by 2030 Growth rate CAGR of 7.5% from 2022 to 2030 Forecast Period 2022-2030 Base Year 2022

Naveen
Have a question?
Naveen will walk you through a 15-minute call to present the report’s content and answer all queries if you have any.
 Speak to Analyst
Customize Research To Suit Your Requirement
We can optimize and tailor the analysis and scope which is unmet through our standard offerings. This flexibility will help you gain the exact information needed for your business planning and decision making.
Social Business Intelligence (BI) Market: Strategic Insights
| Market Size Value in | US$ 24.22 billion in 2022 |
| Market Size Value by | US$ 43.12 billion by 2030 |
| Growth rate | CAGR of 7.5% from 2022 to 2030 |
| Forecast Period | 2022-2030 |
| Base Year | 2022 |
Naveen
Have a question?
Naveen will walk you through a 15-minute call to present the report’s content and answer all queries if you have any.
Speak to Analyst
Social Business Intelligence (BI) Market Drivers and Opportunities
The proliferation of Social Media Usage to Favor Market
With strong internet connectivity and the huge adoption of smartphones, social media usage has become one of the most popular online activities these days. Social media usage is an integral part of daily internet usage amongst users. According to the Datareportal April 2023, more than half of the world, i.e., 60%, uses social media. 4.80 billion people worldwide use social media, and 150 million new users have come online within the last 12 months. According to Target Internet, the top three social networks are Facebook, YouTube, and WhatsApp in terms of user counts. Facebook has over 65.86% of its monthly users logging in to social media daily. Between 2021 and 2022, TikTok, Instagram, Snapchat, Pinterest, and Twitter are the networks with the highest growth rates. However, TikTok is now banned in many countries. From 2021 to 2022, Instagram also grew massively, adding 478 million users. Further, according to a report by Sprout Social, 53% of consumers reported higher social media usage over the last 2021 to 2022. Sprout Social's report highlights that 68% of consumers primarily use social media platforms to stay informed about new products and services.
With consumers spending more time on social media, marketers are leveraging the opportunities to engage consumers with their brands and to gain meaningful insights from social media with the help of social business intelligence (BI) tools. People are sharing their genuine preferences and ideas on social media, which is opening up huge opportunities for businesses to increase sales, reduce marketing expenses, and engage with customers directly. A firm can glean an infinite quantity of important insights and information from social media data. Thus, the huge proliferation of social media usage drives the market growth.
Rising Adoption of Real-time Data Analytics Tools Among Businesses
Real-time data analytics is a process that allows businesses to collect, measure, prepare, evaluate, and use fresh data as soon as the system receives it. This supports businesses to make quick decisions based on the latest information. For instance, StarTree Inc. offers StarTree Cloud system, a cloud-based real-time analytics platform that has new observability and anomaly detection capabilities. The company also provides a new write API along with the StarTree Cloud system that enables real-time data synchronization for ELT data pipelines. The rising adoption of real-time data analytics tools increases the demand for social business intelligence tools to immediately adapt to changing situations and make data-driven decisions. Hence, the demand for social business intelligence in the BFSI, healthcare, IT & telecommunication, e-commerce, and other industries contributes to the social business intelligence (BI) market growth.
Social Business Intelligence (BI) Market Report Segmentation Analysis
Key segments that contributed to the derivation of the social business intelligence (BI) market analysis are component, deployment type, and industry vertical.
- Based on component, the social business intelligence (BI) market is divided into solution and services. The solution segment is anticipated to expand during the forecast period.
- On the basis of deployment type, the social business intelligence (BI) market is divided into on-premise and cloud. The cloud segment is anticipated to expand during the forecast period.
- In terms of industry vertical, the social business intelligence (BI) market is segmented into BFSI, media and entertainment, IT and telecommunication, healthcare and life science, retail and e-commerce, and others. The BFSI segment held a larger market share in 2023.
Social Business Intelligence (BI) Market Share Analysis by Geography
The geographic scope of the social business intelligence (BI) market report is mainly divided into five regions: North America, Asia Pacific, Europe, Middle East & Africa, and South & Central America.
North America holds one of the largest global social business intelligence (BI) market shares. High technology adoption trends in various industries in the North American region have fueled the growth of the social business intelligence (BI) market. Factors such as increased adoption of social media platforms and high technological spending by government agencies are expected to drive the North American social business intelligence (BI) market growth. In addition, the US has a large number of social business intelligence (BI) market players, such as IBM, Oracle, and Microsoft, among others, who have been increasingly focusing on developing innovative solutions. Moreover, the number of social media users is increasing year after year in North American countries such as the US, Canada, and Mexico. Nearly 74.2% of adults use Facebook, and 60.5% of adults use Instagram in the US. Furthermore, according to Kepios, there were 311.3 million internet users and 246.0 million social media users in the US as of January 2023. The number of social media users in the US in January 2023 was equivalent to 72.5% of the total population. All such factors contribute to the growth of the user-generated content platform market.
Social Business Intelligence (BI) Market Report Scope
Social Business Intelligence (BI) Market News and Recent Developments
The social business intelligence (BI) market is evaluated by gathering qualitative and quantitative data post primary and secondary research, which includes important corporate publications, association data, and databases. A few of the developments in the social business intelligence (BI) market are listed below:
- In June 2023, Cloud analytics firm ThoughtSpot announced its agreement to acquire business intelligence (BI) platform Mode Analytics in a cash and equity transaction valued at US$200 million. This partnership aimed to empower data teams worldwide to transform business intelligence using generative Al by combining their respective technologies to offer a comprehensive suite of analytical tools. (Source: ThoughtSpot, Company Website, June 2022)
- In May 2023, Gong announced the launch of Gong Insights, powered by Snowflake. This new solution autonomously brings insights captured on the Gong Revenue Intelligence Platform to a company's existing business intelligence (BI) tool. This new offering will allow business leaders to make informed business decisions by leveraging Gong's rich data set alongside the rest of their critical business insights. (Source: Gong, Company Website, May 2023)
- In November 2022, IBM Corp announced new software- IBM Business Analytics Enterprise, which is designed to help enterprises break down data and analytics silos so they can make data-driven decisions quickly and navigate unpredictable disruptions. IBM Business Analytics Enterprise is a suite of business intelligence planning, budgeting, reporting, forecasting, and dashboard capabilities. It provides users with a robust view of data sources across their entire business. (Source: IBM Corp, Company Website, November 2022)
Social Business Intelligence (BI) Market Report Coverage and Deliverables
The “Social Business Intelligence (BI) Market Size and Forecast (2021–2031)” report provides a detailed analysis of the market covering below areas:
- Social business intelligence (BI) market size and forecast at global, regional, and country levels for all the key market segments covered under the scope
- Social business intelligence (BI) market trends as well as market dynamics such as drivers, restraints, and key opportunities
- Detailed PEST/Porter’s Five Forces and SWOT analysis
- Social business intelligence (BI) market analysis covering key market trends, global and regional framework, major players, regulations, and recent market developments
- Industry landscape and competition analysis covering market concentration, heat map analysis, prominent players, and recent developments for the social business intelligence (BI) market
- Detailed company profiles

Report Coverage
Revenue forecast, Company Analysis, Industry landscape, Growth factors, and Trends

Segment Covered
Component, Deployment Type, Industry Vertical

Regional Scope
North America, Europe, Asia Pacific, Middle East & Africa, South & Central America

Country Scope
This text is related
to country scope.
Frequently Asked Questions
The report can be delivered in PDF/PPT format; we can also share excel dataset based on the request.
Some of the customization options available based on the request are additional 3–5 company profiles and country-specific analysis of 3–5 countries of your choice. Customizations are to be requested/discussed before making final order confirmation, as our team would review the same and check the feasibility.
The key players holding majority shares in the global social business intelligence (BI) market are IBM Corporation, SAP SE, SAS Institute Inc., Tableau Software, Inc., Qlik Technologies, Inc., Microsoft Corporation, Alteryx Inc., MicroStrategy, Inc., Logi Analytics, Inc., and TIBCO Software, Inc.
The development of mobile platforms and increasing demand for end-to-end real-time data analysis to play a significant role in the global social business intelligence (BI) market in the coming years.
The global social business intelligence (BI) market is estimated to register a CAGR of 7.4% during the forecast period 2023–2031.
The proliferation of social media usage and expanding e-commerce and BFSI industries are the major factors that propel the global social business intelligence (BI) market.
The Insight Partners performs research in 4 major stages: Data Collection & Secondary Research, Primary Research, Data Analysis and Data Triangulation & Final Review.
- Data Collection and Secondary Research:
As a market research and consulting firm operating from a decade, we have published many reports and advised several clients across the globe. First step for any study will start with an assessment of currently available data and insights from existing reports. Further, historical and current market information is collected from Investor Presentations, Annual Reports, SEC Filings, etc., and other information related to company’s performance and market positioning are gathered from Paid Databases (Factiva, Hoovers, and Reuters) and various other publications available in public domain.
Several associations trade associates, technical forums, institutes, societies and organizations are accessed to gain technical as well as market related insights through their publications such as research papers, blogs and press releases related to the studies are referred to get cues about the market. Further, white papers, journals, magazines, and other news articles published in the last 3 years are scrutinized and analyzed to understand the current market trends.
- Primary Research:
The primarily interview analysis comprise of data obtained from industry participants interview and answers to survey questions gathered by in-house primary team.
For primary research, interviews are conducted with industry experts/CEOs/Marketing Managers/Sales Managers/VPs/Subject Matter Experts from both demand and supply side to get a 360-degree view of the market. The primary team conducts several interviews based on the complexity of the markets to understand the various market trends and dynamics which makes research more credible and precise.
A typical research interview fulfils the following functions:
- Provides first-hand information on the market size, market trends, growth trends, competitive landscape, and outlook
- Validates and strengthens in-house secondary research findings
- Develops the analysis team’s expertise and market understanding
Primary research involves email interactions and telephone interviews for each market, category, segment, and sub-segment across geographies. The participants who typically take part in such a process include, but are not limited to:
- Industry participants: VPs, business development managers, market intelligence managers and national sales managers
- Outside experts: Valuation experts, research analysts and key opinion leaders specializing in the electronics and semiconductor industry.
Below is the breakup of our primary respondents by company, designation, and region:

Once we receive the confirmation from primary research sources or primary respondents, we finalize the base year market estimation and forecast the data as per the macroeconomic and microeconomic factors assessed during data collection.
- Data Analysis:
Once data is validated through both secondary as well as primary respondents, we finalize the market estimations by hypothesis formulation and factor analysis at regional and country level.
- 3.1 Macro-Economic Factor Analysis:
We analyse macroeconomic indicators such the gross domestic product (GDP), increase in the demand for goods and services across industries, technological advancement, regional economic growth, governmental policies, the influence of COVID-19, PEST analysis, and other aspects. This analysis aids in setting benchmarks for various nations/regions and approximating market splits. Additionally, the general trend of the aforementioned components aid in determining the market's development possibilities.
- 3.2 Country Level Data:
Various factors that are especially aligned to the country are taken into account to determine the market size for a certain area and country, including the presence of vendors, such as headquarters and offices, the country's GDP, demand patterns, and industry growth. To comprehend the market dynamics for the nation, a number of growth variables, inhibitors, application areas, and current market trends are researched. The aforementioned elements aid in determining the country's overall market's growth potential.
- 3.3 Company Profile:
The “Table of Contents” is formulated by listing and analyzing more than 25 - 30 companies operating in the market ecosystem across geographies. However, we profile only 10 companies as a standard practice in our syndicate reports. These 10 companies comprise leading, emerging, and regional players. Nonetheless, our analysis is not restricted to the 10 listed companies, we also analyze other companies present in the market to develop a holistic view and understand the prevailing trends. The “Company Profiles” section in the report covers key facts, business description, products & services, financial information, SWOT analysis, and key developments. The financial information presented is extracted from the annual reports and official documents of the publicly listed companies. Upon collecting the information for the sections of respective companies, we verify them via various primary sources and then compile the data in respective company profiles. The company level information helps us in deriving the base number as well as in forecasting the market size.
- 3.4 Developing Base Number:
Aggregation of sales statistics (2020-2022) and macro-economic factor, and other secondary and primary research insights are utilized to arrive at base number and related market shares for 2022. The data gaps are identified in this step and relevant market data is analyzed, collected from paid primary interviews or databases. On finalizing the base year market size, forecasts are developed on the basis of macro-economic, industry and market growth factors and company level analysis.
- Data Triangulation and Final Review:
The market findings and base year market size calculations are validated from supply as well as demand side. Demand side validations are based on macro-economic factor analysis and benchmarks for respective regions and countries. In case of supply side validations, revenues of major companies are estimated (in case not available) based on industry benchmark, approximate number of employees, product portfolio, and primary interviews revenues are gathered. Further revenue from target product/service segment is assessed to avoid overshooting of market statistics. In case of heavy deviations between supply and demand side values, all thes steps are repeated to achieve synchronization.
We follow an iterative model, wherein we share our research findings with Subject Matter Experts (SME’s) and Key Opinion Leaders (KOLs) until consensus view of the market is not formulated – this model negates any drastic deviation in the opinions of experts. Only validated and universally acceptable research findings are quoted in our reports.
We have important check points that we use to validate our research findings – which we call – data triangulation, where we validate the information, we generate from secondary sources with primary interviews and then we re-validate with our internal data bases and Subject matter experts. This comprehensive model enables us to deliver high quality, reliable data in shortest possible time.
 Get Free Sample For