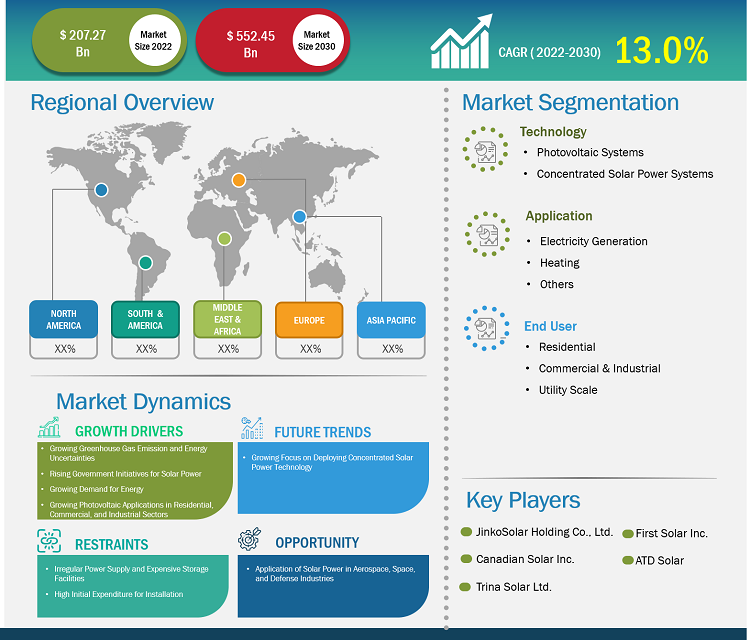
The solar energy market was valued at US$ 207,270.00 million in 2022 and is expected to reach US$ 552,450.28 million by 2030; it is anticipated to account for a CAGR of 13.0% from 2022 to 2030.
A key contributor of GHG (greenhouse gas) emissions that lead to climate change is power generation using fossil fuels. The utilization of solar energy is growing due to rising concern towards more sustainable and green energy alternatives, growing climate change concerns, and government initiatives towards boosting the usage of renewable energy across the globe.
Solar Energy Market Analysis
The rise in energy consumption also boosted the need for alternative energy generation sources, as conventional energy resources such as fossil fuels are leading to environmental pollution. Renewable alternative options such as solar emerged to curb immense carbon emissions and their negative impact on the environment, along with the agenda of balancing the energy supply and demand. The growing energy prices and uncertainty of energy supply in some remote locations have boosted the application of solar photovoltaics, which is anticipated to drive the development of the solar energy market globally.
Solar Energy Market Overview
Governments and organizations of major countries such as the US, China, and South Africa focus on investing in advanced technologies to enhance the operational efficiency of solar plants. Concentrated solar power (CSP) technologies leverage mirrors to reflect and concentrate daylight onto receivers that accumulate light energy and transform it into thermal energy or heat. The deployment of CSP systems is increasing globally due to the growing need for energy in different sectors and government concerns about environmental pollution. Further, the rise in the development of the renewable energy sector and favorable government initiatives toward using a sustainable approach to reduce carbon emissions are fueling the investment in CSP plants, which is anticipated to propel the growth of the solar energy market globally.
Customize Research To Suit Your Requirement
We can optimize and tailor the analysis and scope which is unmet through our standard offerings. This flexibility will help you gain the exact information needed for your business planning and decision making.
Solar Energy Market: Strategic Insights
Market Size Value in US$ 207,270.00 million in 2022 Market Size Value by US$ 552,450.28 million by 2030 Growth rate CAGR of 13.0% from 2022 to 2030 Forecast Period 2022-2030 Base Year 2022

Naveen
Have a question?
Naveen will walk you through a 15-minute call to present the report’s content and answer all queries if you have any.
 Speak to Analyst
Customize Research To Suit Your Requirement
We can optimize and tailor the analysis and scope which is unmet through our standard offerings. This flexibility will help you gain the exact information needed for your business planning and decision making.
Solar Energy Market: Strategic Insights
| Market Size Value in | US$ 207,270.00 million in 2022 |
| Market Size Value by | US$ 552,450.28 million by 2030 |
| Growth rate | CAGR of 13.0% from 2022 to 2030 |
| Forecast Period | 2022-2030 |
| Base Year | 2022 |
Naveen
Have a question?
Naveen will walk you through a 15-minute call to present the report’s content and answer all queries if you have any.
Speak to Analyst
Solar Energy Market Drivers and Opportunities
Rising Government Initiatives for Solar Power is Expected to be the Prime Driver for the Solar Energy Market
The application of solar energy has rapidly increased in recent years due to its capability to reduce the adverse environmental effects of conventional energy resources such as coal, natural gas, and oil. Hence, governments of various countries across the globe imposed tax incentives and favorable policies to support the remarkable growth of solar energy. In 2022, the Government of India announced its plan to implement the Rooftop Solar Programme Phase II. As per the scheme, the Ministry of New and Renewable Energy (MNRE) will offer Central Financial Assistance to residential consumers for installing rooftop solar systems. Factors such as volatile fossil fuel prices have fuelled renewable energy investments and boosted policy support through new initiatives in Europe, Japan, and China; the US Inflation Reduction Act; and a strong positioning of climate and energy security objectives, particularly in import-reliant economies. Thus, the rising number of government initiatives toward boosting solar power is driving the solar energy market.
Application of Solar Power in Aerospace, Space, and Defense Industries
The growing technological development and government initiatives are boosting the application of solar energy in various end-use sectors such as aerospace and defense. One of the key applications of solar power in the aerospace and defense industries is solar-powered UAVs. Solar-powered UAVs facilitate secure communication in distant areas among defense forces, enhancing broadband connection. Thus, the growing application of solar power in the space, aerospace, and defense industries is expected to establish lucrative opportunities for the solar energy market players to boost the adoption of solar energy-based systems in the coming years.
Solar Energy Market Report Segmentation Analysis
Key segments that contributed to the derivation of the solar energy market analysis are technology, application, and end-user.
- Based on the technology, the solar energy market has been divided into photovoltaic systems and concentrated solar power systems. The photovoltaic systems segment held a larger market share in 2022.
- In terms of application, the market has been segmented into electricity generation, heating, and others. The electricity generation segment dominated the market in 2022.
- In terms of end-user, the market has been segmented into residential, commercial & industrial, utility scale. The utility scale segment dominated the market in 2022.
Solar Energy Market Share Analysis by Geography
The geographic scope of the Solar Energy Market report is mainly divided into five regions: North America, Europe, Asia Pacific, Middle East & Africa, and South America.
Growing focus on lowering environmental pollution by reducing greenhouse gas emissions and rising government initiatives toward increasing the stake of renewable energy resources in the overall power mix are major reasons for solar energy market growth in Asia Pacific. China, Australia, India, and Japan are a few key countries contributing to Asia Pacific's solar energy market growth. Growing focus on concentrated solar power plants and increasing demand for energy security are important drivers for the solar energy market in Asia Pacific.
Solar Energy Market Report Scope
Solar Energy Market News and Recent Developments
The Solar Energy Market is evaluated by gathering qualitative and quantitative data post primary and secondary research, which includes important corporate publications, association data, and databases. The following is a list of developments in the market for Solar Energy Markets market and strategies:
- On July 2023, Trina Solar and Aquila Clean Energy signed a framework agreement for the supply of 800MW of photovoltaic modules. (Source: Trina Solar, Press Release/Company Website/Newsletter)
- On August 2022, First Solar announced to invest up to US$1 billion in a new, 3.5 GWDC manufacturing facility in the US Southeast. Existing Northwest Ohio footprint to be expanded by 0.9 GWDC with US$185 million upgrade. (Source: First Solar, Press Release/Company Website/Newsletter)
Solar Energy Market Report Coverage and Deliverables
The “Solar Energy Market Size and Forecast (2020–2030)” report provides a detailed analysis of the market covering below areas:
- Market size and forecast at global, regional, and country levels for all the key market segments covered under the scope
- Market dynamics such as drivers, restraints, and key opportunities
- Key future trends
- Detailed PEST analysis
- Global and regional market analysis covering key market trends, major players, regulations, and recent market developments
- Industry landscape and competition analysis covering market concentration, heat map analysis, prominent players, and recent developments
- Detailed company profiles with SWOT analysis

Report Coverage
Revenue forecast, Company Analysis, Industry landscape, Growth factors, and Trends

Segment Covered
Technology, Application, and End User

Regional Scope
North America, Europe, Asia Pacific, Middle East & Africa, South & Central America

Country Scope
This text is related
to country scope.
1. Introduction
1.1 The Insight Partners Research Report Guidance
1.2 Market Segmentation
2. Executive Summary
2.1 Key Insights
2.2 Market Attractiveness
3. Research Methodology
3.1 Coverage
3.2 Secondary Research
3.3 Primary Research
4. Solar Energy Market Landscape
4.1 Overview
4.2 PEST Analysis
4.3 Ecosystem Analysis
4.3.1 List of Solar Energy Suppliers
5. Solar Energy Market - Key Industry Dynamics
5.1 Solar Energy Market - Key Industry Dynamics
5.2 Market Drivers
5.2.1 Growing Concerns Regarding Greenhouse Gas Emission and Energy Uncertainties
5.2.2 Rising Government Initiatives for Solar Power
5.2.3 Growing Demand for Energy
5.2.4 Growing Photovoltaic Applications in Residential, Commercial, and Industrial Sectors
5.3 Market Restraints
5.3.1 Irregular Power Supply and Expensive Storage Facilities
5.3.2 High Initial Expenditure for Installation
5.4 Market Opportunities
5.4.1 Application of Solar Power in Aerospace, Space, and Defense Industries
5.5 Future Trends
5.5.1 Growing Focus on Deploying Concentrated Solar Power Technology
5.6 Impact of Drivers and Restraints:
6. Solar Energy Market - Global Market Analysis
6.1 Solar Energy Market Revenue (US$ Million), 2022 – 2030
6.2 Solar Energy Market Forecast and Analysis
7. Solar Energy Market Analysis - Technology
7.1 Photovoltaic Systems
7.1.1 Overview
7.1.2 Photovoltaic Systems Market, Revenue and Forecast to 2030 (US$ Million)
7.1.3 Monocrystalline
7.1.3.1 Overview
7.1.3.2 Monocrystalline Market, Revenue and Forecast to 2030 (US$ Million)
7.1.4 Polycrystalline
7.1.4.1 Overview
7.1.4.2 Polycrystalline Market, Revenue and Forecast to 2030 (US$ Million)
7.1.5 Others
7.1.5.1 Overview
7.1.5.2 Others Market, Revenue and Forecast to 2030 (US$ Million)
7.2 Concentrated Solar Power Systems
7.2.1 Overview
7.2.2 Concentrated Solar Power Systems Market, Revenue and Forecast to 2030 (US$ Million)
7.2.3 Linear Concentrator
7.2.3.1 Overview
7.2.3.2 Linear Concentrator Market, Revenue and Forecast to 2030 (US$ Million)
7.2.4 Dish/Engine
7.2.4.1 Overview
7.2.4.2 Dish/Engine Market, Revenue and Forecast to 2030 (US$ Million)
7.2.5 Power Tower Systems
7.2.5.1 Overview
7.2.5.2 Power Tower Systems Market, Revenue and Forecast to 2030 (US$ Million)
8. Solar Energy Market Analysis – Application
8.1 Electricity Generation
8.1.1 Overview
8.1.2 Electricity Generation Market Revenue, and Forecast to 2030 (US$ Million)
8.2 Heating
8.2.1 Overview
8.2.2 Heating Market Revenue, and Forecast to 2030 (US$ Million)
8.3 Others
8.3.1 Overview
8.3.2 Others Market Revenue, and Forecast to 2030 (US$ Million)
9. Solar Energy Market Analysis – End User
9.1 Residential
9.1.1 Overview
9.1.2 Residential Market Revenue, and Forecast to 2030 (US$ Million)
9.2 Commercial & Industrial
9.2.1 Overview
9.2.2 Commercial & Industrial Market Revenue, and Forecast to 2030 (US$ Million)
9.3 Utility Scale
9.3.1 Overview
9.3.2 Utility Scale Market Revenue, and Forecast to 2030 (US$ Million)
10. Solar Energy Market - Geographical Analysis
10.1 Overview
10.2 North America
10.2.1 North America Solar Energy Market Overview
10.2.2 North America Solar Energy Market Revenue and Forecasts to 2030 (US$ Mn)
10.2.3 North America Solar Energy Market Breakdown by Technology
10.2.3.1 North America Solar Energy Market Revenue and Forecasts and Analysis - By Technology
10.2.3.2 North America Solar Energy Market Revenue and Forecasts and Analysis - By Photovoltaic Systems
10.2.3.3 North America Solar Energy Market Revenue and Forecasts and Analysis - By Concentrated Solar Power Systems
10.2.4 North America Solar Energy Market Breakdown by Application
10.2.4.1 North America Solar Energy Market Revenue and Forecasts and Analysis - By Application
10.2.5 North America Solar Energy Market Breakdown by End User
10.2.5.1 North America Solar Energy Market Revenue and Forecasts and Analysis - By End User
10.2.6 North America Solar Energy Market Revenue and Forecasts and Analysis - By Country
10.2.6.1 North America Solar Energy Market Revenue and Forecasts and Analysis - By Country
10.2.6.2 US Solar Energy Market Revenue and Forecasts to 2030 (US$ Mn)
10.2.6.2.1 US Solar Energy Market Breakdown by Technology
10.2.6.2.1.1 US Solar Energy Market Breakdown by Photovoltaic Systems
10.2.6.2.1.2 US Solar Energy Market Breakdown by Concentrated Solar Power Systems
10.2.6.2.2 US Solar Energy Market Breakdown by Application
10.2.6.2.3 US Solar Energy Market Breakdown by End User
10.2.6.3 Canada Solar Energy Market Revenue and Forecasts to 2030 (US$ Mn)
10.2.6.3.1 Canada Solar Energy Market Breakdown by Technology
10.2.6.3.1.1 Canada Solar Energy Market Breakdown by Photovoltaic Systems
10.2.6.3.2 Canada Solar Energy Market Breakdown by Application
10.2.6.3.3 Canada Solar Energy Market Breakdown by End User
10.2.6.4 Mexico Solar Energy Market Revenue and Forecasts to 2030 (US$ Mn)
10.2.6.4.1 Mexico Solar Energy Market Breakdown by Technology
10.2.6.4.1.1 Mexico Solar Energy Market Breakdown by Photovoltaic Systems
10.2.6.4.2 Mexico Solar Energy Market Breakdown by Application
10.2.6.4.3 Mexico Solar Energy Market Breakdown by End User
10.3 Europe
10.3.1 Europe Solar Energy Market Overview
10.3.2 Europe Solar Energy Market Revenue and Forecasts to 2030 (US$ Mn)
10.3.3 Europe Solar Energy Market Breakdown by Technology
10.3.3.1 Europe Solar Energy Market Revenue and Forecasts and Analysis - By Technology
10.3.3.2 Europe Solar Energy Market Revenue and Forecasts and Analysis - By Photovoltaic Systems
10.3.3.3 Europe Solar Energy Market Revenue and Forecasts and Analysis - By Concentrated Solar Power Systems
10.3.4 Europe Solar Energy Market Breakdown by Application
10.3.4.1 Europe Solar Energy Market Revenue and Forecasts and Analysis - By Application
10.3.5 Europe Solar Energy Market Breakdown by End User
10.3.5.1 Europe Solar Energy Market Revenue and Forecasts and Analysis - By End User
10.3.6 Europe Solar Energy Market Revenue and Forecasts and Analysis - By Country
10.3.6.1 Europe Solar Energy Market Revenue and Forecasts and Analysis - By Country
10.3.6.2 Germany Solar Energy Market Revenue and Forecasts to 2030 (US$ Mn)
10.3.6.2.1 Germany Solar Energy Market Breakdown by Technology
10.3.6.2.1.1 Germany Solar Energy Market Breakdown by Photovoltaic Systems
10.3.6.2.2 Germany Solar Energy Market Breakdown by Application
10.3.6.2.3 Germany Solar Energy Market Breakdown by End User
10.3.6.3 France Solar Energy Market Revenue and Forecasts to 2030 (US$ Mn)
10.3.6.3.1 France Solar Energy Market Breakdown by Technology
10.3.6.3.1.1 France Solar Energy Market Breakdown by Photovoltaic Systems
10.3.6.3.2 France Solar Energy Market Breakdown by Application
10.3.6.3.3 France Solar Energy Market Breakdown by End User
10.3.6.4 Italy Solar Energy Market Revenue and Forecasts to 2030 (US$ Mn)
10.3.6.4.1 Italy Solar Energy Market Breakdown by Technology
10.3.6.4.1.1 Italy Solar Energy Market Breakdown by Photovoltaic Systems
10.3.6.4.1.2 Italy Solar Energy Market Breakdown by Concentrated Solar Power Systems
10.3.6.4.2 Italy Solar Energy Market Breakdown by Application
10.3.6.4.3 Italy Solar Energy Market Breakdown by End User
10.3.6.5 UK Solar Energy Market Revenue and Forecasts to 2030 (US$ Mn)
10.3.6.5.1 UK Solar Energy Market Breakdown by Technology
10.3.6.5.1.1 UK Solar Energy Market Breakdown by Photovoltaic Systems
10.3.6.5.2 UK Solar Energy Market Breakdown by Application
10.3.6.5.3 UK Solar Energy Market Breakdown by End User
10.3.6.6 Spain Solar Energy Market Revenue and Forecasts to 2030 (US$ Mn)
10.3.6.6.1 Spain Solar Energy Market Breakdown by Technology
10.3.6.6.1.1 Spain Solar Energy Market Breakdown by Photovoltaic Systems
10.3.6.6.1.2 Spain Solar Energy Market Breakdown by Concentrated Solar Power Systems
10.3.6.6.2 Spain Solar Energy Market Breakdown by Application
10.3.6.6.3 Spain Solar Energy Market Breakdown by End User
10.3.6.7 Rest of Europe Solar Energy Market Revenue and Forecasts to 2030 (US$ Mn)
10.3.6.7.1 Rest of Europe Solar Energy Market Breakdown by Technology
10.3.6.7.1.1 Rest of Europe Solar Energy Market Breakdown by Photovoltaic Systems
10.3.6.7.2 Rest of Europe Solar Energy Market Breakdown by Application
10.3.6.7.3 Rest of Europe Solar Energy Market Breakdown by End User
10.4 Asia Pacific Solar Energy Market
10.4.1 Overview
10.4.2 Asia Pacific Solar Energy Market Revenue and Forecasts to 2030 (US$ Mn)
10.4.3 Asia Pacific Solar Energy Market Breakdown by Technology
10.4.3.1 Asia Pacific Solar Energy Market Revenue and Forecasts and Analysis - By Technology
10.4.3.1.1 Asia Pacific Solar Energy Market Revenue and Forecasts and Analysis - By Photovoltaic Systems
10.4.3.1.2 Asia Pacific Solar Energy Market Revenue and Forecasts and Analysis - By Concentrated Solar Power Systems
10.4.4 Asia Pacific Solar Energy Market Breakdown by Application
10.4.4.1 Asia Pacific Solar Energy Market Revenue and Forecasts and Analysis - By Application
10.4.5 Asia Pacific Solar Energy Market Breakdown by End User
10.4.5.1 Asia Pacific Solar Energy Market Revenue and Forecasts and Analysis - By End User
10.4.6 Asia Pacific Solar Energy Market Revenue and Forecasts and Analysis - By Country
10.4.6.1 Asia Pacific Solar Energy Market Revenue and Forecasts and Analysis - By Country
10.4.6.2 Australia Solar Energy Market Revenue and Forecasts to 2030 (US$ Mn)
10.4.6.2.1 Australia Solar Energy Market Breakdown by Technology
10.4.6.2.1.1 Australia Solar Energy Market Breakdown by Photovoltaic Systems
10.4.6.2.2 Australia Solar Energy Market Breakdown by Application
10.4.6.2.3 Australia Solar Energy Market Breakdown by End User
10.4.6.3 China Solar Energy Market Revenue and Forecasts to 2030 (US$ Mn)
10.4.6.3.1 China Solar Energy Market Breakdown by Technology
10.4.6.3.1.1 China Solar Energy Market Breakdown by Photovoltaic Systems
10.4.6.3.1.2 China Solar Energy Market Breakdown by Concentrated Solar Power Systems
10.4.6.3.2 China Solar Energy Market Breakdown by Application
10.4.6.3.3 China Solar Energy Market Breakdown by End User
10.4.6.4 India Solar Energy Market Revenue and Forecasts to 2030 (US$ Mn)
10.4.6.4.1 India Solar Energy Market Breakdown by Technology
10.4.6.4.1.1 India Solar Energy Market Breakdown by Photovoltaic Systems
10.4.6.4.2 India Solar Energy Market Breakdown by Application
10.4.6.4.3 India Solar Energy Market Breakdown by End User
10.4.6.5 Japan Solar Energy Market Revenue and Forecasts to 2030 (US$ Mn)
10.4.6.5.1 Japan Solar Energy Market Breakdown by Technology
10.4.6.5.1.1 Japan Solar Energy Market Breakdown by Photovoltaic Systems
10.4.6.5.2 Japan Solar Energy Market Breakdown by Application
10.4.6.5.3 Japan Solar Energy Market Breakdown by End User
10.4.6.6 South Korea Solar Energy Market Revenue and Forecasts to 2030 (US$ Mn)
10.4.6.6.1 South Korea Solar Energy Market Breakdown by Technology
10.4.6.6.1.1 South Korea Solar Energy Market Breakdown by Photovoltaic Systems
10.4.6.6.2 South Korea Solar Energy Market Breakdown by Application
10.4.6.6.3 South Korea Solar Energy Market Breakdown by End User
10.4.6.7 Rest of Asia Pacific Solar Energy Market Revenue and Forecasts to 2030 (US$ Mn)
10.4.6.7.1 Rest of Asia Pacific Solar Energy Market Breakdown by Technology
10.4.6.7.1.1 Rest of Asia Pacific Solar Energy Market Breakdown by Photovoltaic Systems
10.4.6.7.2 Rest of Asia Pacific Solar Energy Market Breakdown by Application
10.4.6.7.3 Rest of Asia Pacific Solar Energy Market Breakdown by End User
10.5 Middle East & Africa
10.5.1 Middle East & Africa Solar Energy Market Overview
10.5.2 Middle East & Africa Solar Energy Market Revenue and Forecasts to 2030 (US$ Mn)
10.5.3 Middle East & Africa Solar Energy Market Breakdown by Technology
10.5.3.1 Middle East & Africa Solar Energy Market Revenue and Forecasts and Analysis - By Technology
10.5.3.2 Middle East & Africa Solar Energy Market Revenue and Forecasts and Analysis - By Photovoltaic Systems
10.5.3.3 Middle East & Africa Solar Energy Market Revenue and Forecasts and Analysis - By Concentrated Solar Power Systems
10.5.4 Middle East & Africa Solar Energy Market Breakdown by Application
10.5.4.1 Middle East & Africa Solar Energy Market Revenue and Forecasts and Analysis - By Application
10.5.5 Middle East & Africa Solar Energy Market Breakdown by End User
10.5.5.1 Middle East & Africa Solar Energy Market Revenue and Forecasts and Analysis - By End User
10.5.6 Middle East & Africa Solar Energy Market Revenue and Forecasts and Analysis - By Country
10.5.6.1 Middle East & Africa Solar Energy Market Revenue and Forecasts and Analysis - By Country
10.5.6.2 South Africa Solar Energy Market Revenue and Forecasts to 2030 (US$ Mn)
10.5.6.2.1 South Africa Solar Energy Market Breakdown by Technology
10.5.6.2.1.1 South Africa Solar Energy Market Breakdown by Photovoltaic Systems
10.5.6.2.1.2 South Africa Solar Energy Market Breakdown by Concentrated Solar Power Systems
10.5.6.2.2 South Africa Solar Energy Market Breakdown by Application
10.5.6.2.3 South Africa Solar Energy Market Breakdown by End User
10.5.6.3 Saudi Arabia Solar Energy Market Revenue and Forecasts to 2030 (US$ Mn)
10.5.6.3.1 Saudi Arabia Solar Energy Market Breakdown by Technology
10.5.6.3.1.1 Saudi Arabia Solar Energy Market Breakdown by Photovoltaic Systems
10.5.6.3.1.2 Saudi Arabia Solar Energy Market Breakdown by Concentrated Solar Power Systems
10.5.6.3.2 Saudi Arabia Solar Energy Market Breakdown by Application
10.5.6.3.3 Saudi Arabia Solar Energy Market Breakdown by End User
10.5.6.4 UAE Solar Energy Market Revenue and Forecasts to 2030 (US$ Mn)
10.5.6.4.1 UAE Solar Energy Market Breakdown by Technology
10.5.6.4.1.1 UAE Solar Energy Market Breakdown by Photovoltaic Systems
10.5.6.4.1.2 UAE Solar Energy Market Breakdown by Concentrated Solar Power Systems
10.5.6.4.2 UAE Solar Energy Market Breakdown by Application
10.5.6.4.3 UAE Solar Energy Market Breakdown by End User
10.5.6.5 Rest of MEA Solar Energy Market Revenue and Forecasts to 2030 (US$ Mn)
10.5.6.5.1 Rest of MEA Solar Energy Market Breakdown by Technology
10.5.6.5.1.1 Rest of MEA Solar Energy Market Breakdown by Photovoltaic Systems
10.5.6.5.2 Rest of MEA Solar Energy Market Breakdown by Application
10.5.6.5.3 Rest of MEA Solar Energy Market Breakdown by End User
10.6 South America
10.6.1 South America Solar Energy Market Overview
10.6.2 South America Solar Energy Market Revenue and Forecasts to 2030 (US$ Mn)
10.6.3 South America Solar Energy Market Breakdown by Technology
10.6.3.1 South America Solar Energy Market Revenue and Forecasts and Analysis - By Technology
10.6.3.2 South America Solar Energy Market Revenue and Forecasts and Analysis - By Photovoltaic Systems
10.6.4 South America Solar Energy Market Breakdown by Application
10.6.4.1 South America Solar Energy Market Revenue and Forecasts and Analysis - By Application
10.6.5 South America Solar Energy Market Breakdown by End User
10.6.5.1 South America Solar Energy Market Revenue and Forecasts and Analysis - By End User
10.6.6 South America Solar Energy Market Revenue and Forecasts and Analysis - By Countries
10.6.6.1 Brazil Solar Energy Market Revenue and Forecasts to 2030 (US$ Mn)
10.6.6.1.1 Brazil Solar Energy Market Breakdown by Technology
10.6.6.1.1.1 Brazil Solar Energy Market Breakdown by Photovoltaic Systems
10.6.6.1.2 Brazil Solar Energy Market Breakdown by Application
10.6.6.1.3 Brazil Solar Energy Market Breakdown by End User
10.6.6.2 Argentina Solar Energy Market Revenue and Forecasts to 2030 (US$ Mn)
10.6.6.2.1 Argentina Solar Energy Market Breakdown by Technology
10.6.6.2.1.1 Argentina Solar Energy Market Breakdown by Photovoltaic Systems
10.6.6.2.2 Argentina Solar Energy Market Breakdown by Application
10.6.6.2.3 Argentina Solar Energy Market Breakdown by End User
10.6.6.3 Rest of SAM Solar Energy Market Revenue and Forecasts to 2030 (US$ Mn)
10.6.6.3.1 Rest of SAM Solar Energy Market Breakdown by Technology
10.6.6.3.1.1 Rest of SAM Solar Energy Market Breakdown by Photovoltaic Systems
10.6.6.3.2 Rest of SAM Solar Energy Market Breakdown by Application
10.6.6.3.3 Rest of SAM Solar Energy Market Breakdown by End User
11. Solar Energy Market – Impact of COVID-19 Pandemic
11.1 Pre & Post Covid-19 Impact
12. Competitive Landscape
12.1 Heat Map Analysis by Key Players
12.2 Company Positioning & Concentration
13. Industry Landscape
13.1 Overview
13.2 Market Initiative
13.3 New Product Development
13.4 Merger and Acquisition
14. Company Profiles
14.1 ADT Solar LLC
14.1.1 Key Facts
14.1.2 Business Description
14.1.3 Products and Services
14.1.4 Financial Overview
14.1.5 SWOT Analysis
14.1.6 Key Developments
14.2 Heliogen Inc
14.2.1 Key Facts
14.2.2 Business Description
14.2.3 Products and Services
14.2.4 Financial Overview
14.2.5 SWOT Analysis
14.2.6 Key Developments
14.3 Acciona SA
14.3.1 Key Facts
14.3.2 Business Description
14.3.3 Products and Services
14.3.4 Financial Overview
14.3.5 SWOT Analysis
14.3.6 Key Developments
14.4 Abengoa SA
14.4.1 Key Facts
14.4.2 Business Description
14.4.3 Products and Services
14.4.4 Financial Overview
14.4.5 SWOT Analysis
14.4.6 Key Developments
14.5 Trina Solar Co Ltd
14.5.1 Key Facts
14.5.2 Business Description
14.5.3 Products and Services
14.5.4 Financial Overview
14.5.5 SWOT Analysis
14.5.6 Key Developments
14.6 First Solar Inc
14.6.1 Key Facts
14.6.2 Business Description
14.6.3 Products and Services
14.6.4 Financial Overview
14.6.5 SWOT Analysis
14.6.6 Key Developments
14.7 NextEra Energy Inc
14.7.1 Key Facts
14.7.2 Business Description
14.7.3 Products and Services
14.7.4 Financial Overview
14.7.5 SWOT Analysis
14.7.6 Key Developments
14.8 JinkoSolar Holding Co Ltd
14.8.1 Key Facts
14.8.2 Business Description
14.8.3 Products and Services
14.8.4 Financial Overview
14.8.5 SWOT Analysis
14.8.6 Key Developments
14.9 Canadian Solar Inc
14.9.1 Key Facts
14.9.2 Business Description
14.9.3 Products and Services
14.9.4 Financial Overview
14.9.5 SWOT Analysis
14.9.6 Key Developments
14.10 Kelvin Energy Inc
14.10.1 Key Facts
14.10.2 Business Description
14.10.3 Products and Services
14.10.4 Financial Overview
14.10.5 SWOT Analysis
14.10.6 Key Developments
15. Appendix
15.1 About The Insight Partners
15.2 Word Index
List of Tables
Table 1. Solar Energy Market Segmentation
Table 2. List of Vendors in the Value Chain
Table 3. Solar Energy Market Revenue and Forecasts To 2030 (US$ Million)
Table 4. Solar Energy Market Revenue and Forecasts To 2030 (US$ Million) – Technology
Table 5. Solar Energy Market Revenue and Forecasts To 2030 (US$ Million) – Photovoltaic
Table 6. Solar Energy Market Revenue and Forecasts To 2030 (US$ Million) – Concentrated Solar Power
Table 7. Upcoming CSP Solar Projects
Table 8. Solar Energy Market Revenue and Forecasts To 2030 (US$ Million) – Application
Table 9. Solar Energy Market Revenue and Forecasts To 2030 (US$ Million) – End User
Table 10. North America Solar Energy Market Revenue and Forecasts To 2030 (US$ Mn) – By Technology
Table 11. North America Solar Energy Market Revenue and Forecasts To 2030 (US$ Mn) – By Photovoltaic Systems
Table 12. North America Solar Energy Market Revenue and Forecasts To 2030 (US$ Mn) – By Concentrated Solar Power Systems
Table 13. North America Solar Energy Market Revenue and Forecasts To 2030 (US$ Mn) – By Application
Table 14. North America Solar Energy Market Revenue and Forecasts To 2030 (US$ Mn) – By End User
Table 15. North America Solar Energy Market Revenue and Forecasts To 2030 (US$ Mn) – By Country
Table 16. US Solar Energy Market Revenue and Forecasts To 2030 (US$ Mn) – By Technology
Table 17. US Solar Energy Market Revenue and Forecasts To 2030 (US$ Mn) – By Photovoltaic Systems
Table 18. US Solar Energy Market Revenue and Forecasts To 2030 (US$ Mn) – By Concentrated Solar Power Systems
Table 19. US Solar Energy Market Revenue and Forecasts To 2030 (US$ Mn) – By Application
Table 20. US Solar Energy Market Revenue and Forecasts To 2030 (US$ Mn) – By End User
Table 21. Canada Solar Energy Market Revenue and Forecasts To 2030 (US$ Mn) – By Technology
Table 22. Canada Solar Energy Market Revenue and Forecasts To 2030 (US$ Mn) – By Photovoltaic Systems
Table 23. Canada Solar Energy Market Revenue and Forecasts To 2030 (US$ Mn) – By Application
Table 24. Canada Solar Energy Market Revenue and Forecasts To 2030 (US$ Mn) – By End User
Table 25. Mexico Solar Energy Market Revenue and Forecasts To 2030 (US$ Mn) – By Technology
Table 26. Mexico Solar Energy Market Revenue and Forecasts To 2030 (US$ Mn) – By Photovoltaic Systems
Table 27. Mexico Solar Energy Market Revenue and Forecasts To 2030 (US$ Mn) – By Application
Table 28. Mexico Solar Energy Market Revenue and Forecasts To 2030 (US$ Mn) – By End User
Table 29. Europe Solar Energy Market Revenue and Forecasts To 2030 (US$ Mn) – By Technology
Table 30. Europe Solar Energy Market Revenue and Forecasts To 2030 (US$ Mn) – By Photovoltaic Systems
Table 31. Europe Solar Energy Market Revenue and Forecasts To 2030 (US$ Mn) – By Concentrated Solar Power Systems
Table 32. Europe Solar Energy Market Revenue and Forecasts To 2030 (US$ Mn) – By Application
Table 33. Europe Solar Energy Market Revenue and Forecasts To 2030 (US$ Mn) – By End User
Table 34. Europe Solar Energy Market Revenue and Forecasts To 2030 (US$ Mn) – By Country
Table 35. Germany Solar Energy Market Revenue and Forecasts To 2030 (US$ Mn) – By Technology
Table 36. Germany Solar Energy Market Revenue and Forecasts To 2030 (US$ Mn) – By Photovoltaic Systems
Table 37. Germany Solar Energy Market Revenue and Forecasts To 2030 (US$ Mn) – By Application
Table 38. Germany Solar Energy Market Revenue and Forecasts To 2030 (US$ Mn) – By End User
Table 39. France Solar Energy Market Revenue and Forecasts To 2030 (US$ Mn) – By Technology
Table 40. France Solar Energy Market Revenue and Forecasts To 2030 (US$ Mn) – By Photovoltaic Systems
Table 41. France Solar Energy Market Revenue and Forecasts To 2030 (US$ Mn) – By Application
Table 42. France Solar Energy Market Revenue and Forecasts To 2030 (US$ Mn) – By End User
Table 43. Italy Solar Energy Market Revenue and Forecasts To 2030 (US$ Mn) – By Technology
Table 44. Italy Solar Energy Market Revenue and Forecasts To 2030 (US$ Mn) – By Photovoltaic Systems
Table 45. Italy Solar Energy Market Revenue and Forecasts To 2030 (US$ Mn) – By Concentrated Solar Power Systems
Table 46. Italy Solar Energy Market Revenue and Forecasts To 2030 (US$ Mn) – By Application
Table 47. Italy Solar Energy Market Revenue and Forecasts To 2030 (US$ Mn) – By End User
Table 48. UK Solar Energy Market Revenue and Forecasts To 2030 (US$ Mn) – By Technology
Table 49. UK Solar Energy Market Revenue and Forecasts To 2030 (US$ Mn) – By Photovoltaic Systems
Table 50. UK Solar Energy Market Revenue and Forecasts To 2030 (US$ Mn) – By Application
Table 51. UK Solar Energy Market Revenue and Forecasts To 2030 (US$ Mn) – By End User
Table 52. Spain Solar Energy Market Revenue and Forecasts To 2030 (US$ Mn) – By Technology
Table 53. Spain Solar Energy Market Revenue and Forecasts To 2030 (US$ Mn) – By Photovoltaic Systems
Table 54. Spain Solar Energy Market Revenue and Forecasts To 2030 (US$ Mn) – By Concentrated Solar Power Systems
Table 55. Spain Solar Energy Market Revenue and Forecasts To 2030 (US$ Mn) – By Application
Table 56. Spain Solar Energy Market Revenue and Forecasts To 2030 (US$ Mn) – By End User
Table 57. Rest of Europe Solar Energy Market Revenue and Forecasts To 2030 (US$ Mn) – By Technology
Table 58. Rest of Europe Solar Energy Market Revenue and Forecasts To 2030 (US$ Mn) – By Photovoltaic Systems
Table 59. Rest of Europe Solar Energy Market Revenue and Forecasts To 2030 (US$ Mn) – By Application
Table 60. Rest of Europe Solar Energy Market Revenue and Forecasts To 2030 (US$ Mn) – By End User
Table 61. Asia Pacific Solar Energy Market Revenue and Forecasts To 2030 (US$ Mn) – By Technology
Table 62. Asia Pacific Solar Energy Market Revenue and Forecasts To 2030 (US$ Mn) – By Photovoltaic Systems
Table 63. Asia Pacific Solar Energy Market Revenue and Forecasts To 2030 (US$ Mn) – By Concentrated Solar Power Systems
Table 64. Asia Pacific Solar Energy Market Revenue and Forecasts To 2030 (US$ Mn) – By Application
Table 65. Asia Pacific Solar Energy Market Revenue and Forecasts To 2030 (US$ Mn) – By End User
Table 66. Asia Pacific Solar Energy Market Revenue and Forecasts To 2030 (US$ Mn) – By Country
Table 67. Australia Solar Energy Market Revenue and Forecasts To 2030 (US$ Mn) – By Technology
Table 68. Australia Solar Energy Market Revenue and Forecasts To 2030 (US$ Mn) – By Photovoltaic Systems
Table 69. Australia Solar Energy Market Revenue and Forecasts To 2030 (US$ Mn) – By Application
Table 70. Australia Solar Energy Market Revenue and Forecasts To 2030 (US$ Mn) – By End User
Table 71. China Solar Energy Market Revenue and Forecasts To 2030 (US$ Mn) – By Technology
Table 72. China Solar Energy Market Revenue and Forecasts To 2030 (US$ Mn) – By Photovoltaic Systems
Table 73. China Solar Energy Market Revenue and Forecasts To 2030 (US$ Mn) – By Concentrated Solar Power Systems
Table 74. China Solar Energy Market Revenue and Forecasts To 2030 (US$ Mn) – By Application
Table 75. China Solar Energy Market Revenue and Forecasts To 2030 (US$ Mn) – By End User
Table 76. India Solar Energy Market Revenue and Forecasts To 2030 (US$ Mn) – By Technology
Table 77. India Solar Energy Market Revenue and Forecasts To 2030 (US$ Mn) – By Photovoltaic Systems
Table 78. India Solar Energy Market Revenue and Forecasts To 2030 (US$ Mn) – By Application
Table 79. India Solar Energy Market Revenue and Forecasts To 2030 (US$ Mn) – By End User
Table 80. Japan Solar Energy Market Revenue and Forecasts To 2030 (US$ Mn) – By Technology
Table 81. Japan Solar Energy Market Revenue and Forecasts To 2030 (US$ Mn) – By Photovoltaic Systems
Table 82. Japan Solar Energy Market Revenue and Forecasts To 2030 (US$ Mn) – By Application
Table 83. Japan Solar Energy Market Revenue and Forecasts To 2030 (US$ Mn) – By End User
Table 84. South Korea Solar Energy Market Revenue and Forecasts To 2030 (US$ Mn) – By Technology
Table 85. South Korea Solar Energy Market Revenue and Forecasts To 2030 (US$ Mn) – By Photovoltaic Systems
Table 86. South Korea Solar Energy Market Revenue and Forecasts To 2030 (US$ Mn) – By Application
Table 87. South Korea Solar Energy Market Revenue and Forecasts To 2030 (US$ Mn) – By End User
Table 88. Rest of Asia Pacific Solar Energy Market Revenue and Forecasts To 2030 (US$ Mn) – By Technology
Table 89. Rest of Asia Pacific Solar Energy Market Revenue and Forecasts To 2030 (US$ Mn) – By Photovoltaic Systems
Table 90. Rest of Asia Pacific Solar Energy Market Revenue and Forecasts To 2030 (US$ Mn) – By Application
Table 91. Rest of Asia Pacific Solar Energy Market Revenue and Forecasts To 2030 (US$ Mn) – By End User
Table 92. Middle East & Africa Solar Energy Market Revenue and Forecasts To 2030 (US$ Mn) – By Technology
Table 93. Middle East & Africa Solar Energy Market Revenue and Forecasts To 2030 (US$ Mn) – By Photovoltaic Systems
Table 94. Middle East & Africa Solar Energy Market Revenue and Forecasts To 2030 (US$ Mn) – By Concentrated Solar Power Systems
Table 95. Middle East & Africa Solar Energy Market Revenue and Forecasts To 2030 (US$ Mn) – By Application
Table 96. Middle East & Africa Solar Energy Market Revenue and Forecasts To 2030 (US$ Mn) – By End User
Table 97. Middle East & Africa Solar Energy Market Revenue and Forecasts To 2030 (US$ Mn) – By Country
Table 98. South Africa Solar Energy Market Revenue and Forecasts To 2030 (US$ Mn) – By Technology
Table 99. South Africa Solar Energy Market Revenue and Forecasts To 2030 (US$ Mn) – By Photovoltaic Systems
Table 100. South Africa Solar Energy Market Revenue and Forecasts To 2030 (US$ Mn) – By Concentrated Solar Power Systems
Table 101. South Africa Solar Energy Market Revenue and Forecasts To 2030 (US$ Mn) – By Application
Table 102. South Africa Solar Energy Market Revenue and Forecasts To 2030 (US$ Mn) – By End User
Table 103. Saudi Arabia Solar Energy Market Revenue and Forecasts To 2030 (US$ Mn) – By Technology
Table 104. Saudi Arabia Solar Energy Market Revenue and Forecasts To 2030 (US$ Mn) – By Photovoltaic Systems
Table 105. Saudi Arabia Solar Energy Market Revenue and Forecasts To 2030 (US$ Mn) – By Concentrated Solar Power Systems
Table 106. Saudi Arabia Solar Energy Market Revenue and Forecasts To 2030 (US$ Mn) – By Application
Table 107. Saudi Arabia Solar Energy Market Revenue and Forecasts To 2030 (US$ Mn) – By End User
Table 108. UAE Solar Energy Market Revenue and Forecasts To 2030 (US$ Mn) – By Technology
Table 109. UAE Solar Energy Market Revenue and Forecasts To 2030 (US$ Mn) – By Photovoltaic Systems
Table 110. UAE Solar Energy Market Revenue and Forecasts To 2030 (US$ Mn) – By Concentrated Solar Power Systems
Table 111. UAE Solar Energy Market Revenue and Forecasts To 2030 (US$ Mn) – By Application
Table 112. UAE Solar Energy Market Revenue and Forecasts To 2030 (US$ Mn) – By End User
Table 113. Rest of MEA Solar Energy Market Revenue and Forecasts To 2030 (US$ Mn) – By Technology
Table 114. Rest of MEA Solar Energy Market Revenue and Forecasts To 2030 (US$ Mn) – By Photovoltaic Systems
Table 115. Rest of MEA Solar Energy Market Revenue and Forecasts To 2030 (US$ Mn) – By Application
Table 116. Rest of MEA Solar Energy Market Revenue and Forecasts To 2030 (US$ Mn) – By End User
Table 117. South America Solar Energy Market Revenue and Forecasts To 2030 (US$ Mn) – By Technology
Table 118. South America Solar Energy Market Revenue and Forecasts To 2030 (US$ Mn) – By Photovoltaic Systems
Table 119. South America Solar Energy Market Revenue and Forecasts To 2030 (US$ Mn) – By Application
Table 120. South America Solar Energy Market Revenue and Forecasts To 2030 (US$ Mn) – By End User
Table 121. South America Solar Energy Market Revenue and Forecasts To 2030 (US$ Mn) – By Country
Table 122. Brazil Solar Energy Market Revenue and Forecasts To 2030 (US$ Mn) – By Technology
Table 123. Brazil Solar Energy Market Revenue and Forecasts To 2030 (US$ Mn) – By Photovoltaic Systems
Table 124. Brazil Solar Energy Market Revenue and Forecasts To 2030 (US$ Mn) – By Application
Table 125. Brazil Solar Energy Market Revenue and Forecasts To 2030 (US$ Mn) – By End User
Table 126. Argentina Solar Energy Market Revenue and Forecasts To 2030 (US$ Mn) – By Technology
Table 127. Argentina Solar Energy Market Revenue and Forecasts To 2030 (US$ Mn) – By Photovoltaic Systems
Table 128. Argentina Solar Energy Market Revenue and Forecasts To 2030 (US$ Mn) – By Application
Table 129. Argentina Solar Energy Market Revenue and Forecasts To 2030 (US$ Mn) – By End User
Table 130. Rest of SAM Solar Energy Market Revenue and Forecasts To 2030 (US$ Mn) – By Technology
Table 131. Rest of SAM Solar Energy Market Revenue and Forecasts To 2030 (US$ Mn) – By Photovoltaic Systems
Table 132. Rest of SAM Solar Energy Market Revenue and Forecasts To 2030 (US$ Mn) – By Application
Table 133. Rest of SAM Solar Energy Market Revenue and Forecasts To 2030 (US$ Mn) – By End User
Table 134. Heat Map Analysis by Key Players
Table 135. List of Abbreviation
List of Figures
Figure 1. Solar Energy Market Segmentation, By Geography
Figure 2. PEST Analysis
Figure 3. Ecosystem: Solar Energy Market
Figure 4. Impact Analysis of Drivers and Restraints
Figure 5. Solar Energy Market Breakdown by Geography, 2022 and 2030 (%)
Figure 6. Solar Energy Market Revenue (US$ Million), 2022 – 2030
Figure 7. Solar Energy Market Share (%) – Technology, 2022 and 2030
Figure 8. Photovoltaic Systems Market Revenue and Forecasts To 2030 (US$ Million)
Figure 9. Monocrystalline Market Revenue and Forecasts To 2030 (US$ Million)
Figure 10. Polycrystalline Market Revenue and Forecasts To 2030 (US$ Million)
Figure 11. Others Market Revenue and Forecasts To 2030 (US$ Million)
Figure 12. Concentrated Solar Power Systems Market Revenue and Forecasts To 2030 (US$ Million)
Figure 13. Linear Concentrator Market Revenue and Forecasts To 2030 (US$ Million)
Figure 14. Dish/Engine Market Revenue and Forecasts To 2030 (US$ Million)
Figure 15. Power Tower Systems Market Revenue and Forecasts To 2030 (US$ Million)
Figure 16. Solar Energy Market Share (%) – Application, 2022 and 2030
Figure 17. Electricity Generation Market Revenue and Forecasts To 2030 (US$ Million)
Figure 18. Heating Market Revenue and Forecasts To 2030 (US$ Million)
Figure 19. Others Market Revenue and Forecasts To 2030 (US$ Million)
Figure 20. Solar Energy Market Share (%) – End User, 2022 and 2030
Figure 21. Residential Market Revenue and Forecasts To 2030 (US$ Million)
Figure 22. Commercial & Industrial Market Revenue and Forecasts To 2030 (US$ Million)
Figure 23. Utility Scale Market Revenue and Forecasts To 2030 (US$ Million)
Figure 24. Solar Energy Market Breakdown by Region, 2022 and 2030 (%)
Figure 25. North America Solar Energy Market Revenue and Forecasts To 2030 (US$ Mn)
Figure 26. North America Solar Energy Market Breakdown by Technology (2022 and 2030)
Figure 27. North America Solar Energy Market Breakdown by Application (2022 and 2030)
Figure 28. North America Solar Energy Market Breakdown by End User (2022 and 2030)
Figure 29. North America Solar Energy Market Breakdown by Key Countries, 2022 and 2030 (%)
Figure 30. US Solar Energy Market Revenue and Forecasts To 2030 (US$ Mn)
Figure 31. Canada Solar Energy Market Revenue and Forecasts To 2030 (US$ Mn)
Figure 32. Mexico Solar Energy Market Revenue and Forecasts To 2030 (US$ Mn)
Figure 33. Europe Solar Energy Market Revenue and Forecasts To 2030 (US$ Mn)
Figure 34. Europe Solar Energy Market Breakdown by Technology (2022 and 2030)
Figure 35. Europe Solar Energy Market Breakdown by Application (2022 and 2030)
Figure 36. Europe Solar Energy Market Breakdown by End User (2022 and 2030)
Figure 37. Europe Solar Energy Market Breakdown by Key Countries, 2022 and 2030 (%)
Figure 38. Germany Solar Energy Market Revenue and Forecasts To 2030 (US$ Mn)
Figure 39. France Solar Energy Market Revenue and Forecasts To 2030 (US$ Mn)
Figure 40. Italy Solar Energy Market Revenue and Forecasts To 2030 (US$ Mn)
Figure 41. UK Solar Energy Market Revenue and Forecasts To 2030 (US$ Mn)
Figure 42. Spain Solar Energy Market Revenue and Forecasts To 2030 (US$ Mn)
Figure 43. Rest of Europe Solar Energy Market Revenue and Forecasts To 2030 (US$ Mn)
Figure 44. Asia Pacific Solar Energy Market Revenue and Forecasts To 2030 (US$ Mn)
Figure 45. Asia Pacific Solar Energy Market Breakdown by Technology (2022 and 2030)
Figure 46. Asia Pacific Solar Energy Market Breakdown by Application (2022 and 2030)
Figure 47. Asia Pacific Solar Energy Market Breakdown by End User (2022 and 2030)
Figure 48. Asia Pacific Solar Energy Market Breakdown by Key Countries, 2022 and 2030 (%)
Figure 49. Australia Solar Energy Market Revenue and Forecasts To 2030 (US$ Mn)
Figure 50. China Solar Energy Market Revenue and Forecasts To 2030 (US$ Mn)
Figure 51. India Solar Energy Market Revenue and Forecasts To 2030 (US$ Mn)
Figure 52. Japan Solar Energy Market Revenue and Forecasts To 2030 (US$ Mn)
Figure 53. South Korea Solar Energy Market Revenue and Forecasts To 2030 (US$ Mn)
Figure 54. Rest of Asia Pacific Solar Energy Market Revenue and Forecasts To 2030 (US$ Mn)
Figure 55. Middle East & Africa Solar Energy Market Revenue and Forecasts To 2030 (US$ Mn)
Figure 56. Middle East & Africa Solar Energy Market Breakdown by Technology (2022 and 2030)
Figure 57. Middle East & Africa Solar Energy Market Breakdown by Application (2022 and 2030)
Figure 58. Middle East & Africa Solar Energy Market Breakdown by End User (2022 and 2030)
Figure 59. Middle East & Africa Solar Energy Market Breakdown by Key Countries, 2022 and 2030 (%)
Figure 60. South Africa Solar Energy Market Revenue and Forecasts To 2030 (US$ Mn)
Figure 61. Saudi Arabia Solar Energy Market Revenue and Forecasts To 2030 (US$ Mn)
Figure 62. UAE Solar Energy Market Revenue and Forecasts To 2030 (US$ Mn)
Figure 63. Rest of MEA Solar Energy Market Revenue and Forecasts To 2030 (US$ Mn)
Figure 64. South America Solar Energy Market Revenue and Forecasts To 2030 (US$ Mn)
Figure 65. South America Solar Energy Market Breakdown by Technology (2022 and 2030)
Figure 66. South America Solar Energy Market Breakdown by Application (2022 and 2030)
Figure 67. South America Solar Energy Market Breakdown by End User (2022 and 2030)
Figure 68. South America Solar Energy Market Breakdown by Key Countries, 2022 and 2030 (%)
Figure 69. Brazil Solar Energy Market Revenue and Forecasts To 2030 (US$ Mn)
Figure 70. Argentina Solar Energy Market Revenue and Forecasts To 2030 (US$ Mn)
Figure 71. Rest of SAM Solar Energy Market Revenue and Forecasts To 2030 (US$ Mn)
Figure 72. Company Positioning & Concentration
The Insight Partners performs research in 4 major stages: Data Collection & Secondary Research, Primary Research, Data Analysis and Data Triangulation & Final Review.
- Data Collection and Secondary Research:
As a market research and consulting firm operating from a decade, we have published many reports and advised several clients across the globe. First step for any study will start with an assessment of currently available data and insights from existing reports. Further, historical and current market information is collected from Investor Presentations, Annual Reports, SEC Filings, etc., and other information related to company’s performance and market positioning are gathered from Paid Databases (Factiva, Hoovers, and Reuters) and various other publications available in public domain.
Several associations trade associates, technical forums, institutes, societies and organizations are accessed to gain technical as well as market related insights through their publications such as research papers, blogs and press releases related to the studies are referred to get cues about the market. Further, white papers, journals, magazines, and other news articles published in the last 3 years are scrutinized and analyzed to understand the current market trends.
- Primary Research:
The primarily interview analysis comprise of data obtained from industry participants interview and answers to survey questions gathered by in-house primary team.
For primary research, interviews are conducted with industry experts/CEOs/Marketing Managers/Sales Managers/VPs/Subject Matter Experts from both demand and supply side to get a 360-degree view of the market. The primary team conducts several interviews based on the complexity of the markets to understand the various market trends and dynamics which makes research more credible and precise.
A typical research interview fulfils the following functions:
- Provides first-hand information on the market size, market trends, growth trends, competitive landscape, and outlook
- Validates and strengthens in-house secondary research findings
- Develops the analysis team’s expertise and market understanding
Primary research involves email interactions and telephone interviews for each market, category, segment, and sub-segment across geographies. The participants who typically take part in such a process include, but are not limited to:
- Industry participants: VPs, business development managers, market intelligence managers and national sales managers
- Outside experts: Valuation experts, research analysts and key opinion leaders specializing in the electronics and semiconductor industry.
Below is the breakup of our primary respondents by company, designation, and region:

Once we receive the confirmation from primary research sources or primary respondents, we finalize the base year market estimation and forecast the data as per the macroeconomic and microeconomic factors assessed during data collection.
- Data Analysis:
Once data is validated through both secondary as well as primary respondents, we finalize the market estimations by hypothesis formulation and factor analysis at regional and country level.
- 3.1 Macro-Economic Factor Analysis:
We analyse macroeconomic indicators such the gross domestic product (GDP), increase in the demand for goods and services across industries, technological advancement, regional economic growth, governmental policies, the influence of COVID-19, PEST analysis, and other aspects. This analysis aids in setting benchmarks for various nations/regions and approximating market splits. Additionally, the general trend of the aforementioned components aid in determining the market's development possibilities.
- 3.2 Country Level Data:
Various factors that are especially aligned to the country are taken into account to determine the market size for a certain area and country, including the presence of vendors, such as headquarters and offices, the country's GDP, demand patterns, and industry growth. To comprehend the market dynamics for the nation, a number of growth variables, inhibitors, application areas, and current market trends are researched. The aforementioned elements aid in determining the country's overall market's growth potential.
- 3.3 Company Profile:
The “Table of Contents” is formulated by listing and analyzing more than 25 - 30 companies operating in the market ecosystem across geographies. However, we profile only 10 companies as a standard practice in our syndicate reports. These 10 companies comprise leading, emerging, and regional players. Nonetheless, our analysis is not restricted to the 10 listed companies, we also analyze other companies present in the market to develop a holistic view and understand the prevailing trends. The “Company Profiles” section in the report covers key facts, business description, products & services, financial information, SWOT analysis, and key developments. The financial information presented is extracted from the annual reports and official documents of the publicly listed companies. Upon collecting the information for the sections of respective companies, we verify them via various primary sources and then compile the data in respective company profiles. The company level information helps us in deriving the base number as well as in forecasting the market size.
- 3.4 Developing Base Number:
Aggregation of sales statistics (2020-2022) and macro-economic factor, and other secondary and primary research insights are utilized to arrive at base number and related market shares for 2022. The data gaps are identified in this step and relevant market data is analyzed, collected from paid primary interviews or databases. On finalizing the base year market size, forecasts are developed on the basis of macro-economic, industry and market growth factors and company level analysis.
- Data Triangulation and Final Review:
The market findings and base year market size calculations are validated from supply as well as demand side. Demand side validations are based on macro-economic factor analysis and benchmarks for respective regions and countries. In case of supply side validations, revenues of major companies are estimated (in case not available) based on industry benchmark, approximate number of employees, product portfolio, and primary interviews revenues are gathered. Further revenue from target product/service segment is assessed to avoid overshooting of market statistics. In case of heavy deviations between supply and demand side values, all thes steps are repeated to achieve synchronization.
We follow an iterative model, wherein we share our research findings with Subject Matter Experts (SME’s) and Key Opinion Leaders (KOLs) until consensus view of the market is not formulated – this model negates any drastic deviation in the opinions of experts. Only validated and universally acceptable research findings are quoted in our reports.
We have important check points that we use to validate our research findings – which we call – data triangulation, where we validate the information, we generate from secondary sources with primary interviews and then we re-validate with our internal data bases and Subject matter experts. This comprehensive model enables us to deliver high quality, reliable data in shortest possible time.
 Get Free Sample For