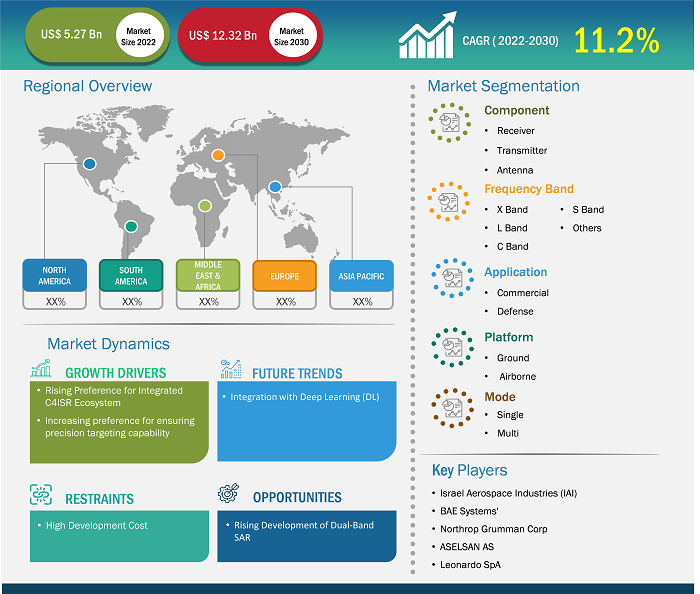
The synthetic aperture radar market size is projected to reach US$ 12.32 billion by 2030 from US$ 5.27 billion in 2022. The market is expected to register a CAGR of 11.2% during 2022–2030. Integration with deep learning is likely to remain a key trend in the market.
Synthetic Aperture Radar Market Analysis
Various reasons fuel the synthetic aperture radar market growth. Factors such as the rising demand for advanced technologies that offer enhanced environmental awareness, the increasing need for efficient surveillance and communication networks, the growing deployment of space-based radars, and the increasing utilization of SAR for environmental awareness and mapping purposes play a crucial role in market expansion. Moreover, the rising development of dual-band SAR is expected to bring new synthetic aperture radar market trends in the coming years.
Synthetic Aperture Radar Market Overview
Synthetic Aperture Radar (SAR) is an innovative remote sensing technique that employs radar technology to generate high-resolution images of the Earth's surface. Optical sensors rely on sunlight; however, SAR utilizes its energy source to illuminate the target area and capture the reflected energy. This active data collection approach enables SAR to operate effectively under any lighting conditions, day or night, and in all kinds of weather, making it a useful and valuable tool for numerous applications. The functioning of SAR involves leveraging the flight trajectory of the radar platform, be it an aircraft or a satellite, to simulate a large antenna electronically. The radar system emits radio waves toward the Earth's surface and records the signals that bounce back, a process known as backscattering. This process is repeated multiple times during transmit/receive cycles, with the resulting data being electronically stored. Subsequently, the stored data is meticulously processed to generate a comprehensive and high-resolution image of the observed terrain.
Customize Research To Suit Your Requirement
We can optimize and tailor the analysis and scope which is unmet through our standard offerings. This flexibility will help you gain the exact information needed for your business planning and decision making.
Synthetic Aperture Radar Market: Strategic Insights
Market Size Value in US$ 5.27 billion in 2022 Market Size Value by US$ 12.32 billion by 2030 Growth rate CAGR of 11.2% from 2022 to 2030 Forecast Period 2022-2030 Base Year 2022

Naveen
Have a question?
Naveen will walk you through a 15-minute call to present the report’s content and answer all queries if you have any.
 Speak to Analyst
Customize Research To Suit Your Requirement
We can optimize and tailor the analysis and scope which is unmet through our standard offerings. This flexibility will help you gain the exact information needed for your business planning and decision making.
Synthetic Aperture Radar Market: Strategic Insights
| Market Size Value in | US$ 5.27 billion in 2022 |
| Market Size Value by | US$ 12.32 billion by 2030 |
| Growth rate | CAGR of 11.2% from 2022 to 2030 |
| Forecast Period | 2022-2030 |
| Base Year | 2022 |
Naveen
Have a question?
Naveen will walk you through a 15-minute call to present the report’s content and answer all queries if you have any.
Speak to Analyst
Synthetic Aperture Radar Market Drivers and Opportunities
Rising Preference for Integrated C4ISR Ecosystem to Favor Market
The market is driven by the increasing preference for an integrated Command, Control, Communications, Computers, Intelligence, Surveillance, and Reconnaissance (C4ISR) ecosystem. Traditionally, C4ISR systems have relied on separate stand-alone units, each equipped for specific functions and mission requirements. This approach often leads to the use of separate systems and displays for collecting and analyzing information, resulting in a rigorous and time-consuming process. To address these challenges, defense agencies are leaning toward adopting an enterprise integration approach. This approach advocates for the integration of secure and interoperable C4ISR networks and systems to streamline the entire process. In this integrated C4ISR approach, governments take responsibility for designing enterprise blueprints and intersystem interfaces. At the same time, vendors deliver individual systems and sub-components that can be seamlessly integrated into the overall C4ISR environment.
Rising Development of Dual-Band SAR
Dual-band synthetic aperture radar (SAR) technology operates in two frequency bands simultaneously, allowing for enhanced imaging capabilities and improved image quality compared to single-band SAR systems. The use of dual-band SAR offers several advantages. Firstly, it enables better target discrimination and identification, as the combination of two different frequency bands provides more detailed and accurate imaging. This is particularly valuable in applications such as military surveillance, border control, and maritime monitoring, where the ability to distinguish between objects and detect subtle changes is crucial. Secondly, dual-band SAR technology enhances the system's ability to penetrate and detect objects under challenging environmental conditions. Utilizing two different frequency bands, SAR systems can overcome limitations posed by factors such as vegetation cover, weather conditions, and surface roughness. Thus, dual-band synthetic aperture radar (SAR) technology has emerged as a significant advancement in the synthetic aperture radar market, presenting new opportunities for market growth and expansion.
Synthetic Aperture Radar Market Report Segmentation Analysis
Key segments that contributed to the derivation of the synthetic aperture radar market analysis are the component, frequency band, application, platform, and mode.
- Based on the components, the synthetic aperture radar market is divided into receiver, transmitter, and antenna. The antenna segment will hold a significant market share in 2022.
- By frequency band, the market is segmented into X band, L band, C band, S band, and others. The X band segment held the largest market share in 2022.
- In terms of application, the market is segmented into commercial and defense. The defense segment is expected to grow with the highest CAGR over the forecast period.
- In terms of platform, the market is segmented into ground and airborne. The airborne segment is expected to grow with the highest CAGR over the forecast period.
- In terms of mode, the market is segmented into single and multi. The multi-segment is expected to grow with the highest CAGR over the forecast period.
Synthetic Aperture Radar Market Share Analysis by Geography
The geographic scope of the synthetic aperture radar market report is mainly divided into five regions: North America, Asia Pacific, Europe, Middle East & Africa, and South & Central America.
The North American market has gained prominence in the region for several reasons. The US dominated the synthetic aperture radar market share in 2022. Synthetic aperture radar technology is widely used in various applications, including military & defense, monitoring, exploration, agriculture, urban planning, infrastructure development, and natural resource management. Various factors drive the demand for synthetic aperture radar technology. In military applications, synthetic aperture radar (SAR) is used for surveillance, detection of surface features, and topographical mapping. The US military is replacing its legacy systems with advanced synthetic aperture radars, which is contributing to the growth of the market. Additionally, the need for geospatial information is increasing in sectors such as agriculture, urban planning, infrastructure development, and natural resource management. Synthetic aperture radar provides valuable data for these applications, further fuelling the synthetic aperture radar market growth.
Synthetic Aperture Radar Market Report Scope
Synthetic Aperture Radar Market News and Recent Developments
The synthetic aperture radar market is evaluated by gathering qualitative and quantitative data post primary and secondary research, which includes important corporate publications, association data, and databases. A few of the developments in the synthetic aperture radar market are listed below:
- Israel Aerospace Industries (IAI) launched Singapore's DS-SAR radar satellite, showcasing the company's expertise in the development of observation satellites. With a track record of 35 years in creating advanced-generation satellites, including OptSat and TecSAR, IAI has leveraged its experience to create the DS-SAR satellite. This satellite features a synthetic aperture radar sensor payload, which enables the collection of extensive and high-resolution data regardless of weather conditions, day or night. The launch of DS-SAR reinforces IAI's position in the market and highlights its ability to deliver cutting-edge solutions in the field of satellite technology. (Source: Israel Aerospace Industries (IAI), Press Release, July 2023)
- BAE Systems' research and development organization, FAST Labs, was granted a US$ 14 million contract by the Defense Advanced Research Projects Agency (DARPA) for the MAX program. This partnership aims to develop cutting-edge technology that facilitates the implementation of advanced signal processing and computation on smaller military platforms. The project aligns with BAE Systems' commitment to innovation and its focus on providing state-of-the-art solutions for the defense industry. Through this collaboration, BAE Systems aims to enhance military capabilities by enabling the deployment of advanced technologies on smaller military platforms, ultimately contributing to the company's growth and success in the defense sector. (Source: BAE Systems, Press Release, August 2020)
Synthetic Aperture Radar Market Report Coverage and Deliverables
The “Synthetic Aperture Radar Market Size and Forecast (2020–2030)” report provides a detailed analysis of the market covering below areas:
- Synthetic aperture radar market size and forecast at global, regional, and country levels for all the key market segments covered under the scope
- Synthetic aperture radar market trends, as well as market dynamics such as drivers, restraints, and key opportunities
- Detailed PEST/Porter’s Five Forces and SWOT analysis
- Synthetic aperture radar market analysis covering key market trends, global and regional framework, major players, regulations, and recent market developments
- Industry landscape and competition analysis covering market concentration, heat map analysis, prominent players, and recent developments for the synthetic aperture radar market
- Detailed company profiles

Report Coverage
Revenue forecast, Company Analysis, Industry landscape, Growth factors, and Trends

Segment Covered
Component, Frequency Band, Application, Platform, Mode, and Geography

Regional Scope
North America, Europe, Asia Pacific, Middle East & Africa, South & Central America

Country Scope
This text is related
to country scope.
Frequently Asked Questions
North America is expected to dominate the synthetic aperture radar market with the highest market share in 2022.
The synthetic aperture radar market size is projected to reach US$ 12.32 billion by 2030.
The leading players operating in the synthetic aperture radar market are Northrop Grumman Corp, ASELSAN AS, BAE Systems Plc, Israel Aerospace Industries Ltd, Leonardo SpA, Lockheed Martin Corp, Raytheon Technologies Corp, Thales SA, General Atomics Aeronautical Systems Inc, and Saab AB.
The global synthetic aperture radar market is expected to grow at a CAGR of 11.2% during the forecast period 2023 - 2030.
The major factors driving the synthetic aperture radar market are increasing preference for ensuring precision targeting capability, rising preference for integrated C4ISR ecosystem and growing demand for earth observation and remote sensing capabilities.
Integration with deep learning is anticipated to play a significant role in the global synthetic aperture radar market in the coming years.
1. Introduction
1.1 The Insight Partners Research Report Guidance
1.2 Market Segmentation
2. Executive Summary
2.1 Key Insights
2.2 Market Attractiveness
3. Research Methodology
3.1 Coverage
3.2 Secondary Research
3.3 Primary Research
4. Synthetic Aperture Radar Market Landscape
4.1 Overview
4.2 PEST Analysis
4.3 Ecosystem Analysis
4.3.1 List of Vendors in the Value Chain
5. Synthetic Aperture Radar Market – Key Market Dynamics
5.1 Synthetic Aperture Radar Market – Key Market Dynamics
5.2 Market Drivers
5.2.1 Increasing preference for ensuring precision targeting capability
5.2.2 Rising Preference for Integrated C4ISR Ecosystem
5.2.3 Growing Demand for Earth Observation and Remote Sensing Capabilities
5.3 Market Restraints
5.3.1 Satellite Launch Delays
5.3.2 High Development Cost
5.4 Market Opportunities
5.4.1 Rising Development of Dual-Band SAR
5.4.2 Increasing Use of SAR in Agriculture Industry
5.5 Future Trends
5.5.1 Integration with Deep Learning (DL)
5.6 Impact of Drivers and Restraints:
6. Synthetic Aperture Radar Market – Global Market Analysis
6.1 Synthetic Aperture Radar Market Revenue (US$ Million), 2022–2030
6.2 Synthetic Aperture Radar Market Forecast Analysis
7. Synthetic Aperture Radar Market Analysis – by Component
7.1 Receiver
7.1.1 Overview
7.1.2 Receiver: Synthetic Aperture Radar Market – Revenue and Forecast to 2030 (US$ Million)
7.2 Transmitter
7.2.1 Overview
7.2.2 Transmitter: Synthetic Aperture Radar Market – Revenue and Forecast to 2030 (US$ Million)
7.3 Antenna
7.3.1 Overview
7.3.2 Antenna: Synthetic Aperture Radar Market – Revenue and Forecast to 2030 (US$ Million)
8. Synthetic Aperture Radar Market Analysis – by Frequency Band
8.1 X Band
8.1.1 Overview
8.1.2 X Band: Synthetic Aperture Radar Market – Revenue and Forecast to 2030 (US$ Million)
8.2 L Band
8.2.1 Overview
8.2.2 L Band: Synthetic Aperture Radar Market – Revenue and Forecast to 2030 (US$ Million)
8.3 C Band
8.3.1 Overview
8.3.2 C Band: Synthetic Aperture Radar Market – Revenue and Forecast to 2030 (US$ Million)
8.4 S Band
8.4.1 Overview
8.4.2 S Band: Synthetic Aperture Radar Market – Revenue and Forecast to 2030 (US$ Million)
8.5 Others
8.5.1 Overview
8.5.2 Others: Synthetic Aperture Radar Market – Revenue and Forecast to 2030 (US$ Million)
9. Synthetic Aperture Radar Market Analysis – by Application
9.1 Commercial
9.1.1 Overview
9.1.2 Commercial: Synthetic Aperture Radar Market – Revenue and Forecast to 2030 (US$ Million)
9.2 Defense
9.2.1 Overview
9.2.2 Defense: Synthetic Aperture Radar Market – Revenue and Forecast to 2030 (US$ Million)
10. Synthetic Aperture Radar Market Analysis – by Platform
10.1 Ground
10.1.1 Overview
10.1.2 Ground: Synthetic Aperture Radar Market – Revenue and Forecast to 2030 (US$ Million)
10.2 Airborne
10.2.1 Overview
10.2.2 Airborne: Synthetic Aperture Radar Market – Revenue and Forecast to 2030 (US$ Million)
11. Synthetic Aperture Radar Market Analysis – by Mode
11.1 Single
11.1.1 Overview
11.1.2 Single: Synthetic Aperture Radar Market – Revenue and Forecast to 2030 (US$ Million)
11.2 Multi
11.2.1 Overview
11.2.2 Multi: Synthetic Aperture Radar Market – Revenue and Forecast to 2030 (US$ Million)
12. Synthetic Aperture Radar Market – Geographical Analysis
12.1 Overview
12.2 North America
12.2.1 North America Synthetic Aperture Radar Market Overview
12.2.2 North America: Synthetic Aperture Radar Market – Revenue and Forecast to 2030 (US$ Million)
12.2.3 North America: Synthetic Aperture Radar Market Breakdown, by Component
12.2.3.1 North America: Synthetic Aperture Radar Market – Revenue and Forecast Analysis – by Component
12.2.4 North America: Synthetic Aperture Radar Market Breakdown, by Frequency Band
12.2.4.1 North America: Synthetic Aperture Radar Market – Revenue and Forecast Analysis – by Frequency Band
12.2.5 North America: Synthetic Aperture Radar Market Breakdown, by Application
12.2.5.1 North America: Synthetic Aperture Radar Market – Revenue and Forecast Analysis – by Application
12.2.6 North America: Synthetic Aperture Radar Market Breakdown, by Platform
12.2.6.1 North America: Synthetic Aperture Radar Market – Revenue and Forecast Analysis – by Platform
12.2.7 North America: Synthetic Aperture Radar Market Breakdown, by Mode
12.2.7.1 North America: Synthetic Aperture Radar Market – Revenue and Forecast Analysis – by Mode
12.2.8 North America: Synthetic Aperture Radar Market – Revenue and Forecast Analysis – by Country
12.2.8.1 North America: Synthetic Aperture Radar Market – Revenue and Forecast Analysis – by Country
12.2.8.2 United States: Synthetic Aperture Radar Market – Revenue and Forecast to 2030 (US$ Million)
12.2.8.2.1 United States: Synthetic Aperture Radar Market Breakdown, by Component
12.2.8.2.2 United States: Synthetic Aperture Radar Market Breakdown, by Frequency Band
12.2.8.2.3 United States: Synthetic Aperture Radar Market Breakdown, by Application
12.2.8.2.4 United States: Synthetic Aperture Radar Market Breakdown, by Platform
12.2.8.2.5 United States: Synthetic Aperture Radar Market Breakdown, by Mode
12.2.8.3 Canada: Synthetic Aperture Radar Market – Revenue and Forecast to 2030 (US$ Million)
12.2.8.3.1 Canada: Synthetic Aperture Radar Market Breakdown, by Component
12.2.8.3.2 Canada: Synthetic Aperture Radar Market Breakdown, by Frequency Band
12.2.8.3.3 Canada: Synthetic Aperture Radar Market Breakdown, by Application
12.2.8.3.4 Canada: Synthetic Aperture Radar Market Breakdown, by Platform
12.2.8.3.5 Canada: Synthetic Aperture Radar Market Breakdown, by Mode
12.2.8.4 Mexico: Synthetic Aperture Radar Market – Revenue and Forecast to 2030 (US$ Million)
12.2.8.4.1 Mexico: Synthetic Aperture Radar Market Breakdown, by Component
12.2.8.4.2 Mexico: Synthetic Aperture Radar Market Breakdown, by Frequency Band
12.2.8.4.3 Mexico: Synthetic Aperture Radar Market Breakdown, by Application
12.2.8.4.4 Mexico: Synthetic Aperture Radar Market Breakdown, by Platform
12.2.8.4.5 Mexico: Synthetic Aperture Radar Market Breakdown, by Mode
12.3 Europe
12.3.1 Europe Synthetic Aperture Radar Market Overview
12.3.2 Europe: Synthetic Aperture Radar Market – Revenue and Forecast to 2030 (US$ Million)
12.3.3 Europe: Synthetic Aperture Radar Market Breakdown, by Component
12.3.3.1 Europe: Synthetic Aperture Radar Market – Revenue and Forecast Analysis – by Component
12.3.4 Europe: Synthetic Aperture Radar Market Breakdown, by Frequency Band
12.3.4.1 Europe: Synthetic Aperture Radar Market – Revenue and Forecast Analysis – by Frequency Band
12.3.5 Europe: Synthetic Aperture Radar Market Breakdown, by Application
12.3.5.1 Europe: Synthetic Aperture Radar Market – Revenue and Forecast Analysis – by Application
12.3.6 Europe: Synthetic Aperture Radar Market Breakdown, by Platform
12.3.6.1 Europe: Synthetic Aperture Radar Market – Revenue and Forecast Analysis – by Platform
12.3.7 Europe: Synthetic Aperture Radar Market Breakdown, by Mode
12.3.7.1 Europe: Synthetic Aperture Radar Market – Revenue and Forecast Analysis – by Mode
12.3.8 Europe: Synthetic Aperture Radar Market – Revenue and Forecast Analysis – by Country
12.3.8.1 Europe: Synthetic Aperture Radar Market – Revenue and Forecast Analysis – by Country
12.3.8.2 Germany: Synthetic Aperture Radar Market – Revenue and Forecast to 2030 (US$ Million)
12.3.8.2.1 Germany: Synthetic Aperture Radar Market Breakdown, by Component
12.3.8.2.2 Germany: Synthetic Aperture Radar Market Breakdown, by Frequency Band
12.3.8.2.3 Germany: Synthetic Aperture Radar Market Breakdown, by Application
12.3.8.2.4 Germany: Synthetic Aperture Radar Market Breakdown, by Platform
12.3.8.2.5 Germany: Synthetic Aperture Radar Market Breakdown, by Mode
12.3.8.3 United Kingdom: Synthetic Aperture Radar Market – Revenue and Forecast to 2030 (US$ Million)
12.3.8.3.1 United Kingdom: Synthetic Aperture Radar Market Breakdown, by Component
12.3.8.3.2 United Kingdom: Synthetic Aperture Radar Market Breakdown, by Frequency Band
12.3.8.3.3 nited Kingdom: Synthetic Aperture Radar Market Breakdown, by Application
12.3.8.3.4 United Kingdom: Synthetic Aperture Radar Market Breakdown, by Platform
12.3.8.3.5 United Kingdom: Synthetic Aperture Radar Market Breakdown, by Mode
12.3.8.4 France: Synthetic Aperture Radar Market – Revenue and Forecast to 2030 (US$ Million)
12.3.8.4.1 France: Synthetic Aperture Radar Market Breakdown, by Component
12.3.8.4.2 France: Synthetic Aperture Radar Market Breakdown, by Frequency Band
12.3.8.4.3 France: Synthetic Aperture Radar Market Breakdown, by Application
12.3.8.4.4 France: Synthetic Aperture Radar Market Breakdown, by Platform
12.3.8.4.5 France: Synthetic Aperture Radar Market Breakdown, by Mode
12.3.8.5 Italy: Synthetic Aperture Radar Market – Revenue and Forecast to 2030 (US$ Million)
12.3.8.5.1 Italy: Synthetic Aperture Radar Market Breakdown, by Component
12.3.8.5.2 Italy: Synthetic Aperture Radar Market Breakdown, by Frequency Band
12.3.8.5.3 Italy: Synthetic Aperture Radar Market Breakdown, by Application
12.3.8.5.4 Italy: Synthetic Aperture Radar Market Breakdown, by Platform
12.3.8.5.5 Italy: Synthetic Aperture Radar Market Breakdown, by Mode
12.3.8.6 Russian Federation: Synthetic Aperture Radar Market – Revenue and Forecast to 2030 (US$ Million)
12.3.8.6.1 Russian Federation: Synthetic Aperture Radar Market Breakdown, by Component
12.3.8.6.2 Russian Federation: Synthetic Aperture Radar Market Breakdown, by Frequency Band
12.3.8.6.3 Russian Federation: Synthetic Aperture Radar Market Breakdown, by Application
12.3.8.6.4 Russian Federation: Synthetic Aperture Radar Market Breakdown, by Platform
12.3.8.6.5 Russian Federation: Synthetic Aperture Radar Market Breakdown, by Mode
12.3.8.7 Rest of Europe: Synthetic Aperture Radar Market – Revenue and Forecast to 2030 (US$ Million)
12.3.8.7.1 Rest of Europe: Synthetic Aperture Radar Market Breakdown, by Component
12.3.8.7.2 Rest of Europe: Synthetic Aperture Radar Market Breakdown, by Frequency Band
12.3.8.7.3 Rest of Europe: Synthetic Aperture Radar Market Breakdown, by Application
12.3.8.7.4 Rest of Europe: Synthetic Aperture Radar Market Breakdown, by Platform
12.3.8.7.5 Rest of Europe: Synthetic Aperture Radar Market Breakdown, by Mode
12.4 Asia Pacific
12.4.1 Asia Pacific Synthetic Aperture Radar Market Overview
12.4.2 Asia Pacific: Synthetic Aperture Radar Market – Revenue and Forecast to 2030 (US$ Million)
12.4.3 Asia Pacific: Synthetic Aperture Radar Market Breakdown, by Component
12.4.3.1 Asia Pacific: Synthetic Aperture Radar Market – Revenue and Forecast Analysis – by Component
12.4.4 Asia Pacific: Synthetic Aperture Radar Market Breakdown, by Frequency Band
12.4.4.1 Asia Pacific: Synthetic Aperture Radar Market – Revenue and Forecast Analysis – by Frequency Band
12.4.5 Asia Pacific: Synthetic Aperture Radar Market Breakdown, by Application
12.4.5.1 Asia Pacific: Synthetic Aperture Radar Market – Revenue and Forecast Analysis – by Application
12.4.6 Asia Pacific: Synthetic Aperture Radar Market Breakdown, by Platform
12.4.6.1 Asia Pacific: Synthetic Aperture Radar Market – Revenue and Forecast Analysis – by Platform
12.4.7 Asia Pacific: Synthetic Aperture Radar Market Breakdown, by Mode
12.4.7.1 Asia Pacific: Synthetic Aperture Radar Market – Revenue and Forecast Analysis – by Mode
12.4.8 Asia Pacific: Synthetic Aperture Radar Market – Revenue and Forecast Analysis – by Country
12.4.8.1 Asia Pacific: Synthetic Aperture Radar Market – Revenue and Forecast Analysis – by Country
12.4.8.2 Australia: Synthetic Aperture Radar Market – Revenue and Forecast to 2030 (US$ Million)
12.4.8.2.1 Australia: Synthetic Aperture Radar Market Breakdown, by Component
12.4.8.2.2 Australia: Synthetic Aperture Radar Market Breakdown, by Frequency Band
12.4.8.2.3 Australia: Synthetic Aperture Radar Market Breakdown, by Application
12.4.8.2.4 Australia: Synthetic Aperture Radar Market Breakdown, by Platform
12.4.8.2.5 Australia: Synthetic Aperture Radar Market Breakdown, by Mode
12.4.8.3 Japan: Synthetic Aperture Radar Market – Revenue and Forecast to 2030 (US$ Million)
12.4.8.3.1 Japan: Synthetic Aperture Radar Market Breakdown, by Component
12.4.8.3.2 Japan: Synthetic Aperture Radar Market Breakdown, by Frequency Band
12.4.8.3.3 Japan: Synthetic Aperture Radar Market Breakdown, by Application
12.4.8.3.4 Japan: Synthetic Aperture Radar Market Breakdown, by Platform
12.4.8.3.5 Japan: Synthetic Aperture Radar Market Breakdown, by Mode
12.4.8.4 India: Synthetic Aperture Radar Market – Revenue and Forecast to 2030 (US$ Million)
12.4.8.4.1 India: Synthetic Aperture Radar Market Breakdown, by Component
12.4.8.4.2 India: Synthetic Aperture Radar Market Breakdown, by Frequency Band
12.4.8.4.3 India: Synthetic Aperture Radar Market Breakdown, by Application
12.4.8.4.4 India: Synthetic Aperture Radar Market Breakdown, by Platform
12.4.8.4.5 India: Synthetic Aperture Radar Market Breakdown, by Mode
12.4.8.5 China: Synthetic Aperture Radar Market – Revenue and Forecast to 2030 (US$ Million)
12.4.8.5.1 China: Synthetic Aperture Radar Market Breakdown, by Component
12.4.8.5.2 China: Synthetic Aperture Radar Market Breakdown, by Frequency Band
12.4.8.5.3 China: Synthetic Aperture Radar Market Breakdown, by Application
12.4.8.5.4 China: Synthetic Aperture Radar Market Breakdown, by Platform
12.4.8.5.5 China: Synthetic Aperture Radar Market Breakdown, by Mode
12.4.8.6 South Korea: Synthetic Aperture Radar Market – Revenue and Forecast to 2030 (US$ Million)
12.4.8.6.1 South Korea: Synthetic Aperture Radar Market Breakdown, by Component
12.4.8.6.2 South Korea: Synthetic Aperture Radar Market Breakdown, by Frequency Band
12.4.8.6.3 South Korea: Synthetic Aperture Radar Market Breakdown, by Application
12.4.8.6.4 South Korea: Synthetic Aperture Radar Market Breakdown, by Platform
12.4.8.6.5 South Korea: Synthetic Aperture Radar Market Breakdown, by Mode
12.4.8.7 Rest of APAC: Synthetic Aperture Radar Market – Revenue and Forecast to 2030 (US$ Million)
12.4.8.7.1 Rest of APAC: Synthetic Aperture Radar Market Breakdown, by Component
12.4.8.7.2 Rest of APAC: Synthetic Aperture Radar Market Breakdown, by Frequency Band
12.4.8.7.3 Rest of APAC: Synthetic Aperture Radar Market Breakdown, by Application
12.4.8.7.4 Rest of APAC: Synthetic Aperture Radar Market Breakdown, by Platform
12.4.8.7.5 Rest of APAC: Synthetic Aperture Radar Market Breakdown, by Mode
12.5 Middle East and Africa
12.5.1 Middle East and Africa Synthetic Aperture Radar Market Overview
12.5.2 Middle East and Africa: Synthetic Aperture Radar Market – Revenue and Forecast to 2030 (US$ Million)
12.5.3 Middle East and Africa: Synthetic Aperture Radar Market Breakdown, by Component
12.5.3.1 Middle East and Africa: Synthetic Aperture Radar Market – Revenue and Forecast Analysis – by Component
12.5.4 Middle East and Africa: Synthetic Aperture Radar Market Breakdown, by Frequency Band
12.5.4.1 Middle East and Africa: Synthetic Aperture Radar Market – Revenue and Forecast Analysis – by Frequency Band
12.5.5 Middle East and Africa: Synthetic Aperture Radar Market Breakdown, by Application
12.5.5.1 Middle East and Africa: Synthetic Aperture Radar Market – Revenue and Forecast Analysis – by Application
12.5.6 Middle East and Africa: Synthetic Aperture Radar Market Breakdown, by Platform
12.5.6.1 Middle East and Africa: Synthetic Aperture Radar Market – Revenue and Forecast Analysis – by Platform
12.5.7 Middle East and Africa: Synthetic Aperture Radar Market Breakdown, by Mode
12.5.7.1 Middle East and Africa: Synthetic Aperture Radar Market – Revenue and Forecast Analysis – by Mode
12.5.8 Middle East and Africa: Synthetic Aperture Radar Market – Revenue and Forecast Analysis – by Country
12.5.8.1 Middle East and Africa: Synthetic Aperture Radar Market – Revenue and Forecast Analysis – by Country
12.5.8.2 South Africa: Synthetic Aperture Radar Market – Revenue and Forecast to 2030 (US$ Million)
12.5.8.2.1 South Africa: Synthetic Aperture Radar Market Breakdown, by Component
12.5.8.2.2 South Africa: Synthetic Aperture Radar Market Breakdown, by Frequency Band
12.5.8.2.3 South Africa: Synthetic Aperture Radar Market Breakdown, by Application
12.5.8.2.4 South Africa: Synthetic Aperture Radar Market Breakdown, by Platform
12.5.8.2.5 South Africa: Synthetic Aperture Radar Market Breakdown, by Mode
12.5.8.3 Saudi Arabia: Synthetic Aperture Radar Market – Revenue and Forecast to 2030 (US$ Million)
12.5.8.3.1 Saudi Arabia: Synthetic Aperture Radar Market Breakdown, by Component
12.5.8.3.2 Saudi Arabia: Synthetic Aperture Radar Market Breakdown, by Frequency Band
12.5.8.3.3 Saudi Arabia: Synthetic Aperture Radar Market Breakdown, by Application
12.5.8.3.4 Saudi Arabia: Synthetic Aperture Radar Market Breakdown, by Platform
12.5.8.3.5 Saudi Arabia: Synthetic Aperture Radar Market Breakdown, by Mode
12.5.8.4 United Arab Emirates: Synthetic Aperture Radar Market – Revenue and Forecast to 2030 (US$ Million)
12.5.8.4.1 United Arab Emirates: Synthetic Aperture Radar Market Breakdown, by Component
12.5.8.4.2 United Arab Emirates: Synthetic Aperture Radar Market Breakdown, by Frequency Band
12.5.8.4.3 United Arab Emirates: Synthetic Aperture Radar Market Breakdown, by Application
12.5.8.4.4 United Arab Emirates: Synthetic Aperture Radar Market Breakdown, by Platform
12.5.8.4.5 United Arab Emirates: Synthetic Aperture Radar Market Breakdown, by Mode
12.5.8.5 Rest of Middle East and Africa: Synthetic Aperture Radar Market – Revenue and Forecast to 2030 (US$ Million)
12.5.8.5.1 Rest of Middle East and Africa: Synthetic Aperture Radar Market Breakdown, by Component
12.5.8.5.2 Rest of Middle East and Africa: Synthetic Aperture Radar Market Breakdown, by Frequency Band
12.5.8.5.3 Rest of Middle East and Africa: Synthetic Aperture Radar Market Breakdown, by Application
12.5.8.5.4 Rest of Middle East and Africa: Synthetic Aperture Radar Market Breakdown, by Platform
12.5.8.5.5 Rest of Middle East and Africa: Synthetic Aperture Radar Market Breakdown, by Mode
12.6 South and Central America
12.6.1 South and Central America Synthetic Aperture Radar Market Overview
12.6.2 South and Central America: Synthetic Aperture Radar Market – Revenue and Forecast to 2030 (US$ Million)
12.6.3 South and Central America: Synthetic Aperture Radar Market Breakdown, by Component
12.6.3.1 South and Central America: Synthetic Aperture Radar Market – Revenue and Forecast Analysis – by Component
12.6.4 South and Central America: Synthetic Aperture Radar Market Breakdown, by Frequency Band
12.6.4.1 South and Central America: Synthetic Aperture Radar Market – Revenue and Forecast Analysis – by Frequency Band
12.6.5 South and Central America: Synthetic Aperture Radar Market Breakdown, by Application
12.6.5.1 South and Central America: Synthetic Aperture Radar Market – Revenue and Forecast Analysis – by Application
12.6.6 South and Central America: Synthetic Aperture Radar Market Breakdown, by Platform
12.6.6.1 South and Central America: Synthetic Aperture Radar Market – Revenue and Forecast Analysis – by Platform
12.6.7 South and Central America: Synthetic Aperture Radar Market Breakdown, by Mode
12.6.7.1 South and Central America: Synthetic Aperture Radar Market – Revenue and Forecast Analysis – by Mode
12.6.8 South and Central America: Synthetic Aperture Radar Market – Revenue and Forecast Analysis – by Country
12.6.8.1 South and Central America: Synthetic Aperture Radar Market – Revenue and Forecast Analysis – by Country
12.6.8.2 Brazil: Synthetic Aperture Radar Market – Revenue and Forecast to 2030 (US$ Million)
12.6.8.2.1 Brazil: Synthetic Aperture Radar Market Breakdown, by Component
12.6.8.2.2 Brazil: Synthetic Aperture Radar Market Breakdown, by Frequency Band
12.6.8.2.3 Brazil: Synthetic Aperture Radar Market Breakdown, by Application
12.6.8.2.4 Brazil: Synthetic Aperture Radar Market Breakdown, by Platform
12.6.8.2.5 Brazil: Synthetic Aperture Radar Market Breakdown, by Mode
12.6.8.3 Argentina: Synthetic Aperture Radar Market – Revenue and Forecast to 2030 (US$ Million)
12.6.8.3.1 Argentina: Synthetic Aperture Radar Market Breakdown, by Component
12.6.8.3.2 Argentina: Synthetic Aperture Radar Market Breakdown, by Frequency Band
12.6.8.3.3 Argentina: Synthetic Aperture Radar Market Breakdown, by Application
12.6.8.3.4 Argentina: Synthetic Aperture Radar Market Breakdown, by Platform
12.6.8.3.5 Argentina: Synthetic Aperture Radar Market Breakdown, by Mode
12.6.8.4 Rest of South and Central America: Synthetic Aperture Radar Market – Revenue and Forecast to 2030 (US$ Million)
12.6.8.4.1 Rest of South and Central America: Synthetic Aperture Radar Market Breakdown, by Component
12.6.8.4.2 Rest of South and Central America: Synthetic Aperture Radar Market Breakdown, by Frequency Band
12.6.8.4.3 Rest of South and Central America: Synthetic Aperture Radar Market Breakdown, by Application
12.6.8.4.4 Rest of South and Central America: Synthetic Aperture Radar Market Breakdown, by Platform
12.6.8.4.5 Rest of South and Central America: Synthetic Aperture Radar Market Breakdown, by Mode
13. Synthetic Aperture Radar Market – Impact of COVID-19 Pandemic
13.1 Pre & Post COVID-19 Impact
14. Competitive Landscape
14.1 Heat Map Analysis By Key Players
14.2 Company Positioning & Concentration
15. Industry Landscape
15.1 Overview
15.2 Market Initiative
15.3 Product Development
15.4 Partnership & Collaboration
15.5 Expansion
15.6 Others
16. Company Profiles
16.1 Northrop Grumman Corp
16.1.1 Key Facts
16.1.2 Business Description
16.1.3 Products and Services
16.1.4 Financial Overview
16.1.5 SWOT Analysis
16.1.6 Key Developments
16.2 ASELSAN AS
16.2.1 Key Facts
16.2.2 Business Description
16.2.3 Products and Services
16.2.4 Financial Overview
16.2.5 SWOT Analysis
16.2.6 Key Developments
16.3 BAE Systems Plc
16.3.1 Key Facts
16.3.2 Business Description
16.3.3 Products and Services
16.3.4 Financial Overview
16.3.5 SWOT Analysis
16.3.6 Key Developments
16.4 Israel Aerospace Industries Ltd
16.4.1 Key Facts
16.4.2 Business Description
16.4.3 Products and Services
16.4.4 Financial Overview
16.4.5 SWOT Analysis
16.4.6 Key Developments
16.5 Leonardo SpA
16.5.1 Key Facts
16.5.2 Business Description
16.5.3 Products and Services
16.5.4 Financial Overview
16.5.5 SWOT Analysis
16.5.6 Key Developments
16.6 Lockheed Martin Corp
16.6.1 Key Facts
16.6.2 Business Description
16.6.3 Products and Services
16.6.4 Financial Overview
16.6.5 SWOT Analysis
16.6.6 Key Developments
16.7 Raytheon Technologies Corp
16.7.1 Key Facts
16.7.2 Business Description
16.7.3 Products and Services
16.7.4 Financial Overview
16.7.5 SWOT Analysis
16.7.6 Key Developments
16.8 Thales SA
16.8.1 Key Facts
16.8.2 Business Description
16.8.3 Products and Services
16.8.4 Financial Overview
16.8.5 SWOT Analysis
16.8.6 Key Developments
16.9 General Atomics Aeronautical Systems Inc
16.9.1 Key Facts
16.9.2 Business Description
16.9.3 Products and Services
16.9.4 Financial Overview
16.9.5 SWOT Analysis
16.9.6 Key Developments
16.10 Saab AB
16.10.1 Key Facts
16.10.2 Business Description
16.10.3 Products and Services
16.10.4 Financial Overview
16.10.5 SWOT Analysis
16.10.6 Key Developments
17. Appendix
17.1 About The Insight Partners
17.2 Word Index
List of Tables
Table 1. Synthetic Aperture Radar Market Segmentation
Table 2. List of Vendors
Table 3. Synthetic Aperture Radar Market – Revenue and Forecast to 2030 (US$ Million)
Table 4. Synthetic Aperture Radar Market – Revenue and Forecast to 2030 (US$ Million) – by Component
Table 5. Synthetic Aperture Radar Market – Revenue and Forecast to 2030 (US$ Million) – by Frequency Band
Table 6. Synthetic Aperture Radar Market – Revenue and Forecast to 2030 (US$ Million) – by Application
Table 7. Synthetic Aperture Radar Market – Revenue and Forecast to 2030 (US$ Million) – by Platform
Table 8. Synthetic Aperture Radar Market – Revenue and Forecast to 2030 (US$ Million) – by Mode
Table 9. North America: Synthetic Aperture Radar Market – Revenue and Forecast to 2030(US$ Million) – by Component
Table 10. North America: Synthetic Aperture Radar Market – Revenue and Forecast to 2030(US$ Million) – by Frequency Band
Table 11. North America: Synthetic Aperture Radar Market – Revenue and Forecast to 2030(US$ Million) – by Application
Table 12. North America: Synthetic Aperture Radar Market – Revenue and Forecast to 2030(US$ Million) – by Platform
Table 13. North America: Synthetic Aperture Radar Market – Revenue and Forecast to 2030(US$ Million) – by Mode
Table 14. North America: Synthetic Aperture Radar Market – Revenue and Forecast to 2030(US$ Million) – by Country
Table 15. United States: Synthetic Aperture Radar Market – Revenue and Forecast to 2030(US$ Million) – by Component
Table 16. United States: Synthetic Aperture Radar Market – Revenue and Forecast to 2030(US$ Million) – by Frequency Band
Table 17. United States: Synthetic Aperture Radar Market – Revenue and Forecast to 2030(US$ Million) – by Application
Table 18. United States: Synthetic Aperture Radar Market – Revenue and Forecast to 2030(US$ Million) – by Platform
Table 19. United States: Synthetic Aperture Radar Market – Revenue and Forecast to 2030(US$ Million) – by Mode
Table 20. Canada: Synthetic Aperture Radar Market – Revenue and Forecast to 2030(US$ Million) – by Component
Table 21. Canada: Synthetic Aperture Radar Market – Revenue and Forecast to 2030(US$ Million) – by Frequency Band
Table 22. Canada: Synthetic Aperture Radar Market – Revenue and Forecast to 2030(US$ Million) – by Application
Table 23. Canada: Synthetic Aperture Radar Market – Revenue and Forecast to 2030(US$ Million) – by Platform
Table 24. Canada: Synthetic Aperture Radar Market – Revenue and Forecast to 2030(US$ Million) – by Mode
Table 25. Mexico: Synthetic Aperture Radar Market – Revenue and Forecast to 2030(US$ Million) – by Component
Table 26. Mexico: Synthetic Aperture Radar Market – Revenue and Forecast to 2030(US$ Million) – by Frequency Band
Table 27. Mexico: Synthetic Aperture Radar Market – Revenue and Forecast to 2030(US$ Million) – by Application
Table 28. Mexico: Synthetic Aperture Radar Market – Revenue and Forecast to 2030(US$ Million) – by Platform
Table 29. Mexico: Synthetic Aperture Radar Market – Revenue and Forecast to 2030(US$ Million) – by Mode
Table 30. Europe: Synthetic Aperture Radar Market – Revenue and Forecast to 2030(US$ Million) – by Component
Table 31. Europe: Synthetic Aperture Radar Market – Revenue and Forecast to 2030(US$ Million) – by Frequency Band
Table 32. Europe: Synthetic Aperture Radar Market – Revenue and Forecast to 2030(US$ Million) – by Application
Table 33. Europe: Synthetic Aperture Radar Market – Revenue and Forecast to 2030(US$ Million) – by Platform
Table 34. Europe: Synthetic Aperture Radar Market – Revenue and Forecast to 2030(US$ Million) – by Mode
Table 35. Europe: Synthetic Aperture Radar Market – Revenue and Forecast to 2030(US$ Million) – by Country
Table 36. Germany: Synthetic Aperture Radar Market – Revenue and Forecast to 2030(US$ Million) – by Component
Table 37. Germany: Synthetic Aperture Radar Market – Revenue and Forecast to 2030(US$ Million) – by Frequency Band
Table 38. Germany: Synthetic Aperture Radar Market – Revenue and Forecast to 2030(US$ Million) – by Application
Table 39. Germany: Synthetic Aperture Radar Market – Revenue and Forecast to 2030(US$ Million) – by Platform
Table 40. Germany: Synthetic Aperture Radar Market – Revenue and Forecast to 2030(US$ Million) – by Mode
Table 41. United Kingdom: Synthetic Aperture Radar Market – Revenue and Forecast to 2030(US$ Million) – by Component
Table 42. United Kingdom: Synthetic Aperture Radar Market – Revenue and Forecast to 2030(US$ Million) – by Frequency Band
Table 43. United Kingdom: Synthetic Aperture Radar Market – Revenue and Forecast to 2030(US$ Million) – by Application
Table 44. United Kingdom: Synthetic Aperture Radar Market – Revenue and Forecast to 2030(US$ Million) – by Platform
Table 45. United Kingdom: Synthetic Aperture Radar Market – Revenue and Forecast to 2030(US$ Million) – by Mode
Table 46. France: Synthetic Aperture Radar Market – Revenue and Forecast to 2030(US$ Million) – by Component
Table 47. France: Synthetic Aperture Radar Market – Revenue and Forecast to 2030(US$ Million) – by Frequency Band
Table 48. France: Synthetic Aperture Radar Market – Revenue and Forecast to 2030(US$ Million) – by Application
Table 49. France: Synthetic Aperture Radar Market – Revenue and Forecast to 2030(US$ Million) – by Platform
Table 50. France: Synthetic Aperture Radar Market – Revenue and Forecast to 2030(US$ Million) – by Mode
Table 51. Italy: Synthetic Aperture Radar Market – Revenue and Forecast to 2030(US$ Million) – by Component
Table 52. Italy: Synthetic Aperture Radar Market – Revenue and Forecast to 2030(US$ Million) – by Frequency Band
Table 53. Italy: Synthetic Aperture Radar Market – Revenue and Forecast to 2030(US$ Million) – by Application
Table 54. Italy: Synthetic Aperture Radar Market – Revenue and Forecast to 2030(US$ Million) – by Platform
Table 55. Italy: Synthetic Aperture Radar Market – Revenue and Forecast to 2030(US$ Million) – by Mode
Table 56. Russian Federation: Synthetic Aperture Radar Market – Revenue and Forecast to 2030(US$ Million) – by Component
Table 57. Russian Federation: Synthetic Aperture Radar Market – Revenue and Forecast to 2030(US$ Million) – by Frequency Band
Table 58. Russian Federation: Synthetic Aperture Radar Market – Revenue and Forecast to 2030(US$ Million) – by Application
Table 59. Russian Federation: Synthetic Aperture Radar Market – Revenue and Forecast to 2030(US$ Million) – by Platform
Table 60. Russian Federation: Synthetic Aperture Radar Market – Revenue and Forecast to 2030(US$ Million) – by Mode
Table 61. Rest of Europe: Synthetic Aperture Radar Market – Revenue and Forecast to 2030(US$ Million) – by Component
Table 62. Rest of Europe: Synthetic Aperture Radar Market – Revenue and Forecast to 2030(US$ Million) – by Frequency Band
Table 63. Rest of Europe: Synthetic Aperture Radar Market – Revenue and Forecast to 2030(US$ Million) – by Application
Table 64. Rest of Europe: Synthetic Aperture Radar Market – Revenue and Forecast to 2030(US$ Million) – by Platform
Table 65. Rest of Europe: Synthetic Aperture Radar Market – Revenue and Forecast to 2030(US$ Million) – by Mode
Table 66. Asia Pacific: Synthetic Aperture Radar Market – Revenue and Forecast to 2030(US$ Million) – by Component
Table 67. Asia Pacific: Synthetic Aperture Radar Market – Revenue and Forecast to 2030(US$ Million) – by Frequency Band
Table 68. Asia Pacific: Synthetic Aperture Radar Market – Revenue and Forecast to 2030(US$ Million) – by Application
Table 69. Asia Pacific: Synthetic Aperture Radar Market – Revenue and Forecast to 2030(US$ Million) – by Platform
Table 70. Asia Pacific: Synthetic Aperture Radar Market – Revenue and Forecast to 2030(US$ Million) – by Mode
Table 71. Asia Pacific: Synthetic Aperture Radar Market – Revenue and Forecast to 2030(US$ Million) – by Country
Table 72. Australia: Synthetic Aperture Radar Market – Revenue and Forecast to 2030(US$ Million) – by Component
Table 73. Australia: Synthetic Aperture Radar Market – Revenue and Forecast to 2030(US$ Million) – by Frequency Band
Table 74. Australia: Synthetic Aperture Radar Market – Revenue and Forecast to 2030(US$ Million) – by Application
Table 75. Australia: Synthetic Aperture Radar Market – Revenue and Forecast to 2030(US$ Million) – by Platform
Table 76. Australia: Synthetic Aperture Radar Market – Revenue and Forecast to 2030(US$ Million) – by Mode
Table 77. Japan: Synthetic Aperture Radar Market – Revenue and Forecast to 2030(US$ Million) – by Component
Table 78. Japan: Synthetic Aperture Radar Market – Revenue and Forecast to 2030(US$ Million) – by Frequency Band
Table 79. Japan: Synthetic Aperture Radar Market – Revenue and Forecast to 2030(US$ Million) – by Application
Table 80. Japan: Synthetic Aperture Radar Market – Revenue and Forecast to 2030(US$ Million) – by Platform
Table 81. Japan: Synthetic Aperture Radar Market – Revenue and Forecast to 2030(US$ Million) – by Mode
Table 82. India: Synthetic Aperture Radar Market – Revenue and Forecast to 2030(US$ Million) – by Component
Table 83. India: Synthetic Aperture Radar Market – Revenue and Forecast to 2030(US$ Million) – by Frequency Band
Table 84. India: Synthetic Aperture Radar Market – Revenue and Forecast to 2030(US$ Million) – by Application
Table 85. India: Synthetic Aperture Radar Market – Revenue and Forecast to 2030(US$ Million) – by Platform
Table 86. India: Synthetic Aperture Radar Market – Revenue and Forecast to 2030(US$ Million) – by Mode
Table 87. China: Synthetic Aperture Radar Market – Revenue and Forecast to 2030(US$ Million) – by Component
Table 88. China: Synthetic Aperture Radar Market – Revenue and Forecast to 2030(US$ Million) – by Frequency Band
Table 89. China: Synthetic Aperture Radar Market – Revenue and Forecast to 2030(US$ Million) – by Application
Table 90. China: Synthetic Aperture Radar Market – Revenue and Forecast to 2030(US$ Million) – by Platform
Table 91. China: Synthetic Aperture Radar Market – Revenue and Forecast to 2030(US$ Million) – by Mode
Table 92. South Korea: Synthetic Aperture Radar Market – Revenue and Forecast to 2030(US$ Million) – by Component
Table 93. South Korea: Synthetic Aperture Radar Market – Revenue and Forecast to 2030(US$ Million) – by Frequency Band
Table 94. South Korea: Synthetic Aperture Radar Market – Revenue and Forecast to 2030(US$ Million) – by Application
Table 95. South Korea: Synthetic Aperture Radar Market – Revenue and Forecast to 2030(US$ Million) – by Platform
Table 96. South Korea: Synthetic Aperture Radar Market – Revenue and Forecast to 2030(US$ Million) – by Mode
Table 97. Rest of APAC: Synthetic Aperture Radar Market – Revenue and Forecast to 2030(US$ Million) – by Component
Table 98. Rest of APAC: Synthetic Aperture Radar Market – Revenue and Forecast to 2030(US$ Million) – by Frequency Band
Table 99. Rest of APAC: Synthetic Aperture Radar Market – Revenue and Forecast to 2030(US$ Million) – by Application
Table 100. Rest of APAC: Synthetic Aperture Radar Market – Revenue and Forecast to 2030(US$ Million) – by Platform
Table 101. Rest of APAC: Synthetic Aperture Radar Market – Revenue and Forecast to 2030(US$ Million) – by Mode
Table 102. Middle East and Africa: Synthetic Aperture Radar Market – Revenue and Forecast to 2030(US$ Million) – by Component
Table 103. Middle East and Africa: Synthetic Aperture Radar Market – Revenue and Forecast to 2030(US$ Million) – by Frequency Band
Table 104. Middle East and Africa: Synthetic Aperture Radar Market – Revenue and Forecast to 2030(US$ Million) – by Application
Table 105. Middle East and Africa: Synthetic Aperture Radar Market – Revenue and Forecast to 2030(US$ Million) – by Platform
Table 106. Middle East and Africa: Synthetic Aperture Radar Market – Revenue and Forecast to 2030(US$ Million) – by Mode
Table 107. Middle East and Africa: Synthetic Aperture Radar Market – Revenue and Forecast to 2030(US$ Million) – by Country
Table 108. South Africa: Synthetic Aperture Radar Market – Revenue and Forecast to 2030(US$ Million) – by Component
Table 109. South Africa: Synthetic Aperture Radar Market – Revenue and Forecast to 2030(US$ Million) – by Frequency Band
Table 110. South Africa: Synthetic Aperture Radar Market – Revenue and Forecast to 2030(US$ Million) – by Application
Table 111. South Africa: Synthetic Aperture Radar Market – Revenue and Forecast to 2030(US$ Million) – by Platform
Table 112. South Africa: Synthetic Aperture Radar Market – Revenue and Forecast to 2030(US$ Million) – by Mode
Table 113. Saudi Arabia: Synthetic Aperture Radar Market – Revenue and Forecast to 2030(US$ Million) – by Component
Table 114. Saudi Arabia: Synthetic Aperture Radar Market – Revenue and Forecast to 2030(US$ Million) – by Frequency Band
Table 115. Saudi Arabia: Synthetic Aperture Radar Market – Revenue and Forecast to 2030(US$ Million) – by Application
Table 116. Saudi Arabia: Synthetic Aperture Radar Market – Revenue and Forecast to 2030(US$ Million) – by Platform
Table 117. Saudi Arabia: Synthetic Aperture Radar Market – Revenue and Forecast to 2030(US$ Million) – by Mode
Table 118. United Arab Emirates: Synthetic Aperture Radar Market – Revenue and Forecast to 2030(US$ Million) – by Component
Table 119. United Arab Emirates: Synthetic Aperture Radar Market – Revenue and Forecast to 2030(US$ Million) – by Frequency Band
Table 120. United Arab Emirates: Synthetic Aperture Radar Market – Revenue and Forecast to 2030(US$ Million) – by Application
Table 121. United Arab Emirates: Synthetic Aperture Radar Market – Revenue and Forecast to 2030(US$ Million) – by Platform
Table 122. United Arab Emirates: Synthetic Aperture Radar Market – Revenue and Forecast to 2030(US$ Million) – by Mode
Table 123. Rest of Middle East and Africa: Synthetic Aperture Radar Market – Revenue and Forecast to 2030(US$ Million) – by Component
Table 124. Rest of Middle East and Africa: Synthetic Aperture Radar Market – Revenue and Forecast to 2030(US$ Million) – by Frequency Band
Table 125. Rest of Middle East and Africa: Synthetic Aperture Radar Market – Revenue and Forecast to 2030(US$ Million) – by Application
Table 126. Rest of Middle East and Africa: Synthetic Aperture Radar Market – Revenue and Forecast to 2030(US$ Million) – by Platform
Table 127. Rest of Middle East and Africa: Synthetic Aperture Radar Market – Revenue and Forecast to 2030(US$ Million) – by Mode
Table 128. South and Central America: Synthetic Aperture Radar Market – Revenue and Forecast to 2030(US$ Million) – by Component
Table 129. South and Central America: Synthetic Aperture Radar Market – Revenue and Forecast to 2030(US$ Million) – by Frequency Band
Table 130. South and Central America: Synthetic Aperture Radar Market – Revenue and Forecast to 2030(US$ Million) – by Application
Table 131. South and Central America: Synthetic Aperture Radar Market – Revenue and Forecast to 2030(US$ Million) – by Platform
Table 132. South and Central America: Synthetic Aperture Radar Market – Revenue and Forecast to 2030(US$ Million) – by Mode
Table 133. South and Central America: Synthetic Aperture Radar Market – Revenue and Forecast to 2030(US$ Million) – by Country
Table 134. Brazil: Synthetic Aperture Radar Market – Revenue and Forecast to 2030(US$ Million) – by Component
Table 135. Brazil: Synthetic Aperture Radar Market – Revenue and Forecast to 2030(US$ Million) – by Frequency Band
Table 136. Brazil: Synthetic Aperture Radar Market – Revenue and Forecast to 2030(US$ Million) – by Application
Table 137. Brazil: Synthetic Aperture Radar Market – Revenue and Forecast to 2030(US$ Million) – by Platform
Table 138. Brazil: Synthetic Aperture Radar Market – Revenue and Forecast to 2030(US$ Million) – by Mode
Table 139. Argentina: Synthetic Aperture Radar Market – Revenue and Forecast to 2030(US$ Million) – by Component
Table 140. Argentina: Synthetic Aperture Radar Market – Revenue and Forecast to 2030(US$ Million) – by Frequency Band
Table 141. Argentina: Synthetic Aperture Radar Market – Revenue and Forecast to 2030(US$ Million) – by Application
Table 142. Argentina: Synthetic Aperture Radar Market – Revenue and Forecast to 2030(US$ Million) – by Platform
Table 143. Argentina: Synthetic Aperture Radar Market – Revenue and Forecast to 2030(US$ Million) – by Mode
Table 144. Rest of South and Central America: Synthetic Aperture Radar Market – Revenue and Forecast to 2030(US$ Million) – by Component
Table 145. Rest of South and Central America: Synthetic Aperture Radar Market – Revenue and Forecast to 2030(US$ Million) – by Frequency Band
Table 146. Rest of South and Central America: Synthetic Aperture Radar Market – Revenue and Forecast to 2030(US$ Million) – by Application
Table 147. Rest of South and Central America: Synthetic Aperture Radar Market – Revenue and Forecast to 2030(US$ Million) – by Platform
Table 148. Rest of South and Central America: Synthetic Aperture Radar Market – Revenue and Forecast to 2030(US$ Million) – by Mode
Table 149. Heat Map Analysis By Key Players
Table 150. List of Abbreviation
List of Figures
Figure 1. Synthetic Aperture Radar Market Segmentation, by Geography
Figure 2. PEST Analysis
Figure 3. Ecosystem Analysis
Figure 4. Impact Analysis of Drivers and Restraints
Figure 5. Synthetic Aperture Radar Market Revenue (US$ Million), 2022–2030
Figure 6. Synthetic Aperture Radar Market Share (%) – by Component (2022 and 2030)
Figure 7. Receiver: Synthetic Aperture Radar Market – Revenue and Forecast to 2030 (US$ Million)
Figure 8. Transmitter: Synthetic Aperture Radar Market – Revenue and Forecast to 2030 (US$ Million)
Figure 9. Antenna: Synthetic Aperture Radar Market – Revenue and Forecast to 2030 (US$ Million)
Figure 10. Synthetic Aperture Radar Market Share (%) – by Frequency Band (2022 and 2030)
Figure 11. X Band: Synthetic Aperture Radar Market – Revenue and Forecast to 2030 (US$ Million)
Figure 12. L Band: Synthetic Aperture Radar Market – Revenue and Forecast to 2030 (US$ Million)
Figure 13. C Band: Synthetic Aperture Radar Market – Revenue and Forecast to 2030 (US$ Million)
Figure 14. S Band: Synthetic Aperture Radar Market – Revenue and Forecast to 2030 (US$ Million)
Figure 15. Others: Synthetic Aperture Radar Market – Revenue and Forecast to 2030 (US$ Million)
Figure 16. Synthetic Aperture Radar Market Share (%) – by Application (2022 and 2030)
Figure 17. Commercial: Synthetic Aperture Radar Market – Revenue and Forecast to 2030 (US$ Million)
Figure 18. Defense: Synthetic Aperture Radar Market – Revenue and Forecast to 2030 (US$ Million)
Figure 19. Synthetic Aperture Radar Market Share (%) – by Platform (2022 and 2030)
Figure 20. Ground: Synthetic Aperture Radar Market – Revenue and Forecast to 2030 (US$ Million)
Figure 21. Airborne: Synthetic Aperture Radar Market – Revenue and Forecast to 2030 (US$ Million)
Figure 22. Synthetic Aperture Radar Market Share (%) – by Mode (2022 and 2030)
Figure 23. Single: Synthetic Aperture Radar Market – Revenue and Forecast to 2030 (US$ Million)
Figure 24. Multi: Synthetic Aperture Radar Market – Revenue and Forecast to 2030 (US$ Million)
Figure 25. Synthetic Aperture Radar Market Breakdown by Region, 2022 and 2030 (%)
Figure 26. North America: Synthetic Aperture Radar Market – Revenue and Forecast to 2030(US$ Million)
Figure 27. North America: Synthetic Aperture Radar Market Breakdown, by Component (2022 and 2030)
Figure 28. North America: Synthetic Aperture Radar Market Breakdown, by Frequency Band (2022 and 2030)
Figure 29. North America: Synthetic Aperture Radar Market Breakdown, by Application (2022 and 2030)
Figure 30. North America: Synthetic Aperture Radar Market Breakdown, by Platform (2022 and 2030)
Figure 31. North America: Synthetic Aperture Radar Market Breakdown, by Mode (2022 and 2030)
Figure 32. North America: Synthetic Aperture Radar Market Breakdown, by Key Countries, 2022 and 2030 (%)
Figure 33. United States: Synthetic Aperture Radar Market – Revenue and Forecast to 2030(US$ Million)
Figure 34. Canada: Synthetic Aperture Radar Market – Revenue and Forecast to 2030(US$ Million)
Figure 35. Mexico: Synthetic Aperture Radar Market – Revenue and Forecast to 2030(US$ Million)
Figure 36. Europe: Synthetic Aperture Radar Market – Revenue and Forecast to 2030(US$ Million)
Figure 37. Europe: Synthetic Aperture Radar Market Breakdown, by Component (2022 and 2030)
Figure 38. Europe: Synthetic Aperture Radar Market Breakdown, by Frequency Band (2022 and 2030)
Figure 39. Europe: Synthetic Aperture Radar Market Breakdown, by Application (2022 and 2030)
Figure 40. Europe: Synthetic Aperture Radar Market Breakdown, by Platform (2022 and 2030)
Figure 41. Europe: Synthetic Aperture Radar Market Breakdown, by Mode (2022 and 2030)
Figure 42. Europe: Synthetic Aperture Radar Market Breakdown, by Key Countries, 2022 and 2030 (%)
Figure 43. Germany: Synthetic Aperture Radar Market – Revenue and Forecast to 2030(US$ Million)
Figure 44. United Kingdom: Synthetic Aperture Radar Market – Revenue and Forecast to 2030(US$ Million)
Figure 45. France: Synthetic Aperture Radar Market – Revenue and Forecast to 2030(US$ Million)
Figure 46. Italy: Synthetic Aperture Radar Market – Revenue and Forecast to 2030(US$ Million)
Figure 47. Russian Federation: Synthetic Aperture Radar Market – Revenue and Forecast to 2030(US$ Million)
Figure 48. Rest of Europe: Synthetic Aperture Radar Market – Revenue and Forecast to 2030(US$ Million)
Figure 49. Asia Pacific: Synthetic Aperture Radar Market – Revenue and Forecast to 2030(US$ Million)
Figure 50. Asia Pacific: Synthetic Aperture Radar Market Breakdown, by Component (2022 and 2030)
Figure 51. Asia Pacific: Synthetic Aperture Radar Market Breakdown, by Frequency Band (2022 and 2030)
Figure 52. Asia Pacific: Synthetic Aperture Radar Market Breakdown, by Application (2022 and 2030)
Figure 53. Asia Pacific: Synthetic Aperture Radar Market Breakdown, by Platform (2022 and 2030)
Figure 54. Asia Pacific: Synthetic Aperture Radar Market Breakdown, by Mode (2022 and 2030)
Figure 55. Asia Pacific: Synthetic Aperture Radar Market Breakdown, by Key Countries, 2022 and 2030 (%)
Figure 56. Australia: Synthetic Aperture Radar Market – Revenue and Forecast to 2030(US$ Million)
Figure 57. Japan: Synthetic Aperture Radar Market – Revenue and Forecast to 2030(US$ Million)
Figure 58. India: Synthetic Aperture Radar Market – Revenue and Forecast to 2030(US$ Million)
Figure 59. China: Synthetic Aperture Radar Market – Revenue and Forecast to 2030(US$ Million)
Figure 60. South Korea: Synthetic Aperture Radar Market – Revenue and Forecast to 2030(US$ Million)
Figure 61. Rest of APAC: Synthetic Aperture Radar Market – Revenue and Forecast to 2030(US$ Million)
Figure 62. Middle East and Africa: Synthetic Aperture Radar Market – Revenue and Forecast to 2030(US$ Million)
Figure 63. Middle East and Africa: Synthetic Aperture Radar Market Breakdown, by Component (2022 and 2030)
Figure 64. Middle East and Africa: Synthetic Aperture Radar Market Breakdown, by Frequency Band (2022 and 2030)
Figure 65. Middle East and Africa: Synthetic Aperture Radar Market Breakdown, by Application (2022 and 2030)
Figure 66. Middle East and Africa: Synthetic Aperture Radar Market Breakdown, by Platform (2022 and 2030)
Figure 67. Middle East and Africa: Synthetic Aperture Radar Market Breakdown, by Mode (2022 and 2030)
Figure 68. Middle East and Africa: Synthetic Aperture Radar Market Breakdown, by Key Countries, 2022 and 2030 (%)
Figure 69. South Africa: Synthetic Aperture Radar Market – Revenue and Forecast to 2030(US$ Million)
Figure 70. Saudi Arabia: Synthetic Aperture Radar Market – Revenue and Forecast to 2030(US$ Million)
Figure 71. United Arab Emirates: Synthetic Aperture Radar Market – Revenue and Forecast to 2030(US$ Million)
Figure 72. Rest of Middle East and Africa: Synthetic Aperture Radar Market – Revenue and Forecast to 2030(US$ Million)
Figure 73. South and Central America: Synthetic Aperture Radar Market – Revenue and Forecast to 2030(US$ Million)
Figure 74. South and Central America: Synthetic Aperture Radar Market Breakdown, by Component (2022 and 2030)
Figure 75. South and Central America: Synthetic Aperture Radar Market Breakdown, by Frequency Band (2022 and 2030)
Figure 76. South and Central America: Synthetic Aperture Radar Market Breakdown, by Application (2022 and 2030)
Figure 77. South and Central America: Synthetic Aperture Radar Market Breakdown, by Platform (2022 and 2030)
Figure 78. South and Central America: Synthetic Aperture Radar Market Breakdown, by Mode (2022 and 2030)
Figure 79. South and Central America: Synthetic Aperture Radar Market Breakdown, by Key Countries, 2022 and 2030 (%)
Figure 80. Brazil: Synthetic Aperture Radar Market – Revenue and Forecast to 2030(US$ Million)
Figure 81. Argentina: Synthetic Aperture Radar Market – Revenue and Forecast to 2030(US$ Million)
Figure 82. Rest of South and Central America: Synthetic Aperture Radar Market – Revenue and Forecast to 2030(US$ Million)
Figure 83. Company Positioning & Concentration
The List of Companies - Synthetic Aperture Radar Market
- Northrop Grumman Corp
- ASELSAN AS
- BAE Systems Plc
- Israel Aerospace Industries Ltd
- Leonardo SpA
- Lockheed Martin Corp
- Raytheon Technologies Corp
- Thales SA
- General Atomics Aeronautical Systems Inc
- Saab AB
The Insight Partners performs research in 4 major stages: Data Collection & Secondary Research, Primary Research, Data Analysis and Data Triangulation & Final Review.
- Data Collection and Secondary Research:
As a market research and consulting firm operating from a decade, we have published many reports and advised several clients across the globe. First step for any study will start with an assessment of currently available data and insights from existing reports. Further, historical and current market information is collected from Investor Presentations, Annual Reports, SEC Filings, etc., and other information related to company’s performance and market positioning are gathered from Paid Databases (Factiva, Hoovers, and Reuters) and various other publications available in public domain.
Several associations trade associates, technical forums, institutes, societies and organizations are accessed to gain technical as well as market related insights through their publications such as research papers, blogs and press releases related to the studies are referred to get cues about the market. Further, white papers, journals, magazines, and other news articles published in the last 3 years are scrutinized and analyzed to understand the current market trends.
- Primary Research:
The primarily interview analysis comprise of data obtained from industry participants interview and answers to survey questions gathered by in-house primary team.
For primary research, interviews are conducted with industry experts/CEOs/Marketing Managers/Sales Managers/VPs/Subject Matter Experts from both demand and supply side to get a 360-degree view of the market. The primary team conducts several interviews based on the complexity of the markets to understand the various market trends and dynamics which makes research more credible and precise.
A typical research interview fulfils the following functions:
- Provides first-hand information on the market size, market trends, growth trends, competitive landscape, and outlook
- Validates and strengthens in-house secondary research findings
- Develops the analysis team’s expertise and market understanding
Primary research involves email interactions and telephone interviews for each market, category, segment, and sub-segment across geographies. The participants who typically take part in such a process include, but are not limited to:
- Industry participants: VPs, business development managers, market intelligence managers and national sales managers
- Outside experts: Valuation experts, research analysts and key opinion leaders specializing in the electronics and semiconductor industry.
Below is the breakup of our primary respondents by company, designation, and region:

Once we receive the confirmation from primary research sources or primary respondents, we finalize the base year market estimation and forecast the data as per the macroeconomic and microeconomic factors assessed during data collection.
- Data Analysis:
Once data is validated through both secondary as well as primary respondents, we finalize the market estimations by hypothesis formulation and factor analysis at regional and country level.
- 3.1 Macro-Economic Factor Analysis:
We analyse macroeconomic indicators such the gross domestic product (GDP), increase in the demand for goods and services across industries, technological advancement, regional economic growth, governmental policies, the influence of COVID-19, PEST analysis, and other aspects. This analysis aids in setting benchmarks for various nations/regions and approximating market splits. Additionally, the general trend of the aforementioned components aid in determining the market's development possibilities.
- 3.2 Country Level Data:
Various factors that are especially aligned to the country are taken into account to determine the market size for a certain area and country, including the presence of vendors, such as headquarters and offices, the country's GDP, demand patterns, and industry growth. To comprehend the market dynamics for the nation, a number of growth variables, inhibitors, application areas, and current market trends are researched. The aforementioned elements aid in determining the country's overall market's growth potential.
- 3.3 Company Profile:
The “Table of Contents” is formulated by listing and analyzing more than 25 - 30 companies operating in the market ecosystem across geographies. However, we profile only 10 companies as a standard practice in our syndicate reports. These 10 companies comprise leading, emerging, and regional players. Nonetheless, our analysis is not restricted to the 10 listed companies, we also analyze other companies present in the market to develop a holistic view and understand the prevailing trends. The “Company Profiles” section in the report covers key facts, business description, products & services, financial information, SWOT analysis, and key developments. The financial information presented is extracted from the annual reports and official documents of the publicly listed companies. Upon collecting the information for the sections of respective companies, we verify them via various primary sources and then compile the data in respective company profiles. The company level information helps us in deriving the base number as well as in forecasting the market size.
- 3.4 Developing Base Number:
Aggregation of sales statistics (2020-2022) and macro-economic factor, and other secondary and primary research insights are utilized to arrive at base number and related market shares for 2022. The data gaps are identified in this step and relevant market data is analyzed, collected from paid primary interviews or databases. On finalizing the base year market size, forecasts are developed on the basis of macro-economic, industry and market growth factors and company level analysis.
- Data Triangulation and Final Review:
The market findings and base year market size calculations are validated from supply as well as demand side. Demand side validations are based on macro-economic factor analysis and benchmarks for respective regions and countries. In case of supply side validations, revenues of major companies are estimated (in case not available) based on industry benchmark, approximate number of employees, product portfolio, and primary interviews revenues are gathered. Further revenue from target product/service segment is assessed to avoid overshooting of market statistics. In case of heavy deviations between supply and demand side values, all thes steps are repeated to achieve synchronization.
We follow an iterative model, wherein we share our research findings with Subject Matter Experts (SME’s) and Key Opinion Leaders (KOLs) until consensus view of the market is not formulated – this model negates any drastic deviation in the opinions of experts. Only validated and universally acceptable research findings are quoted in our reports.
We have important check points that we use to validate our research findings – which we call – data triangulation, where we validate the information, we generate from secondary sources with primary interviews and then we re-validate with our internal data bases and Subject matter experts. This comprehensive model enables us to deliver high quality, reliable data in shortest possible time.
 Get Free Sample For