The transcritical CO2 market size is projected to reach US$ 140,931.01 million by 2030 from US$ 48,529.81 million in 2023. The market is expected to register a CAGR of 16.5% during 2023–2030. The growing need for sustainable cooling and refrigeration solutions is likely to remain a key trend in the market.
Transcritical CO2 Market Analysis
Government policies and regulations related to environmental sustainability and the phase-out of harmful refrigerants can influence the adoption of transcritical CO2 systems globally. For instance, in March 2021, the government of South Africa revised 2030 greenhouse gas emission targets to a range of 398-440 MTCO2e. Such policies may increase the adoption of transcritical CO2 systems globally. Growing environmental consciousness and awareness of climate change can lead to a boosted demand for environment-viable solutions such as transcritical CO2 systems, which, in a way, are boosting the growth of the transcritical CO2 market at the global level.
Transcritical CO2 Market Overview
The adoption of advanced technologies in refrigeration and cooling systems can impact the attractiveness and competitiveness of transcritical CO2 systems in the market. The presence of leading players in the transcritical CO2 market, such as Bitzer Africa and Baltimore Aircoil Africa, is driving the market globally. A growing economy and stable financial conditions can positively influence consumer spending and industrial investment, leading to increased demand for energy-efficient and eco-friendly technologies, which is projected to drive the demand for the transcritical CO2 market globally.
Customize Research To Suit Your Requirement
We can optimize and tailor the analysis and scope which is unmet through our standard offerings. This flexibility will help you gain the exact information needed for your business planning and decision making.
Transcritical CO2 Market: Strategic Insights
Market Size Value in US$ 48,529.81 million in 2023 Market Size Value by US$ 140,931.01 million by 2030 Growth rate CAGR of 16.5% from 2023 to 2030 Forecast Period 2023-2030 Base Year 2023

Naveen
Have a question?
Naveen will walk you through a 15-minute call to present the report’s content and answer all queries if you have any.
 Speak to Analyst
Customize Research To Suit Your Requirement
We can optimize and tailor the analysis and scope which is unmet through our standard offerings. This flexibility will help you gain the exact information needed for your business planning and decision making.
Transcritical CO2 Market: Strategic Insights
| Market Size Value in | US$ 48,529.81 million in 2023 |
| Market Size Value by | US$ 140,931.01 million by 2030 |
| Growth rate | CAGR of 16.5% from 2023 to 2030 |
| Forecast Period | 2023-2030 |
| Base Year | 2023 |
Naveen
Have a question?
Naveen will walk you through a 15-minute call to present the report’s content and answer all queries if you have any.
Speak to Analyst
Transcritical CO2 Market Drivers and Opportunities
Implementation of Transcritical CO2 Systems in Supermarkets and Convenience Stores to Favor Market
Changing consumer preferences, such as a demand for eco-friendly products and sustainable practices, can impact the adoption of transcritical CO2 systems in the retail and food industries. Growing environmental consciousness and awareness of climate change can lead to a fuelled demand for sustainable solutions such as transcritical CO2 systems. Developed regions like Europe are showing an inclination towards the adoption of advancing technologies. Higher disposable incomes owing to economic prosperity have been a major factor driving economic growth. Furthermore, the higher disposable income is leading to growing expenses on quality food products in retail stores and supermarkets. Such a social factor is helping the growth of supermarkets, hypermarkets, retail stores, convenience stores, etc, which is anticipated to boost the development of transcritical CO2 market growth globally.
Adverse Impact of High Global Warming Due to GWP Refrigerants
Developed economies like the European Union and North America are more focused on the adoption of advanced technology in various industry verticals. The North American and European Union have implemented laws and policies aimed at lowering greenhouse gas emissions and combatting climate change. Also, the European Union has implemented regulations to phase out hydrofluorocarbons with high global warming potentials. This has created a beneficial regulatory environment for transcritical CO2 systems, driving their growth in the European market. The mounting awareness of the adverse impact of GWP refrigerants is anticipated to drive the growth of the transcritical CO2 market in the coming years.
Transcritical CO2 Market Report Segmentation Analysis
Key segments that contributed to the derivation of the transcritical CO2 market analysis are application and function.
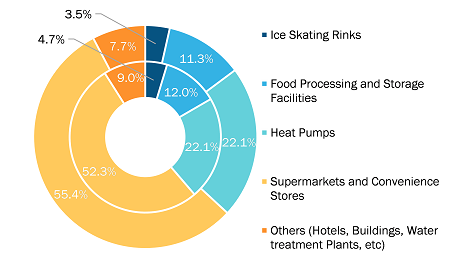
- Based on the application, the transcritical CO2 market is divided into ice skating rinks, heat pumps, food processing & storage facilities, supermarkets & convenience stores, and others. The supermarkets and convenience stores segment held a larger market share in 2023.
- By function, the market is segmented into air conditioning, refrigeration, and heating. The refrigeration segment held a significant share of the market in 2023.
Transcritical CO2 Market Share Analysis by Geography
The geographic scope of the Transcritical CO2 market report is mainly divided into five regions: North America, Asia Pacific, Europe, Middle East & Africa, and South & Central America.
Europe is leading the market. Europe is one of the leading regions for the adoption of advancing technologies. Countries like the UK, Germany, and France have adopted advanced technology such as IoT, IIoT, and Industry. Continuous advancements in transcritical CO2 system technology have improved their performance, efficiency, and reliability. European manufacturers and researchers have played a key role in developing and refining transcritical CO2 system components and system designs. These advancements boosted the transcritical CO2 market.
Transcritical CO2 Market Report Scope
Transcritical CO2 Market News and Recent Developments
The Transcritical CO2 market is evaluated by gathering qualitative and quantitative data post primary and secondary research, which includes important corporate publications, association data, and databases. A few of the developments in the Transcritical CO2 market are listed below:
- EDEKA Beckesepp, a German food retailer company, installed a transcritical CO2 (R744) refrigeration system for Teko GmbH. (Source: EDEKA Beckesepp, Press Release, January 2022)
- Carrier Commercial Refrigeration showcased its 20,000th carbon dioxide (CO2) transcritical refrigeration rack in Europe, marking a significant achievement for the company, including its PROFROID and Green & Cool brands. (Source: Carrier Global Corp, Press Release, December 2022)
Transcritical CO2 Market Report Coverage and Deliverables
The “Transcritical CO2 Market Size and Forecast (2020–2030)” report provides a detailed analysis of the market covering below areas:
- Transcritical CO2 market size and forecast at global, regional, and country levels for all the key market segments covered under the scope
- Transcritical CO2 market trends as well as market dynamics such as drivers, restraints, and key opportunities
- Detailed PEST and SWOT analysis
- Transcritical CO2 market analysis covering key market trends, global and regional framework, major players, regulations, and recent market developments
- Industry landscape and competition analysis covering market concentration, heat map analysis, prominent players, and recent developments for the transcritical CO2 market
- Detailed company profiles

Report Coverage
Revenue forecast, Company Analysis, Industry landscape, Growth factors, and Trends

Segment Covered
Application, and Function

Regional Scope
North America, Europe, Asia Pacific, Middle East & Africa, South & Central America

Country Scope
Argentina, Australia, Brazil, Canada, China, France, Germany, India, Italy, Japan, Mexico, Russian Federation, Saudi Arabia, South Africa, South Korea, United Arab Emirates, United Kingdom, United States
Frequently Asked Questions
15.4% is the expected CAGR of the transcritical CO2 market.
US$ 1,52,352.4 million estimated value of the transcritical CO2 market by 2031.
TEKO Gesellschaft fur Kaltetechnik mbH, Baltimore Aircoil Co, BITZER Kuhlmaschinenbau GmbH, Carrier Global Corp, Danfoss AS, Hussmann Corporation, Emerson Electric Co, Panasonic Holdings Corp, Evapco LMP Inc, Mayekawa Manufacturing Co Ltd are some of the leading players in the market.
The adoption of transcritical CO2 systems in supermarkets and convenience stores is the future trend of the Transcritical CO2 market.
Europe dominated the transcritical CO2 market in 2023.
1. Introduction
1.1 Study Scope
1.2 The Insight Partners Research Report Guidance
1.3 Market Segmentation
2. Key Takeaways
3. Research Methodology
3.1 Coverage
3.2 Secondary Research
3.3 Primary Research
4. Transcritical CO2 Market Landscape
4.1 Market Overview
4.2 PEST Analysis
4.2.1 North America
4.2.2 Europe
4.2.3 Asia Pacific
4.2.4 Middle East & Africa
4.2.5 South America
4.3 Ecosystem Analysis
4.4 Expert Opinion
5. Transcritical CO2 Market – Key Market Dynamics
5.1 Market Drivers
5.1.1 Sustainable Cooling and Refrigeration Solutions
5.1.2 Adoption of Transcritical CO2 Systems in Supermarkets and Convenience Stores
5.2 Market Restraints
5.2.1 Higher Upfront Cost of Installing Transcritical CO2 System
5.3 Market Opportunities
5.3.1 Adverse Impact of High Global Warming Potential Refrigerants
5.4 Future Trends
5.4.1 Growing Adoption of Integrated Transcritical CO2 Systems
5.5 Impact Analysis of Drivers and Restraints
6. Transcritical CO2 Market – Global market Analysis
6.1 Transcritical CO2 Market Global Overview
6.2 Transcritical CO2 Market – Revenue and Forecast to 2030 (US$ Million)
6.3 Market Positioning – Five Key Players
7. Transcritical CO2 Market Analysis – By Application
7.1 Overview
7.2 Transcritical CO2 Market, By Application (2022 and 2030)
7.3 Ice Skating Rinks
7.3.1 Overview
7.3.2 Ice Skating Rinks: Transcritical CO2 Market – Revenue, and Forecast to 2030 (US$ Million)
7.4 Food Processing & Storage Facilities
7.4.1 Overview
7.4.2 Food Processing & Storage Facilities: Transcritical CO2 Market – Revenue, and Forecast to 2030 (US$ Million)
7.5 Heat Pumps
7.5.1 Overview
7.5.2 Heat Pumps: Transcritical CO2 Market – Revenue, and Forecast to 2030 (US$ Million)
7.6 Supermarkets & Convenience Stores
7.6.1 Overview
7.6.2 Supermarkets & Convenience Stores: Transcritical CO2 Market – Revenue, and Forecast to 2030 (US$ Million)
7.7 Others
7.7.1 Overview
7.7.2 Others: Transcritical CO2 Market – Revenue, and Forecast to 2030 (US$ Million)
8. Transcritical CO2 Market Analysis – By Function
8.1 Overview
8.2 Transcritical CO2 Market, By Function (2022 and 2030)
8.3 Air Conditioning
8.3.1 Overview
8.3.2 Air Conditioning: Transcritical CO2 Market – Revenue, and Forecast to 2030 (US$ Million)
8.4 Refrigeration
8.4.1 Overview
8.4.2 Refrigeration: Transcritical CO2 Market – Revenue, and Forecast to 2030 (US$ Million)
8.5 Heating
8.5.1 Overview
8.5.2 Heating: Transcritical CO2 Market – Revenue, and Forecast to 2030 (US$ Million)
9. Transcritical CO2 Market– Geographic Analysis
9.1 Overview
9.2 North America: Transcritical CO2 Market
9.2.1 North America: Transcritical CO2 Market – Revenue, and Forecast to 2030 (US$ Million)
9.2.2 North America: Transcritical CO2 Market, By Application
9.2.3 North America: Transcritical CO2 Market, By Function Type
9.2.4 North America: Transcritical CO2 Market, by Key Country
9.2.4.1 US: Transcritical CO2 Market– Revenue and Forecast to 2030 (US$ Million)
9.2.4.1.1 US: Transcritical CO2 Market, By Application
9.2.4.1.2 US: Transcritical CO2 Market, By Function Type
9.2.4.2 Canada: Transcritical CO2 Market– Revenue and Forecast to 2030 (US$ Million)
9.2.4.2.1 Canada: Transcritical CO2 Market, By Application
9.2.4.2.2 Canada: Transcritical CO2 Market, By Function Type
9.2.4.3 Mexico: Transcritical CO2 Market– Revenue and Forecast to 2030 (US$ Million)
9.2.4.3.1 Mexico: Transcritical CO2 Market, By Application
9.2.4.3.2 Mexico: Transcritical CO2 Market, By Function Type
9.3 Europe: Transcritical CO2 Market
9.3.1 Europe: Transcritical CO2 Market – Revenue, and Forecast to 2030 (US$ Million)
9.3.2 Europe: Transcritical CO2 Market, By Application
9.3.3 Europe: Transcritical CO2 Market, By Function Type
9.3.4 Europe: Transcritical CO2 Market, by Key Country
9.3.4.1 Germany: Transcritical CO2 Market– Revenue and Forecast to 2030 (US$ Million)
9.3.4.1.1 Germany: Transcritical CO2 Market, By Application
9.3.4.1.2 Germany: Transcritical CO2 Market, By Function Type
9.3.4.2 France: Transcritical CO2 Market– Revenue and Forecast to 2030 (US$ Million)
9.3.4.2.1 France: Transcritical CO2 Market, By Application
9.3.4.2.2 France: Transcritical CO2 Market, By Function Type
9.3.4.3 Italy: Transcritical CO2 Market– Revenue and Forecast to 2030 (US$ Million)
9.3.4.3.1 Italy: Transcritical CO2 Market, By Application
9.3.4.3.2 Italy: Transcritical CO2 Market, By Function Type
9.3.4.4 UK: Transcritical CO2 Market– Revenue and Forecast to 2030 (US$ Million)
9.3.4.4.1 UK: Transcritical CO2 Market, By Application
9.3.4.4.2 UK: Transcritical CO2 Market, By Function Type
9.3.4.5 Russia: Transcritical CO2 Market– Revenue and Forecast to 2030 (US$ Million)
9.3.4.5.1 Russia: Transcritical CO2 Market, By Application
9.3.4.5.2 Russia: Transcritical CO2 Market, By Function Type
9.3.4.6 Rest of Europe: Transcritical CO2 Market– Revenue and Forecast to 2030 (US$ Million)
9.3.4.6.1 Rest of Europe: Transcritical CO2 Market, By Application
9.3.4.6.2 Rest of Europe: Transcritical CO2 Market, By Function Type
9.4 Asia Pacific: Transcritical CO2 Market
9.4.1 Asia Pacific: Transcritical CO2 Market – Revenue, and Forecast to 2030 (US$ Million)
9.4.2 Asia Pacific: Transcritical CO2 Market, By Application
9.4.3 Asia Pacific: Transcritical CO2 Market, By Function Type
9.4.4 Asia Pacific: Transcritical CO2 Market, by Key Country
9.4.4.1 Australia: Transcritical CO2 Market– Revenue and Forecast to 2030 (US$ Million)
9.4.4.1.1 Australia: Transcritical CO2 Market, By Application
9.4.4.1.2 Australia: Transcritical CO2 Market, By Function Type
9.4.4.2 China: Transcritical CO2 Market– Revenue and Forecast to 2030 (US$ Million)
9.4.4.2.1 China: Transcritical CO2 Market, By Application
9.4.4.2.2 China: Transcritical CO2 Market, By Function Type
9.4.4.3 India: Transcritical CO2 Market– Revenue and Forecast to 2030 (US$ Million)
9.4.4.3.1 India: Transcritical CO2 Market, By Application
9.4.4.3.2 India: Transcritical CO2 Market, By Function Type
9.4.4.4 Japan: Transcritical CO2 Market– Revenue and Forecast to 2030 (US$ Million)
9.4.4.4.1 Japan: Transcritical CO2 Market, By Application
9.4.4.4.2 Japan: Transcritical CO2 Market, By Function Type
9.4.4.5 South Korea: Transcritical CO2 Market– Revenue and Forecast to 2030 (US$ Million)
9.4.4.5.1 South Korea: Transcritical CO2 Market, By Application
9.4.4.5.2 South Korea: Transcritical CO2 Market, By Function Type
9.4.4.6 Rest of APAC: Transcritical CO2 Market– Revenue and Forecast to 2030 (US$ Million)
9.4.4.6.1 Rest of APAC: Transcritical CO2 Market, By Application
9.4.4.6.2 Rest of APAC: Transcritical CO2 Market, By Function Type
9.5 Middle East & Africa: Transcritical CO2 Market
9.5.1 Middle East & Africa: Transcritical CO2 Market – Revenue, and Forecast to 2030 (US$ Million)
9.5.2 Middle East & Africa: Transcritical CO2 Market, By Application
9.5.3 Middle East & Africa: Transcritical CO2 Market, By Function Type
9.5.4 Middle East & Africa: Transcritical CO2 Market, by Key Country
9.5.4.1 South Africa: Transcritical CO2 Market– Revenue and Forecast to 2030 (US$ Million)
9.5.4.1.1 South Africa: Transcritical CO2 Market, By Application
9.5.4.1.2 South Africa: Transcritical CO2 Market, By Function Type
9.5.4.2 Saudi Arabia: Transcritical CO2 Market– Revenue and Forecast to 2030 (US$ Million)
9.5.4.2.1 Saudi Arabia: Transcritical CO2 Market, By Application
9.5.4.2.2 Saudi Arabia: Transcritical CO2 Market, By Function Type
9.5.4.3 UAE: Transcritical CO2 Market– Revenue and Forecast to 2030 (US$ Million)
9.5.4.3.1 UAE: Transcritical CO2 Market, By Application
9.5.4.3.2 UAE: Transcritical CO2 Market, By Function Type
9.5.4.4 Rest of MEA: Transcritical CO2 Market– Revenue and Forecast to 2030 (US$ Million)
9.5.4.4.1 Rest of MEA: Transcritical CO2 Market, By Application
9.5.4.4.2 Rest of MEA: Transcritical CO2 Market, By Function Type
9.6 South America: Transcritical CO2 Market
9.6.1 South America: Transcritical CO2 Market – Revenue, and Forecast to 2030 (US$ Million)
9.6.2 South America: Transcritical CO2 Market, By Application
9.6.3 South America: Transcritical CO2 Market, By Function Type
9.6.4 South America: Transcritical CO2 Market, by Key Country
9.6.4.1 Brazil: Transcritical CO2 Market– Revenue and Forecast to 2030 (US$ Million)
9.6.4.1.1 Brazil: Transcritical CO2 Market, By Application
9.6.4.1.2 Brazil: Transcritical CO2 Market, By Function Type
9.6.4.2 Argentina: Transcritical CO2 Market– Revenue and Forecast to 2030 (US$ Million)
9.6.4.2.1 Argentina: Transcritical CO2 Market, By Application
9.6.4.2.2 Argentina: Transcritical CO2 Market, By Function Type
9.6.4.3 Rest of SAM: Transcritical CO2 Market– Revenue and Forecast to 2030 (US$ Million)
9.6.4.3.1 Rest of SAM: Transcritical CO2 Market, By Application
9.6.4.3.2 Rest of SAM: Transcritical CO2 Market, By Function Type
10. Impact of COVID-19 Pandemic on Global Transcritical CO2 Market
10.1 Overview
10.2 North America: Impact Assessment of Covid-19 Pandemic
10.3 Europe: Impact Assessment of Covid-19 Pandemic
10.4 Asia Pacific (APAC): Impact Assessment of Covid-19 Pandemic
10.5 MEA: Impact Assessment of Covid-19 Pandemic
10.6 South America: Impact Assessment of Covid-19 Pandemic
11. Industry Landscape
11.1 Overview
11.2 Market Initiative
11.3 New Product Development
11.4 Merger and Acquisition
12. Company Profiles
12.1 TEKO Gesellschaft fur Kaltetechnik mbH
12.1.1 Key Facts
12.1.2 Business Description
12.1.3 Products and Services
12.1.4 Financial Overview
12.1.5 SWOT Analysis
12.1.6 Key Developments
12.2 Baltimore Aircoil Co
12.2.1 Key Facts
12.2.2 Business Description
12.2.3 Products and Services
12.2.4 Financial Overview
12.2.5 SWOT Analysis
12.2.6 Key Developments
12.3 BITZER Kuhlmaschinenbau GmbH
12.3.1 Key Facts
12.3.2 Business Description
12.3.3 Products and Services
12.3.4 Financial Overview
12.3.5 SWOT Analysis
12.3.6 Key Developments
12.4 Carrier Global Corp
12.4.1 Key Facts
12.4.2 Business Description
12.4.3 Products and Services
12.4.4 Financial Overview
12.4.5 SWOT Analysis
12.4.6 Key Developments
12.5 Danfoss AS
12.5.1 Key Facts
12.5.2 Business Description
12.5.3 Products and Services
12.5.4 Financial Overview
12.5.5 SWOT Analysis
12.5.6 Key Developments
12.6 Hussmann Corp
12.6.1 Key Facts
12.6.2 Business Description
12.6.3 Products and Services
12.6.4 Financial Overview
12.6.5 SWOT Analysis
12.6.6 Key Developments
12.7 Emerson Electric Co
12.7.1 Key Facts
12.7.2 Business Description
12.7.3 Products and Services
12.7.4 Financial Overview
12.7.5 SWOT Analysis
12.7.6 Key Developments
12.8 Panasonic Holdings Corp
12.8.1 Key Facts
12.8.2 Business Description
12.8.3 Products and Services
12.8.4 Financial Overview
12.8.5 SWOT Analysis
12.8.6 Key Developments
12.9 Evapco LMP Inc
12.9.1 Key Facts
12.9.2 Business Description
12.9.3 Products and Services
12.9.4 Financial Overview
12.9.5 SWOT Analysis
12.9.6 Key Developments
12.10 Mayekawa Manufacturing Co Ltd
12.10.1 Key Facts
12.10.2 Business Description
12.10.3 Products and Services
12.10.4 Financial Overview
12.10.5 SWOT Analysis
12.10.6 Key Developments
13. Appendix
13.1 About The Insight Partners
13.2 Word Index
LIST OF TABLES
Table 1. Transcritical CO2 Market – Revenue and Forecast to 2030 (US$ Million)
Table 2. North America: Transcritical CO2 Market, By Application – Revenue and Forecast to 2030 (US$ Million)
Table 3. North America: Transcritical CO2 Market, By Function Type – Revenue and Forecast to 2030 (US$ Million)
Table 4. US: Transcritical CO2 Market, By Application – Revenue and Forecast to 2030 (US$ Million)
Table 5. US: Transcritical CO2 Market, By Function Type – Revenue and Forecast to 2030 (US$ Million)
Table 6. Canada: Transcritical CO2 Market, By Application – Revenue and Forecast to 2030 (US$ Million)
Table 7. Canada: Transcritical CO2 Market, By Function Type – Revenue and Forecast to 2030 (US$ Million)
Table 8. Mexico: Transcritical CO2 Market, By Application – Revenue and Forecast to 2030 (US$ Million)
Table 9. Mexico: Transcritical CO2 Market, By Function Type – Revenue and Forecast to 2030 (US$ Million)
Table 10. Europe: Transcritical CO2 Market, By Application – Revenue and Forecast to 2030 (US$ Million)
Table 11. Europe: Transcritical CO2 Market, By Function Type – Revenue and Forecast to 2030 (US$ Million)
Table 12. Germany: Transcritical CO2 Market, By Application – Revenue and Forecast to 2030 (US$ Million)
Table 13. Germany: Transcritical CO2 Market, By Function Type – Revenue and Forecast to 2030 (US$ Million)
Table 14. France: Transcritical CO2 Market, By Application – Revenue and Forecast to 2030 (US$ Million)
Table 15. France: Transcritical CO2 Market, By Function Type – Revenue and Forecast to 2030 (US$ Million)
Table 16. Italy: Transcritical CO2 Market, By Application – Revenue and Forecast to 2030 (US$ Million)
Table 17. Italy: Transcritical CO2 Market, By Function Type – Revenue and Forecast to 2030 (US$ Million)
Table 18. UK: Transcritical CO2 Market, By Application – Revenue and Forecast to 2030 (US$ Million)
Table 19. UK: Transcritical CO2 Market, By Function Type – Revenue and Forecast to 2030 (US$ Million)
Table 20. Russia: Transcritical CO2 Market, By Application – Revenue and Forecast to 2030 (US$ Million)
Table 21. Russia: Transcritical CO2 Market, By Function Type – Revenue and Forecast to 2030 (US$ Million)
Table 22. Rest of Europe: Transcritical CO2 Market, By Application – Revenue and Forecast to 2030 (US$ Million)
Table 23. Rest of Europe: Transcritical CO2 Market, By Function Type – Revenue and Forecast to 2030 (US$ Million)
Table 24. Asia Pacific: Transcritical CO2 Market, By Application – Revenue and Forecast to 2030 (US$ Million)
Table 25. Asia Pacific: Transcritical CO2 Market, By Function Type – Revenue and Forecast to 2030 (US$ Million)
Table 26. Australia: Transcritical CO2 Market, By Application – Revenue and Forecast to 2030 (US$ Million)
Table 27. Australia: Transcritical CO2 Market, By Function Type – Revenue and Forecast to 2030 (US$ Million)
Table 28. China: Transcritical CO2 Market, By Application – Revenue and Forecast to 2030 (US$ Million)
Table 29. China: Transcritical CO2 Market, By Function Type – Revenue and Forecast to 2030 (US$ Million)
Table 30. India: Transcritical CO2 Market, By Application – Revenue and Forecast to 2030 (US$ Million)
Table 31. India: Transcritical CO2 Market, By Function Type – Revenue and Forecast to 2030 (US$ Million)
Table 32. Japan: Transcritical CO2 Market, By Application – Revenue and Forecast to 2030 (US$ Million)
Table 33. Japan: Transcritical CO2 Market, By Function Type – Revenue and Forecast to 2030 (US$ Million)
Table 34. South Korea: Transcritical CO2 Market, By Application – Revenue and Forecast to 2030 (US$ Million)
Table 35. South Korea: Transcritical CO2 Market, By Function Type – Revenue and Forecast to 2030 (US$ Million)
Table 36. Rest of APAC: Transcritical CO2 Market, By Application – Revenue and Forecast to 2030 (US$ Million)
Table 37. Rest of APAC: Transcritical CO2 Market, By Function Type – Revenue and Forecast to 2030 (US$ Million)
Table 38. Middle East & Africa: Transcritical CO2 Market, By Application – Revenue and Forecast to 2030 (US$ Million)
Table 39. Middle East & Africa: Transcritical CO2 Market, By Function Type – Revenue and Forecast to 2030 (US$ Million)
Table 40. South Africa: Transcritical CO2 Market, By Application – Revenue and Forecast to 2030 (US$ Million)
Table 41. South Africa: Transcritical CO2 Market, By Function Type – Revenue and Forecast to 2030 (US$ Million)
Table 42. Saudi Arabia: Transcritical CO2 Market, By Application – Revenue and Forecast to 2030 (US$ Million)
Table 43. Saudi Arabia: Transcritical CO2 Market, By Function Type – Revenue and Forecast to 2030 (US$ Million)
Table 44. UAE: Transcritical CO2 Market, By Application – Revenue and Forecast to 2030 (US$ Million)
Table 45. UAE: Transcritical CO2 Market, By Function Type – Revenue and Forecast to 2030 (US$ Million)
Table 46. Rest of MEA: Transcritical CO2 Market, By Application – Revenue and Forecast to 2030 (US$ Million)
Table 47. Rest of MEA: Transcritical CO2 Market, By Function Type – Revenue and Forecast to 2030 (US$ Million)
Table 48. South America: Transcritical CO2 Market, By Application – Revenue and Forecast to 2030 (US$ Million)
Table 49. South America: Transcritical CO2 Market, By Function Type – Revenue and Forecast to 2030 (US$ Million)
Table 50. Brazil: Transcritical CO2 Market, By Application – Revenue and Forecast to 2030 (US$ Million)
Table 51. Brazil: Transcritical CO2 Market, By Function Type – Revenue and Forecast to 2030 (US$ Million)
Table 52. Argentina: Transcritical CO2 Market, By Application – Revenue and Forecast to 2030 (US$ Million)
Table 53. Argentina: Transcritical CO2 Market, By Function Type – Revenue and Forecast to 2030 (US$ Million)
Table 54. Rest of SAM: Transcritical CO2 Market, By Application – Revenue and Forecast to 2030 (US$ Million)
Table 55. Rest of SAM: Transcritical CO2 Market, By Function Type – Revenue and Forecast to 2030 (US$ Million)
Table 56. List of Abbreviation
LIST OF FIGURES
Figure 1. Transcritical CO2 Market Segmentation
Figure 2. Transcritical CO2 Market Segmentation – By Geography
Figure 3. Global Transcritical CO2 Market Overview
Figure 4. Transcritical CO2 Market, by Application
Figure 5. Transcritical CO2 Market, by Function
Figure 6. Transcritical CO2 Market, by Geography
Figure 7. North America: PEST Analysis
Figure 8. Europe: PEST Analysis
Figure 9. Asia Pacific: PEST Analysis
Figure 10. Middle East & Africa: PEST Analysis
Figure 11. South America: PEST Analysis
Figure 12. Expert Opinion
Figure 13. Transcritical CO2 Market Impact Analysis of Drivers and Restraints
Figure 14. Geographic Overview of Transcritical CO2 Market
Figure 15. Transcritical CO2 Market – Revenue and Forecast to 2030 (US$ Million)
Figure 16. Transcritical CO2 Market Revenue Share, By Application (2022 and 2030)
Figure 17. Ice Skating Rinks: Transcritical CO2 Market – Revenue, and Forecast to 2030 (US$ Million)
Figure 18. Food Processing & Storage Facilities: Transcritical CO2 Market – Revenue, and Forecast to 2030 (US$ Million)
Figure 19. Heat Pumps: Transcritical CO2 Market – Revenue, and Forecast to 2030 (US$ Million)
Figure 20. Supermarkets & Convenience Stores: Transcritical CO2 Market – Revenue, and Forecast to 2030 (US$ Million)
Figure 21. Others: Transcritical CO2 Market – Revenue, and Forecast to 2030 (US$ Million)
Figure 22. Transcritical CO2 Market Revenue Share, By Function (2022 and 2030)
Figure 23. Air Conditioning: Transcritical CO2 Market – Revenue, and Forecast to 2030 (US$ Million)
Figure 24. Refrigeration: Transcritical CO2 Market – Revenue, and Forecast to 2030 (US$ Million)
Figure 25. Heating: Transcritical CO2 Market – Revenue, and Forecast to 2030 (US$ Million)
Figure 26. Global Transcritical CO2 Market Revenue Share, By Region (2022 and 2030)
Figure 27. North America: Transcritical CO2 Market – Revenue and Forecast to 2030 (US$ Million)
Figure 28. North America: Transcritical CO2 Revenue Share, By Application (2022 and 2030)
Figure 29. North America: Transcritical CO2 Revenue Share, By Function Type (2022 and 2030)
Figure 30. North America: Transcritical CO2 Revenue Share, by Key Country (2022 and 2030)
Figure 31. US: Transcritical CO2 Market– Revenue and Forecast to 2030 (US$ Million)
Figure 32. Canada: Transcritical CO2 Market– Revenue and Forecast to 2030 (US$ Million)
Figure 33. Mexico: Transcritical CO2 Market– Revenue and Forecast to 2030 (US$ Million)
Figure 34. Europe: Transcritical CO2 Market – Revenue and Forecast to 2030 (US$ Million)
Figure 35. Europe: Transcritical CO2 Revenue Share, By Application (2022 and 2030)
Figure 36. Europe: Transcritical CO2 Revenue Share, By Function Type (2022 and 2030)
Figure 37. Europe: Transcritical CO2 Revenue Share, by Key Country (2022 and 2030)
Figure 38. Germany: Transcritical CO2 Market– Revenue and Forecast to 2030 (US$ Million)
Figure 39. France: Transcritical CO2 Market– Revenue and Forecast to 2030 (US$ Million)
Figure 40. Italy: Transcritical CO2 Market– Revenue and Forecast to 2030 (US$ Million)
Figure 41. UK: Transcritical CO2 Market– Revenue and Forecast to 2030 (US$ Million)
Figure 42. Russia: Transcritical CO2 Market– Revenue and Forecast to 2030 (US$ Million)
Figure 43. Rest of Europe: Transcritical CO2 Market– Revenue and Forecast to 2030 (US$ Million)
Figure 44. Asia Pacific: Transcritical CO2 Market – Revenue and Forecast to 2030 (US$ Million)
Figure 45. Asia Pacific: Transcritical CO2 Revenue Share, By Application (2022 and 2030)
Figure 46. Asia Pacific: Transcritical CO2 Revenue Share, By Function Type (2022 and 2030)
Figure 47. Asia Pacific: Transcritical CO2 Revenue Share, by Key Country (2022 and 2030)
Figure 48. Australia: Transcritical CO2 Market– Revenue and Forecast to 2030 (US$ Million)
Figure 49. China: Transcritical CO2 Market– Revenue and Forecast to 2030 (US$ Million)
Figure 50. India: Transcritical CO2 Market– Revenue and Forecast to 2030 (US$ Million)
Figure 51. Japan: Transcritical CO2 Market– Revenue and Forecast to 2030 (US$ Million)
Figure 52. South Korea: Transcritical CO2 Market– Revenue and Forecast to 2030 (US$ Million)
Figure 53. Rest of APAC: Transcritical CO2 Market– Revenue and Forecast to 2030 (US$ Million)
Figure 54. Middle East & Africa: Transcritical CO2 Market – Revenue and Forecast to 2030 (US$ Million)
Figure 55. Middle East & Africa: Transcritical CO2 Revenue Share, By Application (2022 and 2030)
Figure 56. Middle East & Africa: Transcritical CO2 Revenue Share, By Function Type (2022 and 2030)
Figure 57. Middle East & Africa: Transcritical CO2 Revenue Share, by Key Country (2022 and 2030)
Figure 58. South Africa: Transcritical CO2 Market– Revenue and Forecast to 2030 (US$ Million)
Figure 59. Saudi Arabia: Transcritical CO2 Market– Revenue and Forecast to 2030 (US$ Million)
Figure 60. UAE: Transcritical CO2 Market– Revenue and Forecast to 2030 (US$ Million)
Figure 61. Rest of MEA: Transcritical CO2 Market– Revenue and Forecast to 2030 (US$ Million)
Figure 62. South America: Transcritical CO2 Market – Revenue and Forecast to 2030 (US$ Million)
Figure 63. South America: Transcritical CO2 Revenue Share, By Application (2022 and 2030)
Figure 64. South America: Transcritical CO2 Revenue Share, By Function Type (2022 and 2030)
Figure 65. South America: Transcritical CO2 Revenue Share, by Key Country (2022 and 2030)
Figure 66. Brazil: Transcritical CO2 Market– Revenue and Forecast to 2030 (US$ Million)
Figure 67. Argentina: Transcritical CO2 Market– Revenue and Forecast to 2030 (US$ Million)
Figure 68. Rest of SAM: Transcritical CO2 Market– Revenue and Forecast to 2030 (US$ Million)
Figure 69. Impact of Covid-19 Pandemic in North American Country Markets
Figure 70. Impact of Covid-19 Pandemic in European Country Markets
Figure 71. Impact of Covid-19 Pandemic in APAC Country Markets
Figure 72. Impact of Covid-19 Pandemic in MEA Country Markets
Figure 73. Impact of Covid-19 Pandemic in South American Country Markets
The Insight Partners performs research in 4 major stages: Data Collection & Secondary Research, Primary Research, Data Analysis and Data Triangulation & Final Review.
- Data Collection and Secondary Research:
As a market research and consulting firm operating from a decade, we have published many reports and advised several clients across the globe. First step for any study will start with an assessment of currently available data and insights from existing reports. Further, historical and current market information is collected from Investor Presentations, Annual Reports, SEC Filings, etc., and other information related to company’s performance and market positioning are gathered from Paid Databases (Factiva, Hoovers, and Reuters) and various other publications available in public domain.
Several associations trade associates, technical forums, institutes, societies and organizations are accessed to gain technical as well as market related insights through their publications such as research papers, blogs and press releases related to the studies are referred to get cues about the market. Further, white papers, journals, magazines, and other news articles published in the last 3 years are scrutinized and analyzed to understand the current market trends.
- Primary Research:
The primarily interview analysis comprise of data obtained from industry participants interview and answers to survey questions gathered by in-house primary team.
For primary research, interviews are conducted with industry experts/CEOs/Marketing Managers/Sales Managers/VPs/Subject Matter Experts from both demand and supply side to get a 360-degree view of the market. The primary team conducts several interviews based on the complexity of the markets to understand the various market trends and dynamics which makes research more credible and precise.
A typical research interview fulfils the following functions:
- Provides first-hand information on the market size, market trends, growth trends, competitive landscape, and outlook
- Validates and strengthens in-house secondary research findings
- Develops the analysis team’s expertise and market understanding
Primary research involves email interactions and telephone interviews for each market, category, segment, and sub-segment across geographies. The participants who typically take part in such a process include, but are not limited to:
- Industry participants: VPs, business development managers, market intelligence managers and national sales managers
- Outside experts: Valuation experts, research analysts and key opinion leaders specializing in the electronics and semiconductor industry.
Below is the breakup of our primary respondents by company, designation, and region:

Once we receive the confirmation from primary research sources or primary respondents, we finalize the base year market estimation and forecast the data as per the macroeconomic and microeconomic factors assessed during data collection.
- Data Analysis:
Once data is validated through both secondary as well as primary respondents, we finalize the market estimations by hypothesis formulation and factor analysis at regional and country level.
- 3.1 Macro-Economic Factor Analysis:
We analyse macroeconomic indicators such the gross domestic product (GDP), increase in the demand for goods and services across industries, technological advancement, regional economic growth, governmental policies, the influence of COVID-19, PEST analysis, and other aspects. This analysis aids in setting benchmarks for various nations/regions and approximating market splits. Additionally, the general trend of the aforementioned components aid in determining the market's development possibilities.
- 3.2 Country Level Data:
Various factors that are especially aligned to the country are taken into account to determine the market size for a certain area and country, including the presence of vendors, such as headquarters and offices, the country's GDP, demand patterns, and industry growth. To comprehend the market dynamics for the nation, a number of growth variables, inhibitors, application areas, and current market trends are researched. The aforementioned elements aid in determining the country's overall market's growth potential.
- 3.3 Company Profile:
The “Table of Contents” is formulated by listing and analyzing more than 25 - 30 companies operating in the market ecosystem across geographies. However, we profile only 10 companies as a standard practice in our syndicate reports. These 10 companies comprise leading, emerging, and regional players. Nonetheless, our analysis is not restricted to the 10 listed companies, we also analyze other companies present in the market to develop a holistic view and understand the prevailing trends. The “Company Profiles” section in the report covers key facts, business description, products & services, financial information, SWOT analysis, and key developments. The financial information presented is extracted from the annual reports and official documents of the publicly listed companies. Upon collecting the information for the sections of respective companies, we verify them via various primary sources and then compile the data in respective company profiles. The company level information helps us in deriving the base number as well as in forecasting the market size.
- 3.4 Developing Base Number:
Aggregation of sales statistics (2020-2022) and macro-economic factor, and other secondary and primary research insights are utilized to arrive at base number and related market shares for 2022. The data gaps are identified in this step and relevant market data is analyzed, collected from paid primary interviews or databases. On finalizing the base year market size, forecasts are developed on the basis of macro-economic, industry and market growth factors and company level analysis.
- Data Triangulation and Final Review:
The market findings and base year market size calculations are validated from supply as well as demand side. Demand side validations are based on macro-economic factor analysis and benchmarks for respective regions and countries. In case of supply side validations, revenues of major companies are estimated (in case not available) based on industry benchmark, approximate number of employees, product portfolio, and primary interviews revenues are gathered. Further revenue from target product/service segment is assessed to avoid overshooting of market statistics. In case of heavy deviations between supply and demand side values, all thes steps are repeated to achieve synchronization.
We follow an iterative model, wherein we share our research findings with Subject Matter Experts (SME’s) and Key Opinion Leaders (KOLs) until consensus view of the market is not formulated – this model negates any drastic deviation in the opinions of experts. Only validated and universally acceptable research findings are quoted in our reports.
We have important check points that we use to validate our research findings – which we call – data triangulation, where we validate the information, we generate from secondary sources with primary interviews and then we re-validate with our internal data bases and Subject matter experts. This comprehensive model enables us to deliver high quality, reliable data in shortest possible time.
 Get Free Sample For