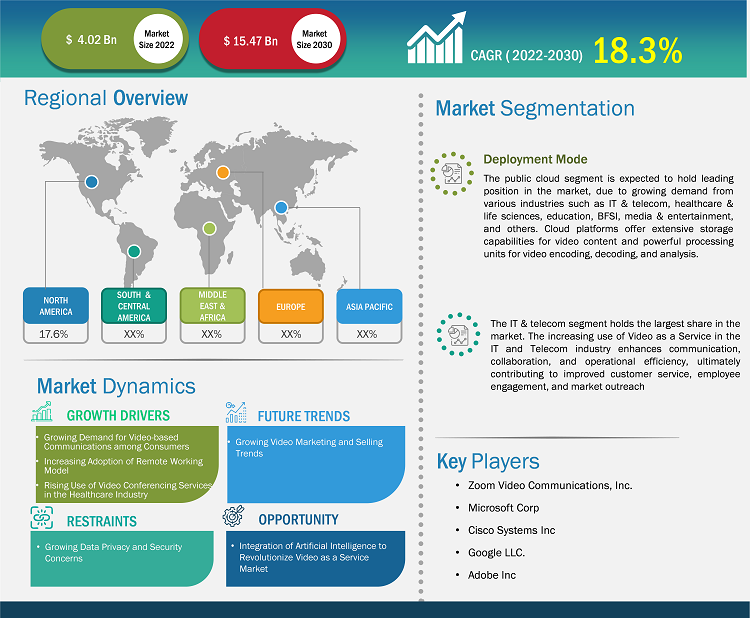
The Video as a Service market size is projected to reach US$ 15.47 billion by 2030 from US$ 4.02 billion in 2022. The market is expected to register a CAGR of 18.3% during 2022–2030. Enhanced security and growth in live streaming are likely to remain a key trend in the market.
Video as a Service Market Analysis
Growing demand for video-based communications among consumers, a shift from full-time on-site work to a remote or hybrid working model, rising use of video conferencing services in the healthcare industry, increasing investments in video conferencing solutions, and growing adoption of cloud technology drive the video as a service market growth. However, growing data privacy and security concerns due to the lack of cybersecurity measures hinder the growth of video as a service market. The population in developed and developing countries increasingly adopt and implement advanced technologies in various systems. Demand for a technologically advanced video as a service is growing to enhance work efficiency and reduce infrastructure costs of business operations, which supports the growth of the video as a service market. Moreover, the rising demand for advanced technologies, including 5G, artificial intelligence (AI), augmented reality, virtual reality, and data analytics, is expected to create opportunities for the global video as a service market during the forecast period. Further, a few benefits of video as a service software, such as real-time visibility, simplified business operations, and engaging customer communication, propel the global video as a service market growth.
Video as a Service Market Overview
Video as a service (VaaS), also known as “video conferencing-as-a-service (VCaaS),” is a hosted service that allows customers to use a provider’s infrastructure for making video calls. Video call communication takes place between two individuals or more than two people and devices (multipoint) in different locations (point-to-point). The service is typically hosted in the cloud, which eliminates the need for downloading an application to use the service. VaaS allows end-user organizations to focus on their core functions by reducing the time and effort required to build and maintain their video conferencing infrastructure. This cloud-based service offers significant benefits to the users, including scalability, access to technical support, lower investment costs, and reduced need for in-house specialists, which increases the adoption among industries. Also, cost-saving benefits associated with VaaS services boost the video as a service market growth.
Customize Research To Suit Your Requirement
We can optimize and tailor the analysis and scope which is unmet through our standard offerings. This flexibility will help you gain the exact information needed for your business planning and decision making.
Video as a Service Market: Strategic Insights
Market Size Value in US$ 4.02 billion in 2022 Market Size Value by US$ 15.47 billion by 2030 Growth rate CAGR of 18.3% from 2022 to 2030 Forecast Period 2022-2030 Base Year 2022

Naveen
Have a question?
Naveen will walk you through a 15-minute call to present the report’s content and answer all queries if you have any.
 Speak to Analyst
Customize Research To Suit Your Requirement
We can optimize and tailor the analysis and scope which is unmet through our standard offerings. This flexibility will help you gain the exact information needed for your business planning and decision making.
Video as a Service Market: Strategic Insights
| Market Size Value in | US$ 4.02 billion in 2022 |
| Market Size Value by | US$ 15.47 billion by 2030 |
| Growth rate | CAGR of 18.3% from 2022 to 2030 |
| Forecast Period | 2022-2030 |
| Base Year | 2022 |
Naveen
Have a question?
Naveen will walk you through a 15-minute call to present the report’s content and answer all queries if you have any.
Speak to Analyst
Video as a Service Market Drivers and Opportunities
Growing Demand for Video-Based Communications among Consumers to Favor the Market
Video conferencing and communication services have grown consistently in recent years. The increasing globalization of companies and the growing need for cost-effective and scalable communication solutions among consumers drive demand for video as a service software. WebinarCare data of September 2023 shows that more than 76% of individuals use video calls to work remotely. This allows employees to deliver productivity in their work by maintaining a better work-life balance. The growing use of video calls raises the demand for video as a service among consumers. Video as a service has many features, such as screen sharing, calendar scheduling, file sharing, cross-platform messaging, password protection, meeting recordings, waiting rooms, meeting reminders, and contact channels. These features support users to handle and manage daily business activities by increasing overall operational productivity and maintaining data privacy, which is fueling the demand for video as a service solution.
According to Quixy, the demand for virtual meetings grew from 48% to 77% between 2022 and 2022, which increases the demand for video as a service among consumers to streamline the collaboration between employees. This service supports individuals to increase their focus on projects or tasks assigned by their superiors. Video as a service also helps the user to effectively work and conduct a brief discussion over a video call. A rise in virtual meeting activities increases the demand for video as a service among consumers to maintain a smooth flow in their daily activities.
Rising Applications in the Healthcare Industry
VaaS has had a significant impact on the healthcare business. VaaS enables hospitals to remotely monitor patients, which is critical, especially for individuals who reside distant from healthcare facilities or after accidents in remote locations. The renal department at Lancashire Teaching Hospital in the United Kingdom, for example, uses VaaS to connect patients with nurses and physicians. Such video contact allows healthcare personnel to ensure that patients are following the proper protocols during home dialysis.
Video as a Service Market Report Segmentation Analysis
Key segments that contributed to the derivation of the video as a service market analysis are component, application, and end-user industry.
- Based on deployment mode, the video as a service market is divided into public cloud, private cloud, and hybrid cloud. The public cloud components segment held the largest share in 2022.
- Based on the industry vertical, the market is divided into IT & telecom, healthcare & life sciences, retail & e-commerce, BFSI, education, media & entertainment, government & public sector, and others.
Video as a Service Market Share Analysis by Geography
The geographic scope of the video as a service market report is mainly divided into five regions: North America, Asia Pacific, Europe, Middle East & Africa, and South & Central America.
North America dominated the Video as a Service market share in 2022. The region contributes a noteworthy share to the global video as a service market owing to high adoption and investments in cloud technology and a growing number of industries in the region. Video as a service allows organizations to conduct remote video meetings by fostering collaboration among partners and team members from different locations. The video as a service market in North America is anticipated to expand in the future owing to the presence of a large number of well-established players such as Cisco Systems, Inc.; Zoom Video Communications, Inc.; Microsoft; Google; Adobe; and others. The market players continuously develop and expand their service portfolio to attract new customers. In October 2023, Zoom Video Communications, Inc. partnered with Swoogo to modernize hybrid events by bringing larger and more engaged audiences. Through this partnership, both companies are integrating their technology into a virtual platform that focuses on engagement and high-quality production and scale. The integration can support customers to use Zoom Events or Swoogo for sharing video data between platforms and is expected to be commercially available in early 2024. Market players operating in the region are raising awareness about the benefits provided by video as a service to SMEs, which fuels the video as a service market growth in the region. Moreover, the growing adoption of video conferencing and other cloud-based communication services drives the video as a service market in North America. In addition, the demand for high-quality internet and continuous access to visual meetings among organizations contributes to the regional growth of video as a service market.
Video as a Service Market Report Scope
Video as a Service Market News and Recent Developments
The video as a service market is evaluated by gathering qualitative and quantitative data post primary and secondary research, which includes important corporate publications, association data, and databases. A few of the developments in the video as a service market are listed below:
- Sony Electronics Inc. announced that Zoom Video Communications Inc. will be coming to BRAVIA TVs, compatible with BRAVIA CAM1. This partnership will allow users to easily connect with family, friends, and colleagues through video calls and meetings from the comfort of their living room. Sony's BRAVIA is the first TV brand to support the Zoom for TV app on Google Play Store. (Source: Sony Electronics Inc., Press Release, June 2023)
- Adobe introduced the industry-first innovation Premiere Pro to its family of video applications, and Premiere Pro involves AI-powered text-based video editing and automated color tone-mapping capabilities with GPU acceleration and dozens of workflow enhancements that make it the fastest version of Premiere Pro ever released. The company also celebrating 30 years of After Effects, the world’s most popular motion design software for video professionals, with consistent color support, adding a context-sensitive Properties Panel for enhanced user productivity and performance optimizations. (Source: Adobe, Press Release, April 2023)
Video as a Service Market Report Coverage and Deliverables
The “Video as a Service Market Size and Forecast (2020–2030)” report provides a detailed analysis of the market covering below areas:
- Video as a service market size and forecast at global, regional, and country levels for all the key market segments covered under the scope
- Video as a service market trends, as well as market dynamics such as drivers, restraints, and key opportunities
- Detailed PEST/Porter’s Five Forces and SWOT analysis
- Video as a service market analysis covering key market trends, global and regional framework, major players, regulations, and recent market developments
- Industry landscape and competition analysis covering market concentration, heat map analysis, prominent players, and recent developments for the video as a service market
- Detailed company profiles

Report Coverage
Revenue forecast, Company Analysis, Industry landscape, Growth factors, and Trends

Segment Covered
Deployment Mode, and Industry Vertical

Regional Scope
North America, Europe, Asia Pacific, Middle East & Africa, South & Central America

Country Scope
This text is related
to country scope.
Frequently Asked Questions
The video as a service market size is projected to reach US$ 15.47 billion by 2030
The video as a service market is expected to register a CAGR of 18.3% during 2022–2030
Enhanced security and growth in live streaming are likely to remain key trends in the market.
Cisco Systems Inc, Zoom Video Communications Inc, Microsoft Corp, Amazon Web Services Inc, Avaya Holdings Corp, Google LLC, Adobe Inc, RingCentral Inc, Dekom AG, and BlueJeans are among the leading payers operating in the video as a service market.
North America dominated the video as a service market in 2022.
Advancements in mobile and internet technology and growing demand for video-based communications among consumers are expected to drive the video as a service market.
1. Introduction
1.1 The Insight Partners Research Report Guidance
1.2 Market Segmentation
2. Executive Summary
2.1 Key Insights
2.2 Market Attractiveness
3. Research Methodology
3.1 Coverage
3.2 Secondary Research
3.3 Primary Research
4. Video as a Service Market Landscape
4.1 Overview
4.2 PEST Analysis
4.3 Ecosystem Analysis
4.3.1 List of Vendors in Value Chain:
5. Video as a Service Market - Key Industry Dynamics
5.1 Drivers
5.1.1 Growing Demand for Video-based Communications among Consumers
5.1.2 Increasing Adoption of Remote Working Model
5.1.3 Rising Use of Video Conferencing Services in the Healthcare Industry
5.2 Market Restraints
5.2.1 Growing Data Privacy and Security Concerns
5.3 Market Opportunities
5.3.1 Integration of Artificial Intelligence to Revolutionize Video as a Service Market
5.4 Future Trends
5.4.1 Growing Video Marketing and Selling Trends
5.5 Impact of Drivers and Restraints:
6. Video as a Service Market - Global Market Analysis
6.1 Video as a Service Market Overview
6.2 Video as a Service Market Revenue (US$ Million), 2022 – 2030
6.3 Video as a Service Market Forecast and Analysis
7. Video as a Service Market Analysis – Deployment Mode
7.1 Public Cloud
7.1.1 Overview
7.1.2 Public Cloud Market Revenue and Forecasts To 2030 (US$ Million)
7.2 Private Cloud
7.2.1 Overview
7.2.2 Private Cloud Market Revenue and Forecasts To 2030 (US$ Million)
7.3 Hybrid Cloud
7.3.1 Overview
7.3.2 Hybrid Cloud Market Revenue and Forecasts To 2030 (US$ Million)
8. Video as a Service Market Analysis – Industry Vertical
8.1 IT & Telecom
8.1.1 Overview
8.1.2 IT & Telecom Market Revenue and Forecasts To 2030 (US$ Million)
8.2 Healthcare & Life Sciences
8.2.1 Overview
8.2.2 Healthcare & Life Sciences Market Revenue and Forecasts To 2030 (US$ Million)
8.3 Retail & E-Commerce
8.3.1 Overview
8.3.2 Retail & E-Commerce Market Revenue and Forecasts To 2030 (US$ Million)
8.4 BFSI
8.4.1 Overview
8.4.2 BFSI Market Revenue and Forecasts To 2030 (US$ Million)
8.5 Education
8.5.1 Overview
8.5.2 Education Market Revenue and Forecasts To 2030 (US$ Million)
8.6 Media & Entertainment
8.6.1 Overview
8.6.2 Media & Entertainment Market Revenue and Forecasts To 2030 (US$ Million)
8.7 Government & Public Sector
8.7.1 Overview
8.7.2 Government & Public Sector Market Revenue and Forecasts To 2030 (US$ Million)
8.8 Others
8.8.1 Overview
8.8.2 Others Market Revenue and Forecasts To 2030 (US$ Million)
9. Video as a Service Market - Geographical Analysis
9.1 North America
9.1.1 North America Video as a Service Market Overview
9.1.2 North America Video as a Service Market Revenue and Forecasts to 2030 (US$ Mn)
9.1.3 North America Video as a Service Market Breakdown by Deployment Mode
9.1.3.1 North America Video as a Service Market Revenue and Forecasts To 2030 (US$ Mn) – By Deployment Mode
9.1.4 North America Video as a Service Market Breakdown by Industry Vertical
9.1.4.1 North America Video as a Service Market Revenue and Forecasts To 2030 (US$ Mn) – By Industry Vertical
9.1.5 North America Video as a Service Market Revenue and Forecasts and Analysis - By Countries
9.1.5.1 US Video as a Service Market Revenue and Forecasts to 2030 (US$ Mn)
9.1.5.1.1 US Video as a Service Market Breakdown by Deployment Mode
9.1.5.1.2 US Video as a Service Market Breakdown by Industry Vertical
9.1.5.2 Canada Video as a Service Market Revenue and Forecasts to 2030 (US$ Mn)
9.1.5.2.1 Canada Video as a Service Market Breakdown by Deployment Mode
9.1.5.2.2 Canada Video as a Service Market Breakdown by Industry Vertical
9.1.5.3 Mexico Video as a Service Market Revenue and Forecasts to 2030 (US$ Mn)
9.1.5.3.1 Mexico Video as a Service Market Breakdown by Deployment Mode
9.1.5.3.2 Mexico Video as a Service Market Breakdown by Industry Vertical
9.2 Europe
9.2.1 Europe Video as a Service Market Overview
9.2.2 Europe Video as a Service Market Revenue and Forecasts to 2030 (US$ Mn)
9.2.3 Europe Video as a Service Market Breakdown by Deployment Mode
9.2.3.1 Europe Video as a Service Market Revenue and Forecasts and Analysis - By Deployment Mode
9.2.4 Europe Video as a Service Market Breakdown by Industry Vertical
9.2.4.1 Europe Video as a Service Market Revenue and Forecasts and Analysis - By Industry Vertical
9.2.5 Europe Video as a Service Market Revenue and Forecasts and Analysis - By Countries
9.2.5.1 Germany Video as a Service Market Revenue and Forecasts to 2030 (US$ Mn)
9.2.5.1.1 Germany Video as a Service Market Breakdown by Deployment Mode
9.2.5.1.2 Germany Video as a Service Market Breakdown by Industry Vertical
9.2.5.2 France Video as a Service Market Revenue and Forecasts to 2030 (US$ Mn)
9.2.5.2.1 France Video as a Service Market Breakdown by Deployment Mode
9.2.5.2.2 France Video as a Service Market Breakdown by Industry Vertical
9.2.5.3 Italy Video as a Service Market Revenue and Forecasts to 2030 (US$ Mn)
9.2.5.3.1 Italy Video as a Service Market Breakdown by Deployment Mode
9.2.5.3.2 Italy Video as a Service Market Breakdown by Industry Vertical
9.2.5.4 UK Video as a Service Market Revenue and Forecasts to 2030 (US$ Mn)
9.2.5.4.1 UK Video as a Service Market Breakdown by Deployment Mode
9.2.5.4.2 UK Video as a Service Market Breakdown by Industry Vertical
9.2.5.5 Russia Video as a Service Market Revenue and Forecasts to 2030 (US$ Mn)
9.2.5.5.1 Russia Video as a Service Market Breakdown by Deployment Mode
9.2.5.5.2 Russia Video as a Service Market Breakdown by Industry Vertical
9.2.5.6 Rest of Europe Video as a Service Market Revenue and Forecasts to 2030 (US$ Mn)
9.2.5.6.1 Rest of Europe Video as a Service Market Breakdown by Deployment Mode
9.2.5.6.2 Rest of Europe Video as a Service Market Breakdown by Industry Vertical
9.3 Asia Pacific Video as a Service Market
9.3.1 Overview
9.3.2 Asia Pacific Video as a Service Market Revenue and Forecasts To 2030 (US$ Million)
9.3.3 Asia Pacific Video as a Service Market Breakdown by Deployment Mode
9.3.3.1 Asia Pacific Video as a Service Market Revenue and Forecasts and Analysis - By Deployment Mode
9.3.4 Asia Pacific Video as a Service Market Breakdown by Industry Vertical
9.3.4.1 Asia Pacific Video as a Service Market Revenue and Forecasts and Analysis - By Industry Vertical
9.3.5 Video as a service market Breakdown by Countries
9.3.5.1 Australia Video as a Service Market Revenue and Forecasts to 2030 (US$ Mn)
9.3.5.1.1 Australia Video as a Service Market Breakdown by Deployment Mode
9.3.5.1.2 Australia Video as a Service Market Breakdown by Industry Vertical
9.3.5.2 China Video as a Service Market Revenue and Forecasts to 2030 (US$ Mn)
9.3.5.2.1 China Video as a Service Market Breakdown by Deployment Mode
9.3.5.2.2 China Video as a Service Market Breakdown by Industry Vertical
9.3.5.4 Japan Video as a Service Market Revenue and Forecasts to 2030 (US$ Mn)
9.3.5.4.1 Japan Video as a Service Market Breakdown by Deployment Mode
9.3.5.4.2 Japan Video as a Service Market Breakdown by Industry Vertical
9.3.5.5 India Video as a Service Market Revenue and Forecasts to 2030 (US$ Mn)
9.3.5.5.1 India Video as a Service Market Breakdown by Deployment Mode
9.3.5.5.2 India Video as a Service Market Breakdown by Industry Vertical
9.3.5.6 South Korea Video as a Service Market Revenue and Forecasts to 2030 (US$ Mn)
9.3.5.6.1 South Korea Video as a Service Market Breakdown by Deployment Mode
9.3.5.6.2 South Korea Video as a Service Market Breakdown by Industry Vertical
9.3.5.7 Rest of Asia Pacific Video as a Service Market Revenue and Forecasts to 2030 (US$ Mn)
9.3.5.7.1 Rest of Asia Pacific Video as a Service Market Breakdown by Deployment Mode
9.3.5.7.2 Rest of Asia Pacific Video as a Service Market Breakdown by Industry Vertical
9.4 Middle East & Africa
9.4.1 Middle East & Africa Video as a Service Market Overview
9.4.2 Middle East & Africa Video as a Service Market Revenue and Forecasts to 2030 (US$ Million)
9.4.3 Middle East & Africa Video as a Service Market Breakdown by Deployment Mode
9.4.3.1 Middle East & Africa Video as a Service Market and Forecasts and Analysis - By Deployment Mode
9.4.4 Middle East & Africa Video as a Service Market Breakdown by Industry Vertical
9.4.4.1 Middle East & Africa Video as a Service Market and Forecasts and Analysis - By Industry Vertical
9.4.5 Middle East & Africa Video as a Service Market Revenue and Forecasts and Analysis - By Countries
9.4.5.1 South Africa Video as a Service Market Revenue and Forecasts to 2030 (US$ Mn)
9.4.5.1.1 South Africa Video as a Service Market Breakdown by Deployment Mode
9.4.5.1.2 South Africa Video as a Service Market Breakdown by Industry Vertical
9.4.5.2 Saudi Arabia Video as a Service Market Revenue and Forecasts to 2030 (US$ Mn)
9.4.5.2.1 Saudi Arabia Video as a Service Market Breakdown by Deployment Mode
9.4.5.2.2 Saudi Arabia Video as a Service Market Breakdown by Industry Vertical
9.4.5.3 UAE Video as a Service Market Revenue and Forecasts to 2030 (US$ Mn)
9.4.5.3.1 UAE Video as a Service Market Breakdown by Deployment Mode
9.4.5.3.2 UAE Video as a Service Market Breakdown by Industry Vertical
9.4.5.4 Rest of Middle East & Africa Video as a Service Market Revenue and Forecasts to 2030 (US$ Mn)
9.4.5.4.1 Rest of Middle East & Africa Video as a Service Market Breakdown by Deployment Mode
9.4.5.4.2 Rest of Middle East & Africa Video as a Service Market Breakdown by Industry Vertical
9.5 South & Central America
9.5.1 South & Central America Video as a Service Market Overview
9.5.2 South & Central America Video as a Service Market Revenue and Forecasts to 2030 (US$ Million)
9.5.3 South & Central America Video as a Service Market Breakdown by Deployment Mode
9.5.3.1 South & Central America Video as a Service Market and Forecasts and Analysis - By Deployment Mode
9.5.4 South & Central America Video as a Service Market Breakdown by Industry Vertical
9.5.4.1 South & Central America Video as a Service Market Revenue and Forecasts and Analysis - By Industry Vertical
9.5.5 South & Central America Video as a Service Market Revenue and Forecasts and Analysis - By Countries
9.5.5.1 Brazil Video as a Service Market Revenue and Forecasts to 2030 (US$ Mn)
9.5.5.1.1 Brazil Video as a Service Market Breakdown by Deployment Mode
9.5.5.1.2 Brazil Video as a Service Market Breakdown by Industry Vertical
9.5.5.2 Argentina Video as a Service Market Revenue and Forecasts to 2030 (US$ Mn)
9.5.5.2.1 Argentina Video as a Service Market Breakdown by Deployment Mode
9.5.5.2.2 Argentina Video as a Service Market Breakdown by Industry Vertical
9.5.5.3 Rest of South & Central America Video as a Service Market Revenue and Forecasts to 2030 (US$ Mn)
9.5.5.3.1 Rest of South & Central America Video as a Service Market Breakdown by Deployment Mode
9.5.5.3.2 Rest of South & Central America Video as a Service Market Breakdown by Industry Vertical
10. Video as a Service Market – Impact of COVID-19 Pandemic
10.1 Pre & Post Covid-19 Impact
11. Competitive Landscape
11.1 Heat Map Analysis By Key Players
11.2 Company Positioning & Concentration
12. Industry Landscape
13. Company Profiles
14. Appendix
14.1 Word Index
List of Tables
Table 1. Video as a Service Market Segmentation
Table 2. Video as a Service Market Revenue and Forecasts To 2030 (US$ Million)
Table 3. Video as a Service Market Revenue and Forecasts To 2030 (US$ Million) – Deployment Mode
Table 4. Video as a Service Market Revenue and Forecasts To 2030 (US$ Million) – Industry Vertical
Table 5. North America Video as a Service Market Revenue and Forecasts To 2030 (US$ Mn) – By Deployment Mode
Table 6. North America Video as a Service Market Revenue and Forecasts To 2030 (US$ Mn) – By Industry Vertical
Table 7. North America Video as a Service Market, by Country – Revenue and Forecast to 2030 (USD Million)
Table 8. US Video as a Service Market Revenue and Forecasts To 2030 (US$ Mn) – By Deployment Mode
Table 9. US Video as a Service Market Revenue and Forecasts To 2030 (US$ Mn) – By Industry Vertical
Table 10. Canada Video as a Service Market Revenue and Forecasts To 2030 (US$ Mn) – By Deployment Mode
Table 11. Canada Video as a Service Market Revenue and Forecasts To 2030 (US$ Mn) – By Industry Vertical
Table 12. Mexico Video as a Service Market Revenue and Forecasts To 2030 (US$ Mn) – By Deployment Mode
Table 13. Mexico Video as a Service Market Revenue and Forecasts To 2030 (US$ Mn) – By Industry Vertical
Table 14. Europe Video as a Service Market Revenue and Forecasts To 2030 (US$ Mn) – By Deployment Mode
Table 15. Europe Video as a Service Market Revenue and Forecasts To 2030 (US$ Mn) – By Industry Vertical
Table 16. Europe Video as a Service Market, by Country – Revenue and Forecast to 2030 (USD Million)
Table 17. Germany Video as a Service Market Revenue and Forecasts To 2030 (US$ Mn) – By Deployment Mode
Table 18. Germany Video as a Service Market Revenue and Forecasts To 2030 (US$ Mn) – By Industry Vertical
Table 19. France Video as a Service Market Revenue and Forecasts To 2030 (US$ Mn) – By Deployment Mode
Table 20. France Video as a Service Market Revenue and Forecasts To 2030 (US$ Mn) – By Industry Vertical
Table 21. Italy Video as a Service Market Revenue and Forecasts To 2030 (US$ Mn) – By Deployment Mode
Table 22. Italy Video as a Service Market Revenue and Forecasts To 2030 (US$ Mn) – By Industry Vertical
Table 23. UK Video as a Service Market Revenue and Forecasts To 2030 (US$ Mn) – By Deployment Mode
Table 24. UK Video as a Service Market Revenue and Forecasts To 2030 (US$ Mn) – By Industry Vertical
Table 25. Russia Video as a Service Market Revenue and Forecasts To 2030 (US$ Mn) – By Deployment Mode
Table 26. Russia Video as a Service Market Revenue and Forecasts To 2030 (US$ Mn) – By Industry Vertical
Table 27. Rest of Europe Video as a Service Market Revenue and Forecasts To 2030 (US$ Mn) – By Deployment Mode
Table 28. Rest of Europe Video as a Service Market Revenue and Forecasts To 2030 (US$ Mn) – By Industry Vertical
Table 29. Asia Pacific Video as a Service Market Revenue And Forecasts To 2030 (US$ Million) – Deployment Mode
Table 30. Asia Pacific Video as a Service Market Revenue And Forecasts To 2030 (US$ Million) – Industry Vertical
Table 31. Asia Pacific Video as a Service Market, by Country – Revenue and Forecast to 2030 (USD Million)
Table 32. Australia Video as a Service Market Revenue and Forecasts To 2030 (US$ Mn) – By Deployment Mode
Table 33. Australia Video as a Service Market Revenue and Forecasts To 2030 (US$ Mn) – By Industry Vertical
Table 34. China Video as a Service Market Revenue and Forecasts To 2030 (US$ Mn) – By Deployment Mode
Table 35. China Video as a Service Market Revenue and Forecasts To 2030 (US$ Mn) – By Industry Vertical
Table 36. Japan Video as a Service Market Revenue and Forecasts To 2030 (US$ Mn) – By Deployment Mode
Table 37. Japan Video as a Service Market Revenue and Forecasts To 2030 (US$ Mn) – By Industry Vertical
Table 38. India Video as a Service Market Revenue and Forecasts To 2030 (US$ Mn) – By Deployment Mode
Table 39. India Video as a Service Market Revenue and Forecasts To 2030 (US$ Mn) – By Industry Vertical
Table 40. South Korea Video as a Service Market Revenue and Forecasts To 2030 (US$ Mn) – By Deployment Mode
Table 41. South Korea Video as a Service Market Revenue and Forecasts To 2030 (US$ Mn) – By Industry Vertical
Table 42. Rest of Asia Pacific Video as a Service Market Revenue and Forecasts To 2030 (US$ Mn) – By Deployment Mode
Table 43. Rest of Asia Pacific Video as a Service Market Revenue and Forecasts To 2030 (US$ Mn) – By Industry Vertical
Table 44. Middle East & Africa Video as a Service Market Revenue and Forecasts To 2030 (US$ Million) – By Deployment Mode
Table 45. Middle East & Africa Video as a Service Market Revenue and Forecasts To 2030 (US$ Million) – By Industry Vertical
Table 46. Middle East and Africa Video as a Service Market, by Country – Revenue and Forecast to 2030 (USD Million)
Table 47. South Africa Video as a Service Market Revenue and Forecasts To 2030 (US$ Mn) – By Deployment Mode
Table 48. South Africa Video as a Service Market Revenue and Forecasts To 2030 (US$ Mn) – By Industry Vertical
Table 49. Saudi Arabia Video as a Service Market Revenue and Forecasts To 2030 (US$ Mn) – By Deployment Mode
Table 50. Saudi Arabia Video as a Service Market Revenue and Forecasts To 2030 (US$ Mn) – By Industry Vertical
Table 51. UAE Video as a Service Market Revenue and Forecasts To 2030 (US$ Mn) – By Deployment Mode
Table 52. UAE Video as a Service Market Revenue and Forecasts To 2030 (US$ Mn) – By Industry Vertical
Table 53. Rest of Middle East & Africa Video as a Service Market Revenue and Forecasts To 2030 (US$ Mn) – By Deployment Mode
Table 54. Rest of Middle East & Africa Video as a Service Market Revenue and Forecasts To 2030 (US$ Mn) – By Industry Vertical
Table 55. South & Central America Video as a Service Market Revenue and Forecasts To 2030 (US$ Million) – By Deployment Mode
Table 56. South & Central America Video as a Service Market Revenue and Forecasts To 2030 (US$ Million) – By Industry Vertical
Table 57. South and Central America Video as a Service Market, by Country – Revenue and Forecast to 2030 (USD Million)
Table 58. Brazil Video as a Service Market Revenue and Forecasts To 2030 (US$ Mn) – By Deployment Mode
Table 59. Brazil Video as a Service Market Revenue and Forecasts To 2030 (US$ Mn) – By Industry Vertical
Table 60. Argentina Video as a Service Market Revenue and Forecasts To 2030 (US$ Mn) – By Deployment Mode
Table 61. Argentina Video as a Service Market Revenue and Forecasts To 2030 (US$ Mn) – By Industry Vertical
Table 62. Rest of South & Central America Video as a Service Market Revenue and Forecasts To 2030 (US$ Mn) – By Deployment Mode
Table 63. Rest of South & Central America Video as a Service Market Revenue and Forecasts To 2030 (US$ Mn) – By Industry Vertical
Table 64. Company Positioning & Concentration
Table 65. List of Abbreviation
List of Figures
Figure 1. Video as a Service Market Segmentation, By Geography
Figure 2. Global– PEST Analysis
Figure 3. Ecosystem: Video as a Service Market
Figure 4. Video as a Service Market - Key Industry Dynamics
Figure 5. Impact Analysis of Drivers and Restraints
Figure 6. 6.2 Video as a Service Market Breakdown by Geography, 2022 and 2030 (%)
Figure 7. Video as a Service Market Revenue (US$ Million), 2022 & 2030
Figure 8. Video as a Service Market Share (%) – Deployment Mode, 2022 and 2030
Figure 9. Public Cloud Market Revenue and Forecasts To 2030 (US$ Million)
Figure 10. Private Cloud Market Revenue and Forecasts To 2030 (US$ Million)
Figure 11. Hybrid Cloud Market Revenue and Forecasts To 2030 (US$ Million)
Figure 12. Video as a Service Market Share (%) – Industry Vertical, 2022 and 2030
Figure 13. IT & Telecom Market Revenue and Forecasts To 2030 (US$ Million)
Figure 14. Healthcare & Life Sciences Market Revenue and Forecasts To 2030 (US$ Million)
Figure 15. Retail & E-Commerce Market Revenue and Forecasts To 2030 (US$ Million)
Figure 16. BFSI Market Revenue and Forecasts To 2030 (US$ Million)
Figure 17. Education Market Revenue and Forecasts To 2030 (US$ Million)
Figure 18. Media & Entertainment Market Revenue and Forecasts To 2030 (US$ Million)
Figure 19. Government & Public Sector Market Revenue and Forecasts To 2030 (US$ Million)
Figure 20. Others Market Revenue and Forecasts To 2030 (US$ Million)
Figure 21. Video as a Service Market Revenue Share, By Region (2022 & 2030)
Figure 22. Video as a Service Market Revenue and Forecasts To 2030 (US$ Mn)
Figure 23. Video as a Service Market Breakdown by Deployment Mode (2022 and 2030)
Figure 24. Video as a service market Breakdown by Industry Vertical, 2022 and 2030 (%)
Figure 25. Video as a service market Breakdown by Key Countries, 2022 and 2030 (%)
Figure 26. US Video as a Service Market Revenue and Forecasts To 2030 (US$ Mn)
Figure 27. Canada Video as a Service Market Revenue and Forecasts To 2030 (US$ Mn)
Figure 28. Mexico Video as a Service Market Revenue and Forecasts To 2030 (US$ Mn)
Figure 29. Video as a Service Market Revenue and Forecasts To 2030 (US$ Mn)
Figure 30. Video as a Service Market Breakdown by Deployment Mode (2022 and 2030)
Figure 31. Video as a Service Market Breakdown by Industry Vertical (2022 and 2030)
Figure 32. Video as a service market Breakdown by Key Countries, 2022 and 2030 (%)
Figure 33. Germany Video as a Service Market Revenue and Forecasts To 2030 (US$ Mn)
Figure 34. France Video as a Service Market Revenue and Forecasts To 2030 (US$ Mn)
Figure 35. Italy Video as a Service Market Revenue and Forecasts To 2030 (US$ Mn)
Figure 36. UK Video as a Service Market Revenue and Forecasts To 2030 (US$ Mn)
Figure 37. Russia Video as a Service Market Revenue and Forecasts To 2030 (US$ Mn)
Figure 38. Rest of Europe Video as a Service Market Revenue and Forecasts To 2030 (US$ Mn)
Figure 39. Asia Pacific Video as a Service Market Revenue And Forecasts To 2030 (US$ Million)
Figure 40. Asia Pacific Video as a Service Market Breakdown by Deployment Mode (2022 and 2023)
Figure 41. Asia Pacific Video as a Service Market Breakdown by Industry Vertical (2022 and 2023)
Figure 42. Asia Pacific Video as a Service Market Breakdown By Key Countries, 2022 And 2030 (%)
Figure 43. Australia Video as a Service Market Revenue and Forecasts To 2030 (US$ Mn)
Figure 44. China Video as a Service Market Revenue and Forecasts To 2030 (US$ Mn)
Figure 45. Japan Video as a Service Market Revenue and Forecasts To 2030 (US$ Mn)
Figure 46. India Video as a Service Market Revenue and Forecasts To 2030 (US$ Mn)
Figure 47. South Korea Video as a Service Market Revenue and Forecasts To 2030 (US$ Mn)
Figure 48. Rest of Asia Pacific Video as a Service Market Revenue and Forecasts To 2030 (US$ Mn)
Figure 49. Video as a Service Market Revenue and Forecasts To 2030 (US$ Million)
Figure 50. Middle East & Africa Video as a Service Market Breakdown by Deployment Mode (2022 and 2023)
Figure 51. Middle East & Africa Video as a Service Market Breakdown by Industry Vertical (2022 and 2023)
Figure 52. Video as a Service Market Breakdown by Key Countries, 2022 and 2030 (%)
Figure 53. South Africa Video as a Service Market Revenue and Forecasts To 2030 (US$ Mn)
Figure 54. Saudi Arabia Video as a Service Market Revenue and Forecasts To 2030 (US$ Mn)
Figure 55. UAE Video as a Service Market Revenue and Forecasts To 2030 (US$ Mn)
Figure 56. Rest of Middle East & Africa Video as a Service Market Revenue and Forecasts To 2030 (US$ Mn)
Figure 57. Video as a Service Market Revenue and Forecasts To 2030 (US$ Million)
Figure 58. South & Central America Video as a Service Market Breakdown by Deployment Mode (2022 and 2023)
Figure 59. South & Central America Video as a Service Market Breakdown by Industry Vertical (2022 and 2023)
Figure 60. Video as a Service Market Breakdown by Key Countries, 2022 and 2030 (%)
Figure 61. Brazil Video as a Service Market Revenue and Forecasts To 2030 (US$ Mn)
Figure 62. Argentina Video as a Service Market Revenue and Forecasts To 2030 (US$ Mn)
Figure 63. Rest of South & Central America Video as a Service Market Revenue and Forecasts To 2030 (US$ Mn)
Figure 64. Heat Map Analysis By Key Players
The List of Companies – Video as a Service Market
- Cisco Systems, Inc.
- Zoom Video Communications, Inc.
- Microsoft Corp
- Amazon Web Services Inc.
- BlueJeans by Verizon
- Avaya Holdings Corp
- Google LLC.
- RingCentral Inc.
- Adobe Inc.
- DEKOM AG
The Insight Partners performs research in 4 major stages: Data Collection & Secondary Research, Primary Research, Data Analysis and Data Triangulation & Final Review.
- Data Collection and Secondary Research:
As a market research and consulting firm operating from a decade, we have published many reports and advised several clients across the globe. First step for any study will start with an assessment of currently available data and insights from existing reports. Further, historical and current market information is collected from Investor Presentations, Annual Reports, SEC Filings, etc., and other information related to company’s performance and market positioning are gathered from Paid Databases (Factiva, Hoovers, and Reuters) and various other publications available in public domain.
Several associations trade associates, technical forums, institutes, societies and organizations are accessed to gain technical as well as market related insights through their publications such as research papers, blogs and press releases related to the studies are referred to get cues about the market. Further, white papers, journals, magazines, and other news articles published in the last 3 years are scrutinized and analyzed to understand the current market trends.
- Primary Research:
The primarily interview analysis comprise of data obtained from industry participants interview and answers to survey questions gathered by in-house primary team.
For primary research, interviews are conducted with industry experts/CEOs/Marketing Managers/Sales Managers/VPs/Subject Matter Experts from both demand and supply side to get a 360-degree view of the market. The primary team conducts several interviews based on the complexity of the markets to understand the various market trends and dynamics which makes research more credible and precise.
A typical research interview fulfils the following functions:
- Provides first-hand information on the market size, market trends, growth trends, competitive landscape, and outlook
- Validates and strengthens in-house secondary research findings
- Develops the analysis team’s expertise and market understanding
Primary research involves email interactions and telephone interviews for each market, category, segment, and sub-segment across geographies. The participants who typically take part in such a process include, but are not limited to:
- Industry participants: VPs, business development managers, market intelligence managers and national sales managers
- Outside experts: Valuation experts, research analysts and key opinion leaders specializing in the electronics and semiconductor industry.
Below is the breakup of our primary respondents by company, designation, and region:

Once we receive the confirmation from primary research sources or primary respondents, we finalize the base year market estimation and forecast the data as per the macroeconomic and microeconomic factors assessed during data collection.
- Data Analysis:
Once data is validated through both secondary as well as primary respondents, we finalize the market estimations by hypothesis formulation and factor analysis at regional and country level.
- 3.1 Macro-Economic Factor Analysis:
We analyse macroeconomic indicators such the gross domestic product (GDP), increase in the demand for goods and services across industries, technological advancement, regional economic growth, governmental policies, the influence of COVID-19, PEST analysis, and other aspects. This analysis aids in setting benchmarks for various nations/regions and approximating market splits. Additionally, the general trend of the aforementioned components aid in determining the market's development possibilities.
- 3.2 Country Level Data:
Various factors that are especially aligned to the country are taken into account to determine the market size for a certain area and country, including the presence of vendors, such as headquarters and offices, the country's GDP, demand patterns, and industry growth. To comprehend the market dynamics for the nation, a number of growth variables, inhibitors, application areas, and current market trends are researched. The aforementioned elements aid in determining the country's overall market's growth potential.
- 3.3 Company Profile:
The “Table of Contents” is formulated by listing and analyzing more than 25 - 30 companies operating in the market ecosystem across geographies. However, we profile only 10 companies as a standard practice in our syndicate reports. These 10 companies comprise leading, emerging, and regional players. Nonetheless, our analysis is not restricted to the 10 listed companies, we also analyze other companies present in the market to develop a holistic view and understand the prevailing trends. The “Company Profiles” section in the report covers key facts, business description, products & services, financial information, SWOT analysis, and key developments. The financial information presented is extracted from the annual reports and official documents of the publicly listed companies. Upon collecting the information for the sections of respective companies, we verify them via various primary sources and then compile the data in respective company profiles. The company level information helps us in deriving the base number as well as in forecasting the market size.
- 3.4 Developing Base Number:
Aggregation of sales statistics (2020-2022) and macro-economic factor, and other secondary and primary research insights are utilized to arrive at base number and related market shares for 2022. The data gaps are identified in this step and relevant market data is analyzed, collected from paid primary interviews or databases. On finalizing the base year market size, forecasts are developed on the basis of macro-economic, industry and market growth factors and company level analysis.
- Data Triangulation and Final Review:
The market findings and base year market size calculations are validated from supply as well as demand side. Demand side validations are based on macro-economic factor analysis and benchmarks for respective regions and countries. In case of supply side validations, revenues of major companies are estimated (in case not available) based on industry benchmark, approximate number of employees, product portfolio, and primary interviews revenues are gathered. Further revenue from target product/service segment is assessed to avoid overshooting of market statistics. In case of heavy deviations between supply and demand side values, all thes steps are repeated to achieve synchronization.
We follow an iterative model, wherein we share our research findings with Subject Matter Experts (SME’s) and Key Opinion Leaders (KOLs) until consensus view of the market is not formulated – this model negates any drastic deviation in the opinions of experts. Only validated and universally acceptable research findings are quoted in our reports.
We have important check points that we use to validate our research findings – which we call – data triangulation, where we validate the information, we generate from secondary sources with primary interviews and then we re-validate with our internal data bases and Subject matter experts. This comprehensive model enables us to deliver high quality, reliable data in shortest possible time.
 Get Free Sample For