The water softeners market size is projected to reach US$ 10.94 billion by 2031 from US$ 6.18 billion in 2023. The market is expected to register a CAGR of 7.4% in 2023–2031. The Increasing awareness regarding the harmful effects of hard water is likely to remain a key water softeners market trend.
Water Softeners Market Analysis
The water softeners market has witnessed significant growth in recent years, driven by increasing awareness about the detrimental effects of hard water on plumbing systems, appliances, and overall water quality. Hard water with high levels of calcium, magnesium, and other minerals poses challenges such as scale buildup and soap scum formation, lowering the efficiency of water heaters and washing machines. As a result, residential, commercial, and institutional consumers are increasingly adopting water-softening systems to overcome these issues.
Water Softeners Market Overview
Water softeners are gaining significant popularity due to their ability to remove minerals such as calcium and magnesium from water, preventing scale buildup and improving water quality. Urbanization, industrialization, the need for clean water, rising disposable income, and changing consumer preferences are among the major factors contributing to the water softeners market growth. Government regulations promoting water softeners to reduce water wastage also contribute to market expansion. Salt-based water softeners are the most widely used type. Among all major regions, North America and Europe lead the market due to high hard water prevalence.
Customize Research To Suit Your Requirement
We can optimize and tailor the analysis and scope which is unmet through our standard offerings. This flexibility will help you gain the exact information needed for your business planning and decision making.
Water Softeners Market: Strategic Insights
Market Size Value in US$ 10,255.17 Million in 2021 Market Size Value by US$ 13,558.77 Million by 2028 Growth rate CAGR of 4.1% from 2021-2028 Forecast Period 2021-2028 Base Year 2021

Shejal
Have a question?
Shejal will walk you through a 15-minute call to present the report’s content and answer all queries if you have any.
 Speak to Analyst
Customize Research To Suit Your Requirement
We can optimize and tailor the analysis and scope which is unmet through our standard offerings. This flexibility will help you gain the exact information needed for your business planning and decision making.
Water Softeners Market: Strategic Insights
| Market Size Value in | US$ 10,255.17 Million in 2021 |
| Market Size Value by | US$ 13,558.77 Million by 2028 |
| Growth rate | CAGR of 4.1% from 2021-2028 |
| Forecast Period | 2021-2028 |
| Base Year | 2021 |
Shejal
Have a question?
Shejal will walk you through a 15-minute call to present the report’s content and answer all queries if you have any.
Speak to Analyst
Water Softeners Market Drivers and Opportunities
Increasing Awareness Regarding Harmful Effects of Hardwater Bolsters Market
Hard water can lead to the buildup of limescale deposits in plumbing and appliances, reducing their efficiency and lifespan. Water-softening solutions are adopted to protect various equipment, plumbing systems, and human health from the detrimental effects of hard water. Water-softening systems allow residential users to prolong the longevity of their household infrastructure. Hard water can leave skin feeling dry and hair brittle due to the residual mineral deposits left on skin and hair surfaces. As individuals seek to address these personal care concerns, the demand for water softeners has increased in the last few years. Additionally, the potential health benefits of reducing the consumption of hard water, particularly in relation to cardiovascular health, further underline the importance of water-softening systems in households.
Rising Adoption of Water Softeners in Emerging Economies Creates Significant Growth Opportunities
Urbanization and industrialization are prominent trends in countries such as India and China. As urban populations grow and industrial activities expand, the demand for water softeners has risen to address the challenges posed by hard water in residential and commercial settings. A survey conducted by KentRO in Bengaluru, India, stated that 24% of areas in the city receive hard water, which resulted in increased water-softening system installation in households and commercial sectors.
Water Softeners Market Report Segmentation Analysis
Key segments that contributed to the derivation of the water softeners market analysis are type, end use, and distribution channel.
- Based on type, the water softeners market is bifurcated into salt-based water softeners and salt-free water softeners. The salt-based water softeners segment held a larger market share in 2023.
- Based on end use, the water softeners market is segmented into residential, commercial (hotels and lodges, restaurants, offices, hospitals, and others), and institutional. The residential segment held the largest market share in 2023.
- Based on distribution channel, the water softeners market is bifurcated into direct and indirect. The direct segment held a larger market share in 2023.
Water Softeners Market Share Analysis by Geography
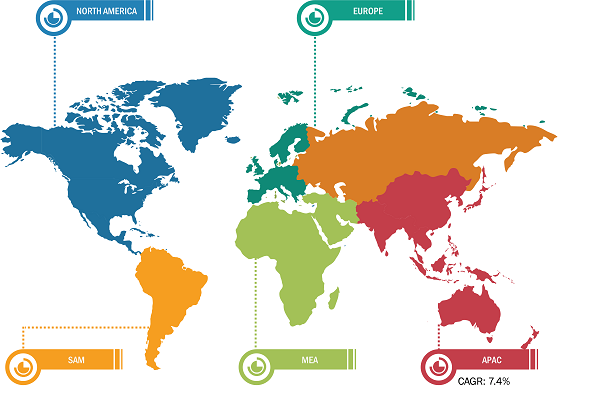
The geographic scope of the water softeners market report is mainly divided into five regions: North America, Asia Pacific, Europe, Middle East & Africa, and South & Central America.
Asia Pacific held a significant share of the water softeners market in 2023. With the rising population, water consumption is rapidly increasing across the region. The burden on municipal water treatment plants across the region has significantly increased due to the need to fulfill the rising demand for drinking water and sanitary facilities. Due to infrastructure limitations, municipal corporations in countries such as China and India are unable to handle hard water efficiently. According to the Asian Development Bank, nearly 3,400 million people in Asia are estimated to live in water-stressed areas by 2050. Such stats emphasize the need to implement water recycling and reuse approaches, which would drive the demand for water softeners over the coming years.
Water Softeners Market News and Recent Developments
The water softeners market is evaluated by gathering qualitative and quantitative data post primary and secondary research, which includes important corporate publications, association data, and databases. A few of the key developments in the water softeners market as mentioned below:
- Organica Water is raising institutional funds to expand its operations. (Source: Organica Water, News, 2023)
- SpringWell Water extended its sales to Canada to expand the reach of its product offerings to new geographies that present growth opportunities and reinforce its mission to provide every family with clean, refreshing, and contaminate-free drinking water. (Source: SpringWell Water, News, 2021)
Water Softeners Market Report Scope
Water Softeners Market Report Coverage and Deliverables
The “Water Softeners Market Size and Forecast (2021–2031)” report provides a detailed analysis of the market covering below areas:
- Water softeners market size and forecast at global, regional, and country levels for all the key market segments covered under the scope
- Water softeners market trends as well as market dynamics such as drivers, restraints, and key opportunities
- Detailed PEST/Porter’s Five Forces and SWOT analysis
- Water softeners market analysis covering key market trends, global and regional framework, major players, regulations, and recent market developments
- Industry landscape and competition analysis covering market concentration, heat map analysis, prominent players, and recent developments for the water softeners market
- Detailed company profiles

Report Coverage
Revenue forecast, Company Analysis, Industry landscape, Growth factors, and Trends

Segment Covered
Type and Application

Regional Scope
North America, Europe, Asia Pacific, Middle East & Africa, South & Central America

Country Scope
Argentina, Australia, Brazil, Canada, China, France, Germany, India, Italy, Japan, Mexico, Russian Federation, Saudi Arabia, South Africa, South Korea, United Arab Emirates, United Kingdom, United States
Frequently Asked Questions
Asia Pacific is the largest region of global water softeners market. With the rising population, water consumption is rapidly increasing across Asia Pacific. The burden on municipal water treatment plants across the region has significantly increased due to the need to fulfill the rising demand for drinking water and sanitary facilities.
Hard water can lead to the buildup of limescale deposits in plumbing and appliances, reducing their efficiency and lifespan. Water-softening solutions are adopted to protect various equipment, plumbing systems, and human health from the detrimental effects of hard water.
Based on type, the market is bifurcated into salt-based water softeners and salt-free water softeners. The salt-based water softeners segment accounted for a larger water softeners market share in 2023. Salt-based water softeners are a widely utilized solution for addressing the challenges posed by hard water.
Based on end use, the water softeners market is segmented into residential, commercial (hotels and lodges, restaurants, offices, hospitals, and others), and institutional. The residential segment accounted for the largest and fastest water softeners market share in 2023. Water softeners play a vital role in residential applications, providing numerous benefits to households dealing with hard water.
The major players operating in the global water softeners market are Rheem Manufacturing Co, Marlo Inc, Robert B Hill Co, Silverline UK Ltd, Hobart Corp, Water-Right Inc, US Water Systems Inc, Kinetico Inc, Ecowater Systems LLC, and Culligan International Co.
Water softener manufacturers engage in mergers and acquisitions, collaborations, and other strategic developments to expand their clientele and enhance their market position. In November 2022, Culligan International and Waterlogic Group Holdings joined forces to offer clean and sustainable drinking water solutions. Culligan is a provider of consumer-focused, sustainable water solutions and services, and Waterlogic is a globally operating designer, manufacturer, and distributor of purified drinking water dispensers.
1. Introduction
1.1 The Insight Partners Research Report Guidance
1.2 Market Segmentation
2. Executive Summary
2.1 Key Insights
2.2 Market Attractiveness
3. Research Methodology
3.1 Secondary Research
3.2 Primary Research
3.2.1 Hypothesis Formulation:
3.2.2 Macro-Economic Factor Analysis:
3.2.3 Developing Base Number:
3.2.4 Data Triangulation:
3.2.5 Country Level Data:
4. Water Softeners Market Landscape
4.1 Overview
4.2 Porters Five Forces Analysis
4.2.1 Bargaining Power of Suppliers
4.2.2 Bargaining Power of Buyers
4.2.3 Threat of New Entrants
4.2.4 Intensity of Competitive Rivalry
4.2.5 Threat of Substitutes
4.3 Ecosystem Analysis
4.3.1 Raw Material/Component Suppliers
4.3.2 Manufacturers
4.3.3 Distributors/Suppliers
4.3.4 End Users
4.3.5 List of Vendors in the Value Chain
5. Water Softeners Market – Key Market Dynamics
5.1 Water Softeners Market – Key Market Dynamics
5.2 Market Drivers
5.2.1 Increasing Awareness Regarding Harmful Effects of Hardwater
5.2.2 Rising Adoption of Water Softeners in Emerging Economies
5.3 Market Restraints
5.3.1 High Cost of Water Softeners and Maintenance
5.4 Market Opportunities
5.4.1 Strategic Initiatives by Key Market Players
5.5 Future Trends
5.5.1 Growing Adoption of Salt-Free Water Softeners
5.6 Impact Analysis
6. Water Softeners Market – Global Market Analysis
6.1 Water Softeners Market Volume (Thousand Units), 2023–2031
6.2 Water Softeners Market Volume Forecast and Analysis (Thousand Units)
6.3 Water Softeners Market Revenue (US$ Million), 2023–2031
6.4 Water Softeners Market Forecast and Analysis
7. Water Softeners Market Volume and Revenue Analysis – by Type
7.1 Salt-Based Water Softeners
7.1.1 Overview
7.1.2 Salt-Based Water Softeners: Water Softeners Market – Volume and Forecast to 2031 (Thousand Units)
7.1.3 Salt-Based Water Softeners: Water Softeners Market –Revenue and Forecast to 2031 (US$ Million)
7.2 Salt-Free Water Softeners
7.2.1 Overview
7.2.2 Salt-Free Water Softeners: Water Softeners Market – Volume and Forecast to 2031 (Thousand Units)
7.2.3 Salt-Free Water Softeners: Water Softeners Market –Revenue and Forecast to 2031 (US$ Million)
8. Water Softeners Market Volume and Revenue Analysis – by End-use
8.1 Residential
8.1.1 Overview
8.1.2 Residential: Water Softeners Market – Volume and Forecast to 2031 (Thousand Units)
8.1.3 Residential: Water Softeners Market –Revenue and Forecast to 2031 (US$ Million)
8.2 Commercial
8.2.1 Overview
8.2.2 Commercial: Water Softeners Market – Volume and Forecast to 2031 (Thousand Units)
8.2.3 Commercial: Water Softeners Market –Revenue and Forecast to 2031 (US$ Million)
8.3 Institutional
8.3.1 Overview
8.3.2 Institutional: Water Softeners Market – Volume and Forecast to 2031 (Thousand Units)
8.3.3 Institutional: Water Softeners Market –Revenue and Forecast to 2031 (US$ Million)
9. Water Softeners Market – Geographical Analysis
9.1 Overview
9.2 North America
9.2.1 North America Water Softeners Market Overview
9.2.2 North America Water Softeners Market – Revenue and Forecast to 2031 (US$ Million)
9.2.3 North America Water Softeners Market Breakdown by Type
9.2.3.1 North America Water Softeners Market Volume and Forecast and Analysis – by Type
9.2.3.2 North America Water Softeners Market Revenue and Forecast and Analysis –by Type
9.2.4 North America Water Softeners Market Breakdown by End-use
9.2.4.1 North America Water Softeners Market Volume and Forecast and Analysis – by End-use
9.2.4.2 North America Water Softeners Market Revenue and Forecast and Analysis –by End-use
9.2.5 North America Water Softeners Market Revenue and Forecast and Analysis – by Country
9.2.5.1 North America Water Softeners Market Volume and Forecast and Analysis – by Country
9.2.5.2 North America Water Softeners Market Revenue and Forecast and Analysis –by Country
9.2.5.3 US Water Softeners Market – Revenue and Forecast to 2031 (US$ Million)
9.2.5.3.1 US Water Softeners Market Breakdown by Type
9.2.5.3.2 US Water Softeners Market Breakdown by End-use
9.2.5.4 Canada Water Softeners Market – Revenue and Forecast to 2031 (US$ Million)
9.2.5.4.1 Canada Water Softeners Market Breakdown by Type
9.2.5.4.2 Canada Water Softeners Market Breakdown by End-use
9.2.5.5 Mexico Water Softeners Market – Revenue and Forecast to 2031 (US$ Million)
9.2.5.5.1 Mexico Water Softeners Market Breakdown by Type
9.2.5.5.2 Mexico Water Softeners Market Breakdown by End-use
9.3 Europe
9.3.1 Europe Water Softeners Market Overview
9.3.2 Europe Water Softeners Market – Revenue and Forecast to 2031 (US$ Million)
9.3.3 Europe Water Softeners Market Breakdown by Type
9.3.3.1 Europe Water Softeners Market Volume and Forecast and Analysis – by Type
9.3.3.2 Europe Water Softeners Market Revenue and Forecast and Analysis –by Type
9.3.4 Europe Water Softeners Market Breakdown by End-use
9.3.4.1 Europe Water Softeners Market Volume and Forecast and Analysis – by End-use
9.3.4.2 Europe Water Softeners Market Revenue and Forecast and Analysis –by End-use
9.3.5 Europe Water Softeners Market Revenue and Forecast and Analysis – by Country
9.3.5.1 Europe Water Softeners Market Volume and Forecast and Analysis – by Country
9.3.5.2 Europe Water Softeners Market Revenue and Forecast and Analysis –by Country
9.3.5.3 Germany Water Softeners Market – Revenue and Forecast to 2031 (US$ Million)
9.3.5.3.1 Germany Water Softeners Market Breakdown by Type
9.3.5.3.2 Germany Water Softeners Market Breakdown by End-use
9.3.5.4 France Water Softeners Market – Revenue and Forecast to 2031 (US$ Million)
9.3.5.4.1 France Water Softeners Market Breakdown by Type
9.3.5.4.2 France Water Softeners Market Breakdown by End-use
9.3.5.5 Italy Water Softeners Market – Revenue and Forecast to 2031 (US$ Million)
9.3.5.5.1 Italy Water Softeners Market Breakdown by Type
9.3.5.5.2 Italy Water Softeners Market Breakdown by End-use
9.3.5.6 UK Water Softeners Market – Revenue and Forecast to 2031 (US$ Million)
9.3.5.6.1 UK Water Softeners Market Breakdown by Type
9.3.5.6.2 UK Water Softeners Market Breakdown by End-use
9.3.5.7 Russia Water Softeners Market – Revenue and Forecast to 2031 (US$ Million)
9.3.5.7.1 Russia Water Softeners Market Breakdown by Type
9.3.5.7.2 Russia Water Softeners Market Breakdown by End-use
9.3.5.8 Rest of Europe Water Softeners Market – Revenue and Forecast to 2031 (US$ Million)
9.3.5.8.1 Rest of Europe Water Softeners Market Breakdown by Type
9.3.5.8.2 Rest of Europe Water Softeners Market Breakdown by End-use
9.4 Asia Pacific
9.4.1 Asia Pacific Water Softeners Market Overview
9.4.2 Asia Pacific Water Softeners Market – Revenue and Forecast to 2031 (US$ Million)
9.4.3 Asia Pacific Water Softeners Market Breakdown by Type
9.4.3.1 Asia Pacific Water Softeners Market Volume and Forecast and Analysis – by Type
9.4.3.2 Asia Pacific Water Softeners Market Revenue and Forecast and Analysis –by Type
9.4.4 Asia Pacific Water Softeners Market Breakdown by End-use
9.4.4.1 Asia Pacific Water Softeners Market Volume and Forecast and Analysis – by End-use
9.4.4.2 Asia Pacific Water Softeners Market Revenue and Forecast and Analysis –by End-use
9.4.5 Asia Pacific Water Softeners Market Revenue and Forecast and Analysis – by Country
9.4.5.1 Asia Pacific Water Softeners Market Volume and Forecast and Analysis – by Country
9.4.5.2 Asia Pacific Water Softeners Market Revenue and Forecast and Analysis –by Country
9.4.5.3 Australia Water Softeners Market – Revenue and Forecast to 2031 (US$ Million)
9.4.5.3.1 Australia Water Softeners Market Breakdown by Type
9.4.5.3.2 Australia Water Softeners Market Breakdown by End-use
9.4.5.4 China Water Softeners Market – Revenue and Forecast to 2031 (US$ Million)
9.4.5.4.1 China Water Softeners Market Breakdown by Type
9.4.5.4.2 China Water Softeners Market Breakdown by End-use
9.4.5.5 India Water Softeners Market – Revenue and Forecast to 2031 (US$ Million)
9.4.5.5.1 India Water Softeners Market Breakdown by Type
9.4.5.5.2 India Water Softeners Market Breakdown by End-use
9.4.5.6 Japan Water Softeners Market – Revenue and Forecast to 2031 (US$ Million)
9.4.5.6.1 Japan Water Softeners Market Breakdown by Type
9.4.5.6.2 Japan Water Softeners Market Breakdown by End-use
9.4.5.7 South Korea Water Softeners Market – Revenue and Forecast to 2031 (US$ Million)
9.4.5.7.1 South Korea Water Softeners Market Breakdown by Type
9.4.5.7.2 South Korea Water Softeners Market Breakdown by End-use
9.4.5.8 Rest of APAC Water Softeners Market – Revenue and Forecast to 2031 (US$ Million)
9.4.5.8.1 Rest of APAC Water Softeners Market Breakdown by Type
9.4.5.8.2 Rest of APAC Water Softeners Market Breakdown by End-use
9.5 Middle East and Africa
9.5.1 Middle East and Africa Water Softeners Market Overview
9.5.2 Middle East and Africa Water Softeners Market – Revenue and Forecast to 2031 (US$ Million)
9.5.3 Middle East and Africa Water Softeners Market Breakdown by Type
9.5.3.1 Middle East and Africa Water Softeners Market Volume and Forecast and Analysis – by Type
9.5.3.2 Middle East and Africa Water Softeners Market Revenue and Forecast and Analysis –by Type
9.5.4 Middle East and Africa Water Softeners Market Breakdown by End-use
9.5.4.1 Middle East and Africa Water Softeners Market Volume and Forecast and Analysis – by End-use
9.5.4.2 Middle East and Africa Water Softeners Market Revenue and Forecast and Analysis –by End-use
9.5.5 Middle East and Africa Water Softeners Market Revenue and Forecast and Analysis – by Country
9.5.5.1 Middle East and Africa Water Softeners Market Volume and Forecast and Analysis – by Country
9.5.5.2 Middle East and Africa Water Softeners Market Revenue and Forecast and Analysis –by Country
9.5.5.3 South Africa Water Softeners Market – Revenue and Forecast to 2031 (US$ Million)
9.5.5.3.1 South Africa Water Softeners Market Breakdown by Type
9.5.5.3.2 South Africa Water Softeners Market Breakdown by End-use
9.5.5.4 Saudi Arabia Water Softeners Market – Revenue and Forecast to 2031 (US$ Million)
9.5.5.4.1 Saudi Arabia Water Softeners Market Breakdown by Type
9.5.5.4.2 Saudi Arabia Water Softeners Market Breakdown by End-use
9.5.5.5 UAE Water Softeners Market – Revenue and Forecast to 2031 (US$ Million)
9.5.5.5.1 UAE Water Softeners Market Breakdown by Type
9.5.5.5.2 UAE Water Softeners Market Breakdown by End-use
9.5.5.6 Rest of Middle East and Africa Water Softeners Market – Revenue and Forecast to 2031 (US$ Million)
9.5.5.6.1 Rest of Middle East and Africa Water Softeners Market Breakdown by Type
9.5.5.6.2 Rest of Middle East and Africa Water Softeners Market Breakdown by End-use
9.6 South and Central America
9.6.1 South and Central America Water Softeners Market Overview
9.6.2 South and Central America Water Softeners Market – Revenue and Forecast to 2031 (US$ Million)
9.6.3 South and Central America Water Softeners Market Breakdown by Type
9.6.3.1 South and Central America Water Softeners Market Volume and Forecast and Analysis – by Type
9.6.3.2 South and Central America Water Softeners Market Revenue and Forecast and Analysis –by Type
9.6.4 South and Central America Water Softeners Market Breakdown by End-use
9.6.4.1 South and Central America Water Softeners Market Volume and Forecast and Analysis – by End-use
9.6.4.2 South and Central America Water Softeners Market Revenue and Forecast and Analysis –by End-use
9.6.5 South and Central America Water Softeners Market Revenue and Forecast and Analysis – by Country
9.6.5.1 South and Central America Water Softeners Market Volume and Forecast and Analysis – by Country
9.6.5.2 South and Central America Water Softeners Market Revenue and Forecast and Analysis –by Country
9.6.5.3 Brazil Water Softeners Market – Revenue and Forecast to 2031 (US$ Million)
9.6.5.3.1 Brazil Water Softeners Market Breakdown by Type
9.6.5.3.2 Brazil Water Softeners Market Breakdown by End-use
9.6.5.4 Argentina Water Softeners Market – Revenue and Forecast to 2031 (US$ Million)
9.6.5.4.1 Argentina Water Softeners Market Breakdown by Type
9.6.5.4.2 Argentina Water Softeners Market Breakdown by End-use
9.6.5.5 Rest of South and Central America Water Softeners Market – Revenue and Forecast to 2031 (US$ Million)
9.6.5.5.1 Rest of South and Central America Water Softeners Market Breakdown by Type
9.6.5.5.2 Rest of South and Central America Water Softeners Market Breakdown by End-use
10. Competitive Landscape
10.1 Heat Map Analysis by Key Players
10.2 Company Positioning & Concentration
11. Industry Landscape
11.1 Overview
11.2 Market Initiative
11.3 New Product Development
11.4 Merger and Acquisition
12. Company Profiles
12.1 Rheem Manufacturing Co
12.1.1 Key Facts
12.1.2 Business Description
12.1.3 Products and Services
12.1.4 Financial Overview
12.1.5 SWOT Analysis
12.1.6 Key Developments
12.2 Marlo Inc
12.2.1 Key Facts
12.2.2 Business Description
12.2.3 Products and Services
12.2.4 Financial Overview
12.2.5 SWOT Analysis
12.2.6 Key Developments
12.3 Robert B Hill Co
12.3.1 Key Facts
12.3.2 Business Description
12.3.3 Products and Services
12.3.4 Financial Overview
12.3.5 SWOT Analysis
12.3.6 Key Developments
12.4 Silverline UK Ltd
12.4.1 Key Facts
12.4.2 Business Description
12.4.3 Products and Services
12.4.4 Financial Overview
12.4.5 SWOT Analysis
12.4.6 Key Developments
12.5 Hobart Corp
12.5.1 Key Facts
12.5.2 Business Description
12.5.3 Products and Services
12.5.4 Financial Overview
12.5.5 SWOT Analysis
12.5.6 Key Developments
12.6 Water-Right Inc
12.6.1 Key Facts
12.6.2 Business Description
12.6.3 Products and Services
12.6.4 Financial Overview
12.6.5 SWOT Analysis
12.6.6 Key Developments
12.7 US Water Systems Inc
12.7.1 Key Facts
12.7.2 Business Description
12.7.3 Products and Services
12.7.4 Financial Overview
12.7.5 SWOT Analysis
12.7.6 Key Developments
12.8 Kinetico Inc
12.8.1 Key Facts
12.8.2 Business Description
12.8.3 Products and Services
12.8.4 Financial Overview
12.8.5 SWOT Analysis
12.8.6 Key Developments
12.9 Ecowater Systems LLC
12.9.1 Key Facts
12.9.2 Business Description
12.9.3 Products and Services
12.9.4 Financial Overview
12.9.5 SWOT Analysis
12.9.6 Key Developments
12.10 Culligan International Co
12.10.1 Key Facts
12.10.2 Business Description
12.10.3 Products and Services
12.10.4 Financial Overview
12.10.5 SWOT Analysis
12.10.6 Key Developments
13. Appendix
13.1 About The Insight Partners
List of Tables
Table 1. Water Softeners Market Segmentation
Table 2. List of Vendors
Table 3. Water Softeners Market – Volume and Forecast to 2031 (Thousand Units)
Table 4. Water Softeners Market – Revenue and Forecast to 2031 (US$ Million)
Table 5. Water Softeners Market – Volume and Forecast to 2031 (Thousand Units) – by Type
Table 6. Water Softeners Market – Revenue and Forecast to 2031 (US$ Million) – by Type
Table 7. Water Softeners Market – Volume and Forecast to 2031 (Thousand Units) – by End-use
Table 8. Water Softeners Market – Revenue and Forecast to 2031 (US$ Million) – by End-use
Table 9. North America Water Softeners Market – Volume and Forecast to 2031 (Thousand Units) – by Type
Table 10. North America Water Softeners Market – Revenue and Forecast to 2031 (US$ Million) – by Type
Table 11. North America Water Softeners Market – Volume and Forecast to 2031 (Thousand Units) – by End-use
Table 12. North America Water Softeners Market – Revenue and Forecast to 2031 (US$ Million) – by End-use
Table 13. North America Water Softeners Market – Volume and Forecast to 2031 (Thousand Units) – by Country
Table 14. North America Water Softeners Market – Revenue and Forecast to 2031 (US$ Million) – by Country
Table 15. US Water Softeners Market –Volume and Forecast to 2031 (Thousand Units) – by Type
Table 16. US Water Softeners Market – Revenue and Forecast to 2031 (US$ Million) – by Type
Table 17. US Water Softeners Market –Volume and Forecast to 2031 (Thousand Units) – by End-use
Table 18. US Water Softeners Market – Revenue and Forecast to 2031 (US$ Million) – by End-use
Table 19. Canada Water Softeners Market –Volume and Forecast to 2031 (Thousand Units) – by Type
Table 20. Canada Water Softeners Market – Revenue and Forecast to 2031 (US$ Million) – by Type
Table 21. Canada Water Softeners Market –Volume and Forecast to 2031 (Thousand Units) – by End-use
Table 22. Canada Water Softeners Market – Revenue and Forecast to 2031 (US$ Million) – by End-use
Table 23. Mexico Water Softeners Market –Volume and Forecast to 2031 (Thousand Units) – by Type
Table 24. Mexico Water Softeners Market – Revenue and Forecast to 2031 (US$ Million) – by Type
Table 25. Mexico Water Softeners Market –Volume and Forecast to 2031 (Thousand Units) – by End-use
Table 26. Mexico Water Softeners Market – Revenue and Forecast to 2031 (US$ Million) – by End-use
Table 27. Europe Water Softeners Market – Volume and Forecast to 2031 (Thousand Units) – by Type
Table 28. Europe Water Softeners Market – Revenue and Forecast to 2031 (US$ Million) – by Type
Table 29. Europe Water Softeners Market – Volume and Forecast to 2031 (Thousand Units) – by End-use
Table 30. Europe Water Softeners Market – Revenue and Forecast to 2031 (US$ Million) – by End-use
Table 31. Europe Water Softeners Market – Volume and Forecast to 2031 (Thousand Units) – by Country
Table 32. Europe Water Softeners Market – Revenue and Forecast to 2031 (US$ Million) – by Country
Table 33. Germany Water Softeners Market –Volume and Forecast to 2031 (Thousand Units) – by Type
Table 34. Germany Water Softeners Market – Revenue and Forecast to 2031 (US$ Million) – by Type
Table 35. Germany Water Softeners Market –Volume and Forecast to 2031 (Thousand Units) – by End-use
Table 36. Germany Water Softeners Market – Revenue and Forecast to 2031 (US$ Million) – by End-use
Table 37. France Water Softeners Market –Volume and Forecast to 2031 (Thousand Units) – by Type
Table 38. France Water Softeners Market – Revenue and Forecast to 2031 (US$ Million) – by Type
Table 39. France Water Softeners Market –Volume and Forecast to 2031 (Thousand Units) – by End-use
Table 40. France Water Softeners Market – Revenue and Forecast to 2031 (US$ Million) – by End-use
Table 41. Italy Water Softeners Market –Volume and Forecast to 2031 (Thousand Units) – by Type
Table 42. Italy Water Softeners Market – Revenue and Forecast to 2031 (US$ Million) – by Type
Table 43. Italy Water Softeners Market –Volume and Forecast to 2031 (Thousand Units) – by End-use
Table 44. Italy Water Softeners Market – Revenue and Forecast to 2031 (US$ Million) – by End-use
Table 45. UK Water Softeners Market –Volume and Forecast to 2031 (Thousand Units) – by Type
Table 46. UK Water Softeners Market – Revenue and Forecast to 2031 (US$ Million) – by Type
Table 47. UK Water Softeners Market –Volume and Forecast to 2031 (Thousand Units) – by End-use
Table 48. UK Water Softeners Market – Revenue and Forecast to 2031 (US$ Million) – by End-use
Table 49. Russia Water Softeners Market –Volume and Forecast to 2031 (Thousand Units) – by Type
Table 50. Russia Water Softeners Market – Revenue and Forecast to 2031 (US$ Million) – by Type
Table 51. Russia Water Softeners Market –Volume and Forecast to 2031 (Thousand Units) – by End-use
Table 52. Russia Water Softeners Market – Revenue and Forecast to 2031 (US$ Million) – by End-use
Table 53. Rest of Europe Water Softeners Market –Volume and Forecast to 2031 (Thousand Units) – by Type
Table 54. Rest of Europe Water Softeners Market – Revenue and Forecast to 2031 (US$ Million) – by Type
Table 55. Rest of Europe Water Softeners Market –Volume and Forecast to 2031 (Thousand Units) – by End-use
Table 56. Rest of Europe Water Softeners Market – Revenue and Forecast to 2031 (US$ Million) – by End-use
Table 57. Asia Pacific Water Softeners Market – Volume and Forecast to 2031 (Thousand Units) – by Type
Table 58. Asia Pacific Water Softeners Market – Revenue and Forecast to 2031 (US$ Million) – by Type
Table 59. Asia Pacific Water Softeners Market – Volume and Forecast to 2031 (Thousand Units) – by End-use
Table 60. Asia Pacific Water Softeners Market – Revenue and Forecast to 2031 (US$ Million) – by End-use
Table 61. Asia Pacific Water Softeners Market – Volume and Forecast to 2031 (Thousand Units) – by Country
Table 62. Asia Pacific Water Softeners Market – Revenue and Forecast to 2031 (US$ Million) – by Country
Table 63. Australia Water Softeners Market –Volume and Forecast to 2031 (Thousand Units) – by Type
Table 64. Australia Water Softeners Market – Revenue and Forecast to 2031 (US$ Million) – by Type
Table 65. Australia Water Softeners Market –Volume and Forecast to 2031 (Thousand Units) – by End-use
Table 66. Australia Water Softeners Market – Revenue and Forecast to 2031 (US$ Million) – by End-use
Table 67. China Water Softeners Market –Volume and Forecast to 2031 (Thousand Units) – by Type
Table 68. China Water Softeners Market – Revenue and Forecast to 2031 (US$ Million) – by Type
Table 69. China Water Softeners Market –Volume and Forecast to 2031 (Thousand Units) – by End-use
Table 70. China Water Softeners Market – Revenue and Forecast to 2031 (US$ Million) – by End-use
Table 71. India Water Softeners Market –Volume and Forecast to 2031 (Thousand Units) – by Type
Table 72. India Water Softeners Market – Revenue and Forecast to 2031 (US$ Million) – by Type
Table 73. India Water Softeners Market –Volume and Forecast to 2031 (Thousand Units) – by End-use
Table 74. India Water Softeners Market – Revenue and Forecast to 2031 (US$ Million) – by End-use
Table 75. Japan Water Softeners Market –Volume and Forecast to 2031 (Thousand Units) – by Type
Table 76. Japan Water Softeners Market – Revenue and Forecast to 2031 (US$ Million) – by Type
Table 77. Japan Water Softeners Market –Volume and Forecast to 2031 (Thousand Units) – by End-use
Table 78. Japan Water Softeners Market – Revenue and Forecast to 2031 (US$ Million) – by End-use
Table 79. South Korea Water Softeners Market –Volume and Forecast to 2031 (Thousand Units) – by Type
Table 80. South Korea Water Softeners Market – Revenue and Forecast to 2031 (US$ Million) – by Type
Table 81. South Korea Water Softeners Market –Volume and Forecast to 2031 (Thousand Units) – by End-use
Table 82. South Korea Water Softeners Market – Revenue and Forecast to 2031 (US$ Million) – by End-use
Table 83. Rest of APAC Water Softeners Market –Volume and Forecast to 2031 (Thousand Units) – by Type
Table 84. Rest of APAC Water Softeners Market – Revenue and Forecast to 2031 (US$ Million) – by Type
Table 85. Rest of APAC Water Softeners Market –Volume and Forecast to 2031 (Thousand Units) – by End-use
Table 86. Rest of APAC Water Softeners Market – Revenue and Forecast to 2031 (US$ Million) – by End-use
Table 87. Middle East and Africa Water Softeners Market – Volume and Forecast to 2031 (Thousand Units) – by Type
Table 88. Middle East and Africa Water Softeners Market – Revenue and Forecast to 2031 (US$ Million) – by Type
Table 89. Middle East and Africa Water Softeners Market – Volume and Forecast to 2031 (Thousand Units) – by End-use
Table 90. Middle East and Africa Water Softeners Market – Revenue and Forecast to 2031 (US$ Million) – by End-use
Table 91. Middle East and Africa Water Softeners Market – Volume and Forecast to 2031 (Thousand Units) – by Country
Table 92. Middle East and Africa Water Softeners Market – Revenue and Forecast to 2031 (US$ Million) – by Country
Table 93. South Africa Water Softeners Market –Volume and Forecast to 2031 (Thousand Units) – by Type
Table 94. South Africa Water Softeners Market – Revenue and Forecast to 2031 (US$ Million) – by Type
Table 95. South Africa Water Softeners Market –Volume and Forecast to 2031 (Thousand Units) – by End-use
Table 96. South Africa Water Softeners Market – Revenue and Forecast to 2031 (US$ Million) – by End-use
Table 97. Saudi Arabia Water Softeners Market –Volume and Forecast to 2031 (Thousand Units) – by Type
Table 98. Saudi Arabia Water Softeners Market – Revenue and Forecast to 2031 (US$ Million) – by Type
Table 99. Saudi Arabia Water Softeners Market –Volume and Forecast to 2031 (Thousand Units) – by End-use
Table 100. Saudi Arabia Water Softeners Market – Revenue and Forecast to 2031 (US$ Million) – by End-use
Table 101. UAE Water Softeners Market –Volume and Forecast to 2031 (Thousand Units) – by Type
Table 102. UAE Water Softeners Market – Revenue and Forecast to 2031 (US$ Million) – by Type
Table 103. UAE Water Softeners Market –Volume and Forecast to 2031 (Thousand Units) – by End-use
Table 104. UAE Water Softeners Market – Revenue and Forecast to 2031 (US$ Million) – by End-use
Table 105. Rest of Middle East and Africa Water Softeners Market –Volume and Forecast to 2031 (Thousand Units) – by Type
Table 106. Rest of Middle East and Africa Water Softeners Market – Revenue and Forecast to 2031 (US$ Million) – by Type
Table 107. Rest of Middle East and Africa Water Softeners Market –Volume and Forecast to 2031 (Thousand Units) – by End-use
Table 108. Rest of Middle East and Africa Water Softeners Market – Revenue and Forecast to 2031 (US$ Million) – by End-use
Table 109. South and Central America Water Softeners Market – Volume and Forecast to 2031 (Thousand Units) – by Type
Table 110. South and Central America Water Softeners Market – Revenue and Forecast to 2031 (US$ Million) – by Type
Table 111. South and Central America Water Softeners Market – Volume and Forecast to 2031 (Thousand Units) – by End-use
Table 112. South and Central America Water Softeners Market – Revenue and Forecast to 2031 (US$ Million) – by End-use
Table 113. South and Central America Water Softeners Market – Volume and Forecast to 2031 (Thousand Units) – by Country
Table 114. South and Central America Water Softeners Market – Revenue and Forecast to 2031 (US$ Million) – by Country
Table 115. Brazil Water Softeners Market –Volume and Forecast to 2031 (Thousand Units) – by Type
Table 116. Brazil Water Softeners Market – Revenue and Forecast to 2031 (US$ Million) – by Type
Table 117. Brazil Water Softeners Market –Volume and Forecast to 2031 (Thousand Units) – by End-use
Table 118. Brazil Water Softeners Market – Revenue and Forecast to 2031 (US$ Million) – by End-use
Table 119. Argentina Water Softeners Market –Volume and Forecast to 2031 (Thousand Units) – by Type
Table 120. Argentina Water Softeners Market – Revenue and Forecast to 2031 (US$ Million) – by Type
Table 121. Argentina Water Softeners Market –Volume and Forecast to 2031 (Thousand Units) – by End-use
Table 122. Argentina Water Softeners Market – Revenue and Forecast to 2031 (US$ Million) – by End-use
Table 123. Rest of South and Central America Water Softeners Market –Volume and Forecast to 2031 (Thousand Units) – by Type
Table 124. Rest of South and Central America Water Softeners Market – Revenue and Forecast to 2031 (US$ Million) – by Type
Table 125. Rest of South and Central America Water Softeners Market –Volume and Forecast to 2031 (Thousand Units) – by End-use
Table 126. Rest of South and Central America Water Softeners Market – Revenue and Forecast to 2031 (US$ Million) – by End-use
List of Figures
Figure 1. Water Softeners Market Segmentation, by Geography
Figure 2. Water Softeners Market—Porter's Analysis
Figure 3. Ecosystem: Global Water Softeners Market
Figure 4. Impact Analysis of Drivers and Restraints
Figure 5. Water Softeners Market Volume (Thousand Units), 2023–2031
Figure 6. Water Softeners Market Revenue (US$ Million), 2023–2031
Figure 7. Water Softeners Market Share (%) – Type, 2023 and 2031
Figure 8. Salt-Based Water Softeners: Water Softeners Market – Volume and Forecast to 2031 (Thousand Units)
Figure 9. Salt-Based Water Softeners: Water Softeners Market – Revenue and Forecast to2031 (US$ Million)
Figure 10. Salt-Free Water Softeners: Water Softeners Market – Volume and Forecast to 2031 (Thousand Units)
Figure 11. Salt-Free Water Softeners: Water Softeners Market – Revenue and Forecast to2031 (US$ Million)
Figure 12. Water Softeners Market Share (%) – End-use, 2023 and 2031
Figure 13. Residential: Water Softeners Market – Volume and Forecast to 2031 (Thousand Units)
Figure 14. Residential: Water Softeners Market – Revenue and Forecast to2031 (US$ Million)
Figure 15. Commercial: Water Softeners Market – Volume and Forecast to 2031 (Thousand Units)
Figure 16. Commercial: Water Softeners Market – Revenue and Forecast to2031 (US$ Million)
Figure 17. Institutional: Water Softeners Market – Volume and Forecast to 2031 (Thousand Units)
Figure 18. Institutional: Water Softeners Market – Revenue and Forecast to2031 (US$ Million)
Figure 19. Water Softeners Market Breakdown by Region, 2023 and 2031 (%)
Figure 20. North America Water Softeners Market – Revenue and Forecast to 2031 (US$ Million)
Figure 21. North America Water Softeners Market Breakdown by Type (2023 and 2031)
Figure 22. North America Water Softeners Market Breakdown by End-use (2023 and 2031)
Figure 23. North America Water Softeners Market Breakdown by Key Countries, 2023 and 2031 (%)
Figure 24. US Water Softeners Market – Revenue and Forecast to 2031 (US$ Million)
Figure 25. Canada Water Softeners Market – Revenue and Forecast to 2031 (US$ Million)
Figure 26. Mexico Water Softeners Market – Revenue and Forecast to 2031 (US$ Million)
Figure 27. Europe Water Softeners Market – Revenue and Forecast to 2031 (US$ Million)
Figure 28. Europe Water Softeners Market Breakdown by Type (2023 and 2031)
Figure 29. Europe Water Softeners Market Breakdown by End-use (2023 and 2031)
Figure 30. Europe Water Softeners Market Breakdown by Key Countries, 2023 and 2031 (%)
Figure 31. Germany Water Softeners Market – Revenue and Forecast to 2031 (US$ Million)
Figure 32. France Water Softeners Market – Revenue and Forecast to 2031 (US$ Million)
Figure 33. Italy Water Softeners Market – Revenue and Forecast to 2031 (US$ Million)
Figure 34. UK Water Softeners Market – Revenue and Forecast to 2031 (US$ Million)
Figure 35. Russia Water Softeners Market – Revenue and Forecast to 2031 (US$ Million)
Figure 36. Rest of Europe Water Softeners Market – Revenue and Forecast to 2031 (US$ Million)
Figure 37. Asia Pacific Water Softeners Market – Revenue and Forecast to 2031 (US$ Million)
Figure 38. Asia Pacific Water Softeners Market Breakdown by Type (2023 and 2031)
Figure 39. Asia Pacific Water Softeners Market Breakdown by End-use (2023 and 2031)
Figure 40. Asia Pacific Water Softeners Market Breakdown by Key Countries, 2023 and 2031 (%)
Figure 41. Australia Water Softeners Market – Revenue and Forecast to 2031 (US$ Million)
Figure 42. China Water Softeners Market – Revenue and Forecast to 2031 (US$ Million)
Figure 43. India Water Softeners Market – Revenue and Forecast to 2031 (US$ Million)
Figure 44. Japan Water Softeners Market – Revenue and Forecast to 2031 (US$ Million)
Figure 45. South Korea Water Softeners Market – Revenue and Forecast to 2031 (US$ Million)
Figure 46. Rest of APAC Water Softeners Market – Revenue and Forecast to 2031 (US$ Million)
Figure 47. Middle East and Africa Water Softeners Market – Revenue and Forecast to 2031 (US$ Million)
Figure 48. Middle East and Africa Water Softeners Market Breakdown by Type (2023 and 2031)
Figure 49. Middle East and Africa Water Softeners Market Breakdown by End-use (2023 and 2031)
Figure 50. Middle East and Africa Water Softeners Market Breakdown by Key Countries, 2023 and 2031 (%)
Figure 51. South Africa Water Softeners Market – Revenue and Forecast to 2031 (US$ Million)
Figure 52. Saudi Arabia Water Softeners Market – Revenue and Forecast to 2031 (US$ Million)
Figure 53. UAE Water Softeners Market – Revenue and Forecast to 2031 (US$ Million)
Figure 54. Rest of Middle East and Africa Water Softeners Market – Revenue and Forecast to 2031 (US$ Million)
Figure 55. South and Central America Water Softeners Market – Revenue and Forecast to 2031 (US$ Million)
Figure 56. South and Central America Water Softeners Market Breakdown by Type (2023 and 2031)
Figure 57. South and Central America Water Softeners Market Breakdown by End-use (2023 and 2031)
Figure 58. South and Central America Water Softeners Market Breakdown by Key Countries, 2023 and 2031 (%)
Figure 59. Brazil Water Softeners Market – Revenue and Forecast to 2031 (US$ Million)
Figure 60. Argentina Water Softeners Market – Revenue and Forecast to 2031 (US$ Million)
Figure 61. Rest of South and Central America Water Softeners Market – Revenue and Forecast to 2031 (US$ Million)
Figure 62. Heat Map Analysis by Key Players
Figure 63. Company Positioning & Concentration
The List of Companies - Water Softeners Market
- Rheem Manufacturing Co
- Marlo Inc
- Robert B Hill Co
- Silverline UK Ltd
- Hobart Corp
- Water-Right Inc
- US Water Systems Inc
- Kinetico Inc
- Ecowater Systems LLC
- Culligan International Co
The Insight Partners performs research in 4 major stages: Data Collection & Secondary Research, Primary Research, Data Analysis and Data Triangulation & Final Review.
- Data Collection and Secondary Research:
As a market research and consulting firm operating from a decade, we have published many reports and advised several clients across the globe. First step for any study will start with an assessment of currently available data and insights from existing reports. Further, historical and current market information is collected from Investor Presentations, Annual Reports, SEC Filings, etc., and other information related to company’s performance and market positioning are gathered from Paid Databases (Factiva, Hoovers, and Reuters) and various other publications available in public domain.
Several associations trade associates, technical forums, institutes, societies and organizations are accessed to gain technical as well as market related insights through their publications such as research papers, blogs and press releases related to the studies are referred to get cues about the market. Further, white papers, journals, magazines, and other news articles published in the last 3 years are scrutinized and analyzed to understand the current market trends.
- Primary Research:
The primarily interview analysis comprise of data obtained from industry participants interview and answers to survey questions gathered by in-house primary team.
For primary research, interviews are conducted with industry experts/CEOs/Marketing Managers/Sales Managers/VPs/Subject Matter Experts from both demand and supply side to get a 360-degree view of the market. The primary team conducts several interviews based on the complexity of the markets to understand the various market trends and dynamics which makes research more credible and precise.
A typical research interview fulfils the following functions:
- Provides first-hand information on the market size, market trends, growth trends, competitive landscape, and outlook
- Validates and strengthens in-house secondary research findings
- Develops the analysis team’s expertise and market understanding
Primary research involves email interactions and telephone interviews for each market, category, segment, and sub-segment across geographies. The participants who typically take part in such a process include, but are not limited to:
- Industry participants: VPs, business development managers, market intelligence managers and national sales managers
- Outside experts: Valuation experts, research analysts and key opinion leaders specializing in the electronics and semiconductor industry.
Below is the breakup of our primary respondents by company, designation, and region:

Once we receive the confirmation from primary research sources or primary respondents, we finalize the base year market estimation and forecast the data as per the macroeconomic and microeconomic factors assessed during data collection.
- Data Analysis:
Once data is validated through both secondary as well as primary respondents, we finalize the market estimations by hypothesis formulation and factor analysis at regional and country level.
- 3.1 Macro-Economic Factor Analysis:
We analyse macroeconomic indicators such the gross domestic product (GDP), increase in the demand for goods and services across industries, technological advancement, regional economic growth, governmental policies, the influence of COVID-19, PEST analysis, and other aspects. This analysis aids in setting benchmarks for various nations/regions and approximating market splits. Additionally, the general trend of the aforementioned components aid in determining the market's development possibilities.
- 3.2 Country Level Data:
Various factors that are especially aligned to the country are taken into account to determine the market size for a certain area and country, including the presence of vendors, such as headquarters and offices, the country's GDP, demand patterns, and industry growth. To comprehend the market dynamics for the nation, a number of growth variables, inhibitors, application areas, and current market trends are researched. The aforementioned elements aid in determining the country's overall market's growth potential.
- 3.3 Company Profile:
The “Table of Contents” is formulated by listing and analyzing more than 25 - 30 companies operating in the market ecosystem across geographies. However, we profile only 10 companies as a standard practice in our syndicate reports. These 10 companies comprise leading, emerging, and regional players. Nonetheless, our analysis is not restricted to the 10 listed companies, we also analyze other companies present in the market to develop a holistic view and understand the prevailing trends. The “Company Profiles” section in the report covers key facts, business description, products & services, financial information, SWOT analysis, and key developments. The financial information presented is extracted from the annual reports and official documents of the publicly listed companies. Upon collecting the information for the sections of respective companies, we verify them via various primary sources and then compile the data in respective company profiles. The company level information helps us in deriving the base number as well as in forecasting the market size.
- 3.4 Developing Base Number:
Aggregation of sales statistics (2020-2022) and macro-economic factor, and other secondary and primary research insights are utilized to arrive at base number and related market shares for 2022. The data gaps are identified in this step and relevant market data is analyzed, collected from paid primary interviews or databases. On finalizing the base year market size, forecasts are developed on the basis of macro-economic, industry and market growth factors and company level analysis.
- Data Triangulation and Final Review:
The market findings and base year market size calculations are validated from supply as well as demand side. Demand side validations are based on macro-economic factor analysis and benchmarks for respective regions and countries. In case of supply side validations, revenues of major companies are estimated (in case not available) based on industry benchmark, approximate number of employees, product portfolio, and primary interviews revenues are gathered. Further revenue from target product/service segment is assessed to avoid overshooting of market statistics. In case of heavy deviations between supply and demand side values, all thes steps are repeated to achieve synchronization.
We follow an iterative model, wherein we share our research findings with Subject Matter Experts (SME’s) and Key Opinion Leaders (KOLs) until consensus view of the market is not formulated – this model negates any drastic deviation in the opinions of experts. Only validated and universally acceptable research findings are quoted in our reports.
We have important check points that we use to validate our research findings – which we call – data triangulation, where we validate the information, we generate from secondary sources with primary interviews and then we re-validate with our internal data bases and Subject matter experts. This comprehensive model enables us to deliver high quality, reliable data in shortest possible time.
 Get Free Sample For