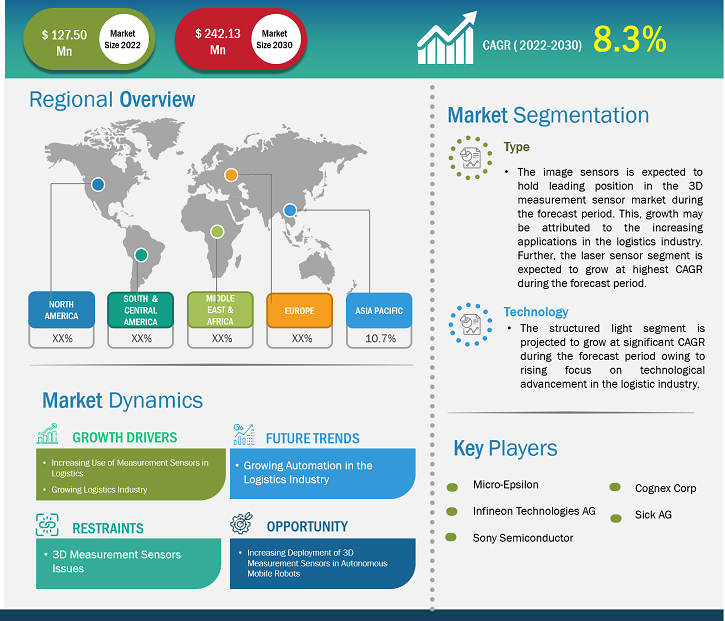
[Research Report] The 3D measurement sensors in logistics market size is expected to grow from US$ 127.50 million in 2022 to US$ 242.13 million by 2030; it is estimated to record a CAGR of 8.3% during the forecast period.
Analyst Perspective:
The demand for 3D image sensors, 3D position sensors, and 3D depth sensors is increasing in the logistics industry worldwide as these sensors help track the movement of goods within a warehouse. In addition, these sensors also help the companies to identify bottlenecks and optimize their warehouse layout as per the needs, driving the growth of the 3D measurement sensors in logistics market. Also, with the growing e-commerce industry, the logistics sector is growing tremendously. This growth is raising the need for automation to further enhance operational efficiency by providing real-time data through machine vision, asset tracking, data capture scanning, and object dimensioning. Furthermore, the use of 3D measurement sensors in robotics is increasing as the sensors help robots to be more aware of their surroundings, which can help them to efficiently perform pick-and-grasp operations in the warehouse, creating an opportunity for the growth of the 3D measurement sensors in logistics market.
Market Overview:
3D measurement sensors are used to obtain information electronically and use this data to improve the interfaces between humans, devices, and the world. These sensors work on 3D sensing technology, which uses near-infrared light reflection, photography, geometric principles, and advanced computing power to enable machines to acquire the details about people and objects, which can be further processed in meaningful information. The demand for 3D sensors is witnessing tremendous growth as they are used in warehouse and logistic operations to increase efficiency. In warehouses, sensors are used for order fulfillment as they help in monitoring product damage and other non-conformances more effectively, thus, boosting the growth of the 3D measurement sensors in logistics market.
Customize Research To Suit Your Requirement
We can optimize and tailor the analysis and scope which is unmet through our standard offerings. This flexibility will help you gain the exact information needed for your business planning and decision making.
3D Measurement Sensors in Logistics Market: Strategic Insights
Market Size Value in US$ 127.50 million in 2022 Market Size Value by US$ 242.13 million by 2030 Growth rate CAGR of 8.3% from 2023 to 2030 Forecast Period 2022-2030 Base Year 2022

Naveen
Have a question?
Naveen will walk you through a 15-minute call to present the report’s content and answer all queries if you have any.
 Speak to Analyst
Customize Research To Suit Your Requirement
We can optimize and tailor the analysis and scope which is unmet through our standard offerings. This flexibility will help you gain the exact information needed for your business planning and decision making.
3D Measurement Sensors in Logistics Market: Strategic Insights
| Market Size Value in | US$ 127.50 million in 2022 |
| Market Size Value by | US$ 242.13 million by 2030 |
| Growth rate | CAGR of 8.3% from 2023 to 2030 |
| Forecast Period | 2022-2030 |
| Base Year | 2022 |
Naveen
Have a question?
Naveen will walk you through a 15-minute call to present the report’s content and answer all queries if you have any.
Speak to Analyst
Market Driver:
Increasing Use of Measurement Sensors in Logistics 3D Measurement Sensors in Logistics Market
The growing use of measurement sensors such as image sensors, position sensors, and acoustic sensors has simplified several logistics operations. Image sensors are used in target recognition in the logistics distribution system to manage the distribution process efficiently. Position sensors are used to detect the position of objects of any material type and surface properties. Position sensors convert the data regarding the movement of objects into signals, which further help provide positional feedback. Various logistics and warehouse management operations, such as monitoring inventory levels, reducing inventory errors, and optimizing storage space, can be carried out easily with the help of measurement sensors. Apart from tracking the movement of goods within a warehouse, these sensors also help companies identify bottlenecks and optimize their warehouse layout. Furthermore, the measurement sensors can be used to collect data at emergency incident sites to facilitate the analysis of the logistic operations. This data can further help improve planning and preparedness for new operations. Real-time information can provide better situational awareness and can also be used as input for automatic decision support based on artificial intelligence or optimization algorithms. Thus, the increasing use of measurement sensors to amplify the efficiency of the distribution center and warehouses is boosting the 3D measurement sensors in logistics market growth.
Segmental Analysis:
Based on technology, the 3D measurement sensors in logistics market is bifurcated into:
- Stereo Vision
- Structured Light
- Laser Light
- Others
The structured light segment held the largest 3D measurement sensors in logistics market share in 2022. Structured light technology enhances 3D measurement capabilities in logistics, enabling accurate volumetric analysis, dimensional inspection, sorting optimization, load planning, and quality control. It also enables precise dimensional inspection of objects in logistics. Thus, the rising demand for structured light will further boost the 3D measurement sensors in logistics market growth during the forecast period.
Regional Analysis:
The 3D measurement sensors in logistics market size is broadly segmented into five major regions: North America, Europe, Asia Pacific (APAC), the Middle East & Africa (MEA), and South America (SAM). North America held the largest 3D measurement sensors in logistics market share in 2022, followed by Europe and APAC. APAC is expected to register the highest CAGR in the 3D measurement sensors in logistics market from 2022 to 2030.
In North America, technological innovations are projected to provide opportunities for the growth of the 3D measurement sensors in logistics market. Various logistics companies in the region are automating their warehouses to increase productivity. This is raising the demand for various warehouse automation solutions, including 3D cameras and robots, propelling the growth of the 3D measurement sensors in logistics market in North America. In addition, the region is witnessing tremendous growth in the e-commerce industry, which is increasing the adoption of automation in the logistics industry, boosting the 3D measurement sensors in logistics market growth.
Key Player Analysis:
Micro-Epsilon Messtechnik GmbH & Co KG, Infineon Technologies AG, Sony Semiconductor Solutions Corp, Cognex Corp, ifm Electronic GmbH, Intel Corp, LMI Technologies Inc, Keyence Corp, OMRON Corp, and Sick AG are among the key 3D measurement sensors in logistics market players operating in the report. Among the players, Micro-Epsilon Messtechnik GmbH & Co KG and Infineon Technologies AG are the top two 3D measurement sensors in logistics market players owing to the diversified product portfolio offered.
3D Measurement Sensors in Logistics Market Report Scope
Recent Developments:
Inorganic and organic strategies such as mergers and acquisitions are highly adopted by companies in the 3D measurement sensors in logistics market. A few recent key market developments are listed below:
- In 2021, Micro-Epsilon developed a 3D snapshot sensor surfaceCONTROL 3D 3200, and it is the right choice for precise geometry, shape, and surface measurements on matt surfaces. The sensor has been developed for automated inline quality inspection.
- In 2020, Infineon Technologies AG completed the acquisition of Cypress Semiconductor Corporation. The acquisition tends to offer customers the industry’s most comprehensive portfolio for linking the real with the digital world and shaping digitalization.
- In 2020, OMRON Corporation announced that it would sell the B5L Series embedded 3D TOF Sensor Module in Japan from September 1 and globally from October 1. The B5L Series utilizes unique optical design technology to stabilize three-dimensional distance information across a wide area, even under sunlight.
- In 2019, The SICK group completed its takeover of the Chilean joint venture SICK SpA by transferring the outstanding 50% of shares from the owning family Schädler in the joint venture. SICK has become the sole owner of SICK SpA as a result of this takeover, strengthening its position in the South American market.
- In 2019, SICK AG inaugurated a new production site in China where it will concentrate on localized product manufacture as well as system construction for individual customers. . With this expansion the company will be able to supply more enhanced automation solutions to its customers.

Report Coverage
Revenue forecast, Company Analysis, Industry landscape, Growth factors, and Trends

Segment Covered
Type, and Technology

Regional Scope
North America, Europe, Asia Pacific, Middle East & Africa, South & Central America

Country Scope
Argentina, Australia, Brazil, Canada, China, France, Germany, India, Italy, Japan, Mexico, Russian Federation, Saudi Arabia, South Africa, South Korea, United Arab Emirates, United Kingdom, United States
Frequently Asked Questions
1. Increasing Use of Measurement Sensors in Logistics
2. Growth of Logistics Industry
3D measurement sensors in logistics market accounted for US$ 127.50 Million in the year 2022 and is expected to grow at a CAGR of 8.3% during the forecast period, to account for US$ 242.13 Million in the year 2030.
Growing Automation in Logistics Industry
Asia Pacific is anticipated to grow with the highest CAGR over the forecast period.
The 3D measurement sensors in logistics market are expected to reach US$ 242.13 Million in the year 2030.
The key players holding majority shares in the 3D measurement sensors in logistics market include Micro-Epsilon Messtechnik GmbH & Co KG, Infineon Technologies AG, Sony Semiconductor Solutions Corp, Cognex Corp., and ifm Electronic GmbH.
1. Introduction
1.1 The Insight Partners Research Report Guidance
1.2 Market Segmentation
2. Executive Summary
2.1 Key Insights
2.2 Market Attractiveness
3. Research Methodology
3.1 Coverage
3.2 Secondary Research
3.3 Primary Research
3.4 Macro-Economic Factor Analysis
3.5 Developing Base Number
3.6 Data Triangulation
3.7 Country Level Data
3.8 Calculation Base and Assumptions
4. 3D Measurement Sensors in Logistics Market Landscape
4.1 Overview
4.2 PEST Analysis
4.3 Ecosystem Analysis
4.3.1 Component Providers:
4.3.2 Manufacturers:
4.3.3 Distributors or Suppliers:
4.3.4 End Users:
4.3.5 List of Vendors in the Value Chain:
5. 3D Measurement Sensors in Logistics Market - Key Industry Dynamics
5.1 Drivers
5.1.1 Increasing Use of Measurement Sensors in Logistics
5.1.2 Growth of Logistics Industry
5.2 Market Restraints
5.2.1 3D Measurement Sensor Issues
5.3 Market Opportunities
5.3.1 Increasing Deployment of 3D Measurement Sensors in Autonomous Mobile Robots
5.4 Future Trends
5.4.1 Growing Automation in Logistics Industry
5.5 Impact of Drivers and Restraints:
6. 3D Measurement Sensors in Logistics Market - Global Market Analysis
6.1 3D Measurement Sensors in Logistics Market Revenue (US$ Million), 2022 – 2030
7. 3D Measurement Sensors in Logistics Market Analysis - Type
7.1 Image Sensors
7.1.1 Overview
7.1.2 Image Sensors Market Revenue and Forecasts To 2030 (US$ Million)
7.2 Position Sensors
7.2.1 Overview
7.2.2 Position Sensors Market Revenue and Forecasts To 2030 (US$ Million)
7.3 Acoustic Sensors
7.3.1 Overview
7.3.2 Acoustic Sensors Market Revenue and Forecasts To 2030 (US$ Million)
7.4 Others
7.4.1 Overview
7.4.2 Others Market Revenue and Forecasts To 2030 (US$ Million)
8. 3D Measurement Sensors in Logistics Market Analysis - Technology
8.1 Stereo Vision
8.1.1 Overview
8.1.2 Stereo Vision Market Revenue and Forecasts To 2030 (US$ Million)
8.2 Structured Light
8.2.1 Overview
8.2.2 Structured Light Market Revenue and Forecasts To 2030 (US$ Million)
8.3 Laser Light
8.3.1 Overview
8.3.2 Laser Light Market Revenue and Forecasts To 2030 (US$ Million)
8.4 Others
8.4.1 Overview
8.4.2 Others Market Revenue and Forecasts To 2030 (US$ Million)
9. 3D Measurement Sensors in Logistics Market - Geographical Analysis
9.1 North America
9.1.1 North America 3D Measurement Sensors in Logistics Market Overview
9.1.2 North America 3D Measurement Sensors in Logistics Market Revenue and Forecasts to 2030 (US$ Mn)
9.1.3 North America 3D Measurement Sensors in Logistics Market Breakdown by Type
9.1.3.1 North America 3D Measurement Sensors in Logistics Market Revenue and Forecasts To 2030 (US$ Mn) – By Type
9.1.4 North America 3D Measurement Sensors in Logistics Market Breakdown by Technology
9.1.4.1 North America 3D Measurement Sensors in Logistics Market Revenue and Forecasts To 2030 (US$ Mn) – By Technology
9.1.5 North America 3D Measurement Sensors in Logistics Market Revenue and Forecasts and Analysis - By Countries
9.1.5.1 North America 3D Measurement Sensors in Logistics Market, by Country – Revenue and Forecast to 2030 (USD Million)
9.1.5.2 US 3D Measurement Sensors in Logistics Market Revenue and Forecasts to 2030 (US$ Mn)
9.1.5.2.1 US 3D Measurement Sensors in Logistics Market Breakdown by Type
9.1.5.2.2 US 3D Measurement Sensors in Logistics Market Breakdown by Technology
9.1.5.3 Canada 3D Measurement Sensors in Logistics Market Revenue and Forecasts to 2030 (US$ Mn)
9.1.5.3.1 Canada 3D Measurement Sensors in Logistics Market Breakdown by Type
9.1.5.3.2 Canada 3D Measurement Sensors in Logistics Market Breakdown by Technology
9.1.5.4 Mexico 3D Measurement Sensors in Logistics Market Revenue and Forecasts to 2030 (US$ Mn)
9.1.5.4.1 Mexico 3D Measurement Sensors in Logistics Market Breakdown by Type
9.1.5.4.2 Mexico 3D Measurement Sensors in Logistics Market Breakdown by Technology
9.2 Europe
9.2.1 Europe 3D Measurement Sensors in Logistics Market Overview
9.2.2 Europe 3D Measurement Sensors in Logistics Market Revenue and Forecasts to 2030 (US$ Mn)
9.2.3 Europe 3D Measurement Sensors in Logistics Market Breakdown by Type
9.2.3.1 Europe 3D Measurement Sensors in Logistics Market Revenue and Forecasts and Analysis - By Type
9.2.4 Europe 3D Measurement Sensors in Logistics Market Breakdown by Technology
9.2.4.1 Europe 3D Measurement Sensors in Logistics Market Revenue and Forecasts and Analysis - By Technology
9.2.5 Europe 3D Measurement Sensors in Logistics Market Revenue and Forecasts and Analysis - By Countries
9.2.5.1 Germany 3D Measurement Sensors in Logistics Market Revenue and Forecasts to 2030 (US$ Mn)
9.2.5.1.1 Germany 3D Measurement Sensors in Logistics Market Breakdown by Type
9.2.5.1.2 Germany 3D Measurement Sensors in Logistics Market Breakdown by Technology
9.2.5.2 France 3D Measurement Sensors in Logistics Market Revenue and Forecasts to 2030 (US$ Mn)
9.2.5.2.1 France 3D Measurement Sensors in Logistics Market Breakdown by Type
9.2.5.2.2 France 3D Measurement Sensors in Logistics Market Breakdown by Technology
9.2.5.3 Italy 3D Measurement Sensors in Logistics Market Revenue and Forecasts to 2030 (US$ Mn)
9.2.5.3.1 Italy 3D Measurement Sensors in Logistics Market Breakdown by Type
9.2.5.3.2 Italy 3D Measurement Sensors in Logistics Market Breakdown by Technology
9.2.5.4 UK 3D Measurement Sensors in Logistics Market Revenue and Forecasts to 2030 (US$ Mn)
9.2.5.4.1 UK 3D Measurement Sensors in Logistics Market Breakdown by Type
9.2.5.4.2 UK 3D Measurement Sensors in Logistics Market Breakdown by Technology
9.2.5.5 Russia 3D Measurement Sensors in Logistics Market Revenue and Forecasts to 2030 (US$ Mn)
9.2.5.5.1 Russia 3D Measurement Sensors in Logistics Market Breakdown by Type
9.2.5.5.2 Russia 3D Measurement Sensors in Logistics Market Breakdown by Technology
9.2.5.6 Rest of Europe 3D Measurement Sensors in Logistics Market Revenue and Forecasts to 2030 (US$ Mn)
9.2.5.6.1 Rest of Europe 3D Measurement Sensors in Logistics Market Breakdown by Type
9.2.5.6.2 Rest of Europe 3D Measurement Sensors in Logistics Market Breakdown by Technology
9.3 Asia Pacific 3D Measurement Sensors in Logistics Market
9.3.1 Overview
9.3.2 Asia Pacific 3D Measurement Sensors in Logistics Market Revenue and Forecasts To 2030 (US$ Million)
9.3.3 Asia Pacific 3D Measurement Sensors in Logistics Market Breakdown by Type
9.3.3.1 Asia Pacific 3D Measurement Sensors in Logistics Market Revenue and Forecasts and Analysis - By Type
9.3.4 Asia Pacific 3D Measurement Sensors in Logistics Market Breakdown by Technology
9.3.4.1 Asia Pacific 3D Measurement Sensors in Logistics Market Revenue and Forecasts and Analysis - By Technology
9.3.5 3D Measurement Sensors in Logistics market Breakdown by Countries
9.3.5.1 Australia 3D Measurement Sensors in Logistics Market Revenue and Forecasts To 2030 (US$ Million)
9.3.5.1.1 Australia 3D Measurement Sensors in Logistics Market Breakdown by Type
9.3.5.1.2 Australia 3D Measurement Sensors in Logistics Market Breakdown by Technology
9.3.5.2 China 3D Measurement Sensors in Logistics Market Revenue and Forecasts To 2030 (US$ Million)
9.3.5.2.1 China 3D Measurement Sensors in Logistics Market Breakdown by Type
9.3.5.2.2 China 3D Measurement Sensors in Logistics Market Breakdown by Technology
9.3.5.3 India 3D Measurement Sensors in Logistics Market Revenue and Forecasts To 2030 (US$ Million)
9.3.5.3.1 India 3D Measurement Sensors in Logistics Market Breakdown by Type
9.3.5.3.2 India 3D Measurement Sensors in Logistics Market Breakdown by Technology
9.3.5.4 Japan 3D Measurement Sensors in Logistics Market Revenue and Forecasts To 2030 (US$ Million)
9.3.5.4.1 Japan 3D Measurement Sensors in Logistics Market Breakdown by Type
9.3.5.4.2 Japan 3D Measurement Sensors in Logistics Market Breakdown by Technology
9.3.5.5 South Korea 3D Measurement Sensors in Logistics Market Revenue and Forecasts To 2030 (US$ Million)
9.3.5.5.1 South Korea 3D Measurement Sensors in Logistics Market Breakdown by Type
9.3.5.5.2 South Korea 3D Measurement Sensors in Logistics Market Breakdown by Technology
9.3.5.6 Rest of Asia Pacific 3D Measurement Sensors in Logistics Market Revenue and Forecasts To 2030 (US$ Million)
9.3.5.6.1 Rest of Asia Pacific 3D Measurement Sensors in Logistics Market Breakdown by Type
9.3.5.6.2 Rest of Asia Pacific 3D Measurement Sensors in Logistics Market Breakdown by Technology
9.4 Middle East & Africa
9.4.1 Middle East & Africa 3D Measurement Sensors in Logistics Market Overview
9.4.2 Middle East & Africa 3D Measurement Sensors in Logistics Market Revenue and Forecasts to 2030 (US$ Million)
9.4.3 Middle East & Africa 3D Measurement Sensors in Logistics Market Breakdown by Type
9.4.3.1 Middle East & Africa 3D Measurement Sensors in Logistics Market and Forecasts and Analysis - By Type
9.4.4 Middle East & Africa 3D Measurement Sensors in Logistics Market Breakdown by Technology
9.4.4.1 Middle East & Africa 3D Measurement Sensors in Logistics Market and Forecasts and Analysis - By Technology
9.4.5 Middle East & Africa 3D Measurement Sensors in Logistics Market Revenue and Forecasts and Analysis - By Countries
9.4.5.1 South Africa 3D Measurement Sensors in Logistics Market Revenue and Forecasts to 2030 (US$ Million)
9.4.5.1.1 South Africa 3D Measurement Sensors in Logistics Market Breakdown by Type
9.4.5.1.2 South Africa 3D Measurement Sensors in Logistics Market Breakdown by Technology
9.4.5.2 Saudi Arabia 3D Measurement Sensors in Logistics Market Revenue and Forecasts to 2030 (US$ Million)
9.4.5.2.1 Saudi Arabia 3D Measurement Sensors in Logistics Market Breakdown by Type
9.4.5.2.2 Saudi Arabia 3D Measurement Sensors in Logistics Market Breakdown by Technology
9.4.5.3 UAE 3D Measurement Sensors in Logistics Market Revenue and Forecasts to 2030 (US$ Million)
9.4.5.3.1 UAE 3D Measurement Sensors in Logistics Market Breakdown by Type
9.4.5.3.2 UAE 3D Measurement Sensors in Logistics Market Breakdown by Technology
9.4.5.4 Rest of Middle East & Africa 3D Measurement Sensors in Logistics Market Revenue and Forecasts to 2030 (US$ Million)
9.4.5.4.1 Rest of Middle East & Africa 3D Measurement Sensors in Logistics Market Breakdown by Type
9.4.5.4.2 Rest of Middle East & Africa 3D Measurement Sensors in Logistics Market Breakdown by Technology
9.5 South & Central America
9.5.1 South & Central America 3D Measurement Sensors in Logistics Market Overview
9.5.2 South & Central America 3D Measurement Sensors in Logistics Market Revenue and Forecasts to 2030 (US$ Million)
9.5.3 South & Central America 3D Measurement Sensors in Logistics Market Breakdown by Type
9.5.3.1 South & Central America 3D Measurement Sensors in Logistics Market and Forecasts and Analysis - By Type
9.5.4 South & Central America 3D Measurement Sensors in Logistics Market Breakdown by Technology
9.5.4.1 South & Central America 3D Measurement Sensors in Logistics Market Revenue and Forecasts and Analysis - By Technology
9.5.5 South & Central America 3D Measurement Sensors in Logistics Market Revenue and Forecasts and Analysis - By Countries
9.5.5.1 Brazil 3D Measurement Sensors in Logistics Market Revenue and Forecasts to 2030 (US$ Million)
9.5.5.1.1 Brazil 3D Measurement Sensors in Logistics Market Breakdown by Type
9.5.5.1.2 Brazil 3D Measurement Sensors in Logistics Market Breakdown by Technology
9.5.5.2 Argentina 3D Measurement Sensors in Logistics Market Revenue and Forecasts to 2030 (US$ Million)
9.5.5.2.1 Argentina 3D Measurement Sensors in Logistics Market Breakdown by Type
9.5.5.2.2 Argentina 3D Measurement Sensors in Logistics Market Breakdown by Technology
9.5.5.3 Rest of South & Central America 3D Measurement Sensors in Logistics Market Revenue and Forecasts to 2030 (US$ Million)
9.5.5.3.1 Rest of South & Central America 3D Measurement Sensors in Logistics Market Breakdown by Type
9.5.5.3.2 Rest of South & Central America 3D Measurement Sensors in Logistics Market Breakdown by Technology
10. 3D Measurement Sensors in Logistics Market – Impact of COVID-19 Pandemic
10.1 Pre & Post Covid-19 Impact
11. Competitive Landscape
11.1 Heat Map Analysis By Key Players
11.2 Company Positioning & Concentration
12. 3D Measurement Sensors in Logistics Market Industry Landscape
12.1 Overview
12.2 Market Initiative
12.3 Product Development
13. Company Profiles
13.1 Micro-Epsilon Messtechnik GmbH & Co KG
13.1.1 Key Facts
13.1.2 Business Description
13.1.3 Products and Services
13.1.4 Financial Overview
13.1.5 SWOT Analysis
13.1.6 Key Developments
13.2 Infineon Technologies AG
13.2.1 Key Facts
13.2.2 Business Description
13.2.3 Products and Services
13.2.4 Financial Overview
13.2.5 SWOT Analysis
13.2.6 Key Developments
13.3 Sony Semiconductor Solutions Corp
13.3.1 Key Facts
13.3.2 Business Description
13.3.3 Products and Services
13.3.4 Financial Overview
13.3.5 SWOT Analysis
13.3.6 Key Developments
13.4 Cognex Corp
13.4.1 Key Facts
13.4.2 Business Description
13.4.3 Products and Services
13.4.4 Financial Overview
13.4.5 SWOT Analysis
13.4.6 Key Developments
13.5 ifm Electronic GmbH
13.5.1 Key Facts
13.5.2 Business Description
13.5.3 Products and Services
13.5.4 Financial Overview
13.5.5 SWOT Analysis
13.5.6 Key Developments
13.6 Intel Corp
13.6.1 Key Facts
13.6.2 Business Description
13.6.3 Products and Services
13.6.4 Financial Overview
13.6.5 SWOT Analysis
13.6.6 Key Developments
13.7 LMI Technologies Inc
13.7.1 Key Facts
13.7.2 Business Description
13.7.3 Products and Services
13.7.4 Financial Overview
13.7.5 SWOT Analysis
13.7.6 Key Developments
13.8 Keyence Corp
13.8.1 Key Facts
13.8.2 Business Description
13.8.3 Products and Services
13.8.4 Financial Overview
13.8.5 SWOT Analysis
13.8.6 Key Developments
13.9 OMRON Corp
13.9.1 Key Facts
13.9.2 Business Description
13.9.3 Products and Services
13.9.4 Financial Overview
13.9.5 SWOT Analysis
13.9.6 Key Developments
13.10 Sick AG
13.10.1 Key Facts
13.10.2 Business Description
13.10.3 Products and Services
13.10.4 SWOT Analysis
13.10.5 Key Developments
14. Appendix
14.1 Word Index
List of Tables
Table 1. 3D Measurement Sensors in Logistics Market Segmentation
Table 2. 3D Measurement Sensors in Logistics Market Revenue and Forecasts To 2030 (US$ Million) – Type
Table 3. 3D Measurement Sensors in Logistics Market Revenue and Forecasts To 2030 (US$ Million) – Technology
Table 4. North America 3D Measurement Sensors in Logistics Market Revenue and Forecasts To 2030 (US$ Mn) – By Type
Table 5. North America 3D Measurement Sensors in Logistics Market Revenue and Forecasts To 2030 (US$ Mn) – By Technology
Table 6. North America 3D Measurement Sensors in Logistics Market, by Country – Revenue and Forecast to 2030 (USD Million)
Table 7. US 3D Measurement Sensors in Logistics Market Revenue and Forecasts To 2030 (US$ Mn) – By Type
Table 8. US 3D Measurement Sensors in Logistics Market Revenue and Forecasts To 2030 (US$ Mn) – By Technology
Table 9. Canada 3D Measurement Sensors in Logistics Market Revenue and Forecasts To 2030 (US$ Mn) – By Type
Table 10. Canada 3D Measurement Sensors in Logistics Market Revenue and Forecasts To 2030 (US$ Mn) – By Technology
Table 11. Europe 3D Measurement Sensors in Logistics Market Revenue and Forecasts To 2030 (US$ Mn) – By Type
Table 12. Europe 3D Measurement Sensors in Logistics Market Revenue and Forecasts To 2030 (US$ Mn) – By Technology
Table 13. Europe 3D Measurement Sensors in Logistics Market, by Country – Revenue and Forecast to 2030 (USD Million)
Table 14. Germany 3D Measurement Sensors in Logistics Market Revenue and Forecasts To 2030 (US$ Mn) – By Type
Table 15. Germany 3D Measurement Sensors in Logistics Market Revenue and Forecasts To 2030 (US$ Mn) – By Technology
Table 16. France 3D Measurement Sensors in Logistics Market Revenue and Forecasts To 2030 (US$ Mn) – By Type
Table 17. France 3D Measurement Sensors in Logistics Market Revenue and Forecasts To 2030 (US$ Mn) – By Technology
Table 18. Italy 3D Measurement Sensors in Logistics Market Revenue and Forecasts To 2030 (US$ Mn) – By Type
Table 19. Italy 3D Measurement Sensors in Logistics Market Revenue and Forecasts To 2030 (US$ Mn) – By Technology
Table 20. UK 3D Measurement Sensors in Logistics Market Revenue and Forecasts To 2030 (US$ Mn) – By Type
Table 21. UK 3D Measurement Sensors in Logistics Market Revenue and Forecasts To 2030 (US$ Mn) – By Technology
Table 22. Russia 3D Measurement Sensors in Logistics Market Revenue and Forecasts To 2030 (US$ Mn) – By Type
Table 23. Russia 3D Measurement Sensors in Logistics Market Revenue and Forecasts To 2030 (US$ Mn) – By Technology
Table 24. Rest of Europe 3D Measurement Sensors in Logistics Market Revenue and Forecasts To 2030 (US$ Mn) – By Type
Table 25. Rest of Europe 3D Measurement Sensors in Logistics Market Revenue and Forecasts To 2030 (US$ Mn) – By Technology
Table 26. Asia Pacific 3D Measurement Sensors in Logistics Market Revenue And Forecasts To 2030 (US$ Million) – Type
Table 27. Asia Pacific 3D Measurement Sensors in Logistics Market Revenue And Forecasts To 2030 (US$ Million) – Technology
Table 28. Asia Pacific 3D Measurement Sensors in Logistics Market, by Country – Revenue and Forecast to 2030 (USD Million)
Table 29. Australia 3D Measurement Sensors in Logistics Market Revenue And Forecasts To 2030 (US$ Million) – Type
Table 30. Australia 3D Measurement Sensors in Logistics Market Revenue And Forecasts To 2030 (US$ Million) – Technology
Table 31. China 3D Measurement Sensors in Logistics Market Revenue And Forecasts To 2030 (US$ Million) – Type
Table 32. China 3D Measurement Sensors in Logistics Market Revenue And Forecasts To 2030 (US$ Million) – Technology
Table 33. India 3D Measurement Sensors in Logistics Market Revenue And Forecasts To 2030 (US$ Million) – Type
Table 34. India 3D Measurement Sensors in Logistics Market Revenue And Forecasts To 2030 (US$ Million) – Technology
Table 35. Japan 3D Measurement Sensors in Logistics Market Revenue And Forecasts To 2030 (US$ Million) – Type
Table 36. Japan 3D Measurement Sensors in Logistics Market Revenue And Forecasts To 2030 (US$ Million) – Technology
Table 37. South Korea 3D Measurement Sensors in Logistics Market Revenue And Forecasts To 2030 (US$ Million) – Type
Table 38. South Korea 3D Measurement Sensors in Logistics Market Revenue And Forecasts To 2030 (US$ Million) – Technology
Table 39. Rest of Asia Pacific 3D Measurement Sensors in Logistics Market Revenue And Forecasts To 2030 (US$ Million) – Type
Table 40. Rest of Asia Pacific 3D Measurement Sensors in Logistics Market Revenue And Forecasts To 2030 (US$ Million) – Technology
Table 41. Middle East & Africa 3D Measurement Sensors in Logistics Market Revenue and Forecasts To 2030 (US$ Million) – By Type
Table 42. Middle East & Africa 3D Measurement Sensors in Logistics Market Revenue and Forecasts To 2030 (US$ Million) – By Technology
Table 43. Middle East and Africa 3D Measurement Sensors in Logistics Market, by Country – Revenue and Forecast to 2030 (USD Million)
Table 44. South Africa 3D Measurement Sensors in Logistics Market Revenue and Forecasts To 2030 (US$ Million) – By Type
Table 45. South Africa 3D Measurement Sensors in Logistics Market Revenue and Forecasts To 2030 (US$ Million) – By Technology
Table 46. Saudi Arabia 3D Measurement Sensors in Logistics Market Revenue and Forecasts To 2030 (US$ Million) – By Type
Table 47. Saudi Arabia 3D Measurement Sensors in Logistics Market Revenue and Forecasts To 2030 (US$ Million) – By Technology
Table 48. UAE 3D Measurement Sensors in Logistics Market Revenue and Forecasts To 2030 (US$ Million) – By Type
Table 49. UAE 3D Measurement Sensors in Logistics Market Revenue and Forecasts To 2030 (US$ Million) – By Technology
Table 50. Rest of Middle East & Africa 3D Measurement Sensors in Logistics Market Revenue and Forecasts To 2030 (US$ Million) – By Type
Table 51. Rest of Middle East & Africa 3D Measurement Sensors in Logistics Market Revenue and Forecasts To 2030 (US$ Million) – By Technology
Table 52. South & Central America 3D Measurement Sensors in Logistics Market Revenue and Forecasts To 2030 (US$ Million) – By Type
Table 53. South & Central America 3D Measurement Sensors in Logistics Market Revenue and Forecasts To 2030 (US$ Million) – By Technology
Table 54. South and Central America 3D Measurement Sensors in Logistics Market, by Country – Revenue and Forecast to 2030 (USD Million)
Table 55. Brazil 3D Measurement Sensors in Logistics Market Revenue and Forecasts To 2030 (US$ Million) – By Type
Table 56. Brazil 3D Measurement Sensors in Logistics Market Revenue and Forecasts To 2030 (US$ Million) – By Technology
Table 57. Argentina 3D Measurement Sensors in Logistics Market Revenue and Forecasts To 2030 (US$ Million) – By Type
Table 58. Argentina 3D Measurement Sensors in Logistics Market Revenue and Forecasts To 2030 (US$ Million) – By Technology
Table 59. Rest of South & Central America 3D Measurement Sensors in Logistics Market Revenue and Forecasts To 2030 (US$ Million) – By Type
Table 60. Rest of South & Central America 3D Measurement Sensors in Logistics Market Revenue and Forecasts To 2030 (US$ Million) – By Technology
Table 61. Company Positioning & Concentration
Table 62. List of Abbreviation
List of Figures
Figure 1. 3D Measurement Sensors in Logistics Market Segmentation, By Geography
Figure 2. Global– PEST Analysis
Figure 3. Ecosystem: 3D Measurement Sensors in Logistics Market
Figure 4. 3D Measurement Sensors in Logistics Market - Key Industry Dynamics
Figure 5. Impact Analysis of Drivers And Restraints
Figure 6. 3D Measurement Sensors in Logistics Market Revenue (US$ Million), 2022 & 2030
Figure 7. 3D Measurement Sensors in Logistics Market Share (%) – Type, 2022 and 2030
Figure 8. Image Sensors Market Revenue and Forecasts To 2030 (US$ Million)
Figure 9. Position Sensors Market Revenue and Forecasts To 2030 (US$ Million)
Figure 10. Acoustic Sensors Market Revenue and Forecasts To 2030 (US$ Million)
Figure 11. Others Market Revenue and Forecasts To 2030 (US$ Million)
Figure 12. 3D Measurement Sensors in Logistics Market Share (%) – Technology, 2022 and 2030
Figure 13. Stereo Vision Market Revenue and Forecasts To 2030 (US$ Million)
Figure 14. Structured Light Market Revenue and Forecasts To 2030 (US$ Million)
Figure 15. Laser Light Market Revenue and Forecasts To 2030 (US$ Million)
Figure 16. Others Market Revenue and Forecasts To 2030 (US$ Million)
Figure 17. 3D Measurement Sensors in Logistics Market Revenue Share, By Region (2022 & 2030)
Figure 18. 3D Measurement Sensors in Logistics Market Revenue and Forecasts To 2030 (US$ Mn)
Figure 19. 3D Measurement Sensors in Logistics Market Breakdown by Type (2022 and 2030)
Figure 20. 3D Measurement Sensors in Logistics market Breakdown by Technology, 2022 and 2030 (%)
Figure 21. 3D Measurement Sensors in Logistics market Breakdown by Key Countries, 2022 and 2030 (%)
Figure 22. US 3D Measurement Sensors in Logistics Market Revenue and Forecasts To 2030 (US$ Mn)
Figure 23. Canada 3D Measurement Sensors in Logistics Market Revenue and Forecasts To 2030 (US$ Mn)
Figure 24. Mexico 3D Measurement Sensors in Logistics Market Revenue and Forecasts To 2030 (US$ Mn)
Figure 25. 3D Measurement Sensors in Logistics Market Revenue and Forecasts To 2030 (US$ Mn)
Figure 26. 3D Measurement Sensors in Logistics Market Breakdown by Type (2022 and 2030)
Figure 27. 3D Measurement Sensors in Logistics Market Breakdown by Technology (2022 and 2030)
Figure 28. 3D Measurement Sensors in Logistics market Breakdown by Key Countries, 2022 and 2030 (%)
Figure 29. Germany 3D Measurement Sensors in Logistics Market Revenue and Forecasts To 2030 (US$ Mn)
Figure 30. France 3D Measurement Sensors in Logistics Market Revenue and Forecasts To 2030 (US$ Mn)
Figure 31. Italy 3D Measurement Sensors in Logistics Market Revenue and Forecasts To 2030 (US$ Mn)
Figure 32. UK 3D Measurement Sensors in Logistics Market Revenue and Forecasts To 2030 (US$ Mn)
Figure 33. Russia 3D Measurement Sensors in Logistics Market Revenue and Forecasts To 2030 (US$ Mn)
Figure 34. Rest of Europe 3D Measurement Sensors in Logistics Market Revenue and Forecasts To 2030 (US$ Mn)
Figure 35. Asia Pacific 3D Measurement Sensors in Logistics Market Revenue And Forecasts To 2030 (US$ Million)
Figure 36. Asia Pacific 3D Measurement Sensors in Logistics Market Breakdown by Type (2022 and 2023)
Figure 37. Asia Pacific 3D Measurement Sensors in Logistics Market Breakdown by Technology (2022 and 2023)
Figure 38. Asia Pacific 3D Measurement Sensors in Logistics Market Breakdown By Key Countries, 2022 And 2030 (%)
Figure 39. Australia 3D Measurement Sensors in Logistics Market Revenue And Forecasts To 2030 (US$ Million)
Figure 40. China 3D Measurement Sensors in Logistics Market Revenue And Forecasts To 2030 (US$ Million)
Figure 41. India 3D Measurement Sensors in Logistics Market Revenue And Forecasts To 2030 (US$ Million)
Figure 42. Japan 3D Measurement Sensors in Logistics Market Revenue And Forecasts To 2030 (US$ Million)
Figure 43. South Korea 3D Measurement Sensors in Logistics Market Revenue And Forecasts To 2030 (US$ Million)
Figure 44. Rest of Asia Pacific 3D Measurement Sensors in Logistics Market Revenue And Forecasts To 2030 (US$ Million)
Figure 45. 3D Measurement Sensors in Logistics Market Revenue and Forecasts To 2030 (US$ Million)
Figure 46. Middle East & Africa 3D Measurement Sensors in Logistics Market Breakdown by Type (2022 and 2023)
Figure 47. Middle East & Africa 3D Measurement Sensors in Logistics Market Breakdown by Technology (2022 and 2023)
Figure 48. 3D Measurement Sensors in Logistics Market Breakdown by Key Countries, 2022 and 2030 (%)
Figure 49. South Africa 3D Measurement Sensors in Logistics Market Revenue and Forecasts To 2030 (US$ Million)
Figure 50. Saudi Arabia 3D Measurement Sensors in Logistics Market Revenue and Forecasts To 2030 (US$ Million)
Figure 51. UAE 3D Measurement Sensors in Logistics Market Revenue and Forecasts To 2030 (US$ Million)
Figure 52. Rest of Middle East & Africa 3D Measurement Sensors in Logistics Market Revenue and Forecasts To 2030 (US$ Million)
Figure 53. 3D Measurement Sensors in Logistics Market Revenue and Forecasts To 2030 (US$ Million)
Figure 54. South & Central America 3D Measurement Sensors in Logistics Market Breakdown by Type (2022 and 2023)
Figure 55. South & Central America 3D Measurement Sensors in Logistics Market Breakdown by Technology (2022 and 2023)
Figure 56. 3D Measurement Sensors in Logistics Market Breakdown by Key Countries, 2022 and 2030 (%)
Figure 57. Brazil 3D Measurement Sensors in Logistics Market Revenue and Forecasts To 2030 (US$ Million)
Figure 58. Argentina 3D Measurement Sensors in Logistics Market Revenue and Forecasts To 2030 (US$ Million)
Figure 59. Rest of South & Central America 3D Measurement Sensors in Logistics Market Revenue and Forecasts To 2030 (US$ Million)
Figure 60. Heat Map Analysis By Key Players
The List of Companies - 3D Measurement Sensors in Logistics Market
- Micro-Epsilon Messtechnik GmbH & Co KG
- Infineon Technologies AG
- Sony Semiconductor Solutions Corp
- Cognex Corp
- ifm Electronic GmbH
- Intel Corp
- LMI Technologies Inc
- Keyence Corp
- OMRON Corp
- Sick AG
The Insight Partners performs research in 4 major stages: Data Collection & Secondary Research, Primary Research, Data Analysis and Data Triangulation & Final Review.
- Data Collection and Secondary Research:
As a market research and consulting firm operating from a decade, we have published many reports and advised several clients across the globe. First step for any study will start with an assessment of currently available data and insights from existing reports. Further, historical and current market information is collected from Investor Presentations, Annual Reports, SEC Filings, etc., and other information related to company’s performance and market positioning are gathered from Paid Databases (Factiva, Hoovers, and Reuters) and various other publications available in public domain.
Several associations trade associates, technical forums, institutes, societies and organizations are accessed to gain technical as well as market related insights through their publications such as research papers, blogs and press releases related to the studies are referred to get cues about the market. Further, white papers, journals, magazines, and other news articles published in the last 3 years are scrutinized and analyzed to understand the current market trends.
- Primary Research:
The primarily interview analysis comprise of data obtained from industry participants interview and answers to survey questions gathered by in-house primary team.
For primary research, interviews are conducted with industry experts/CEOs/Marketing Managers/Sales Managers/VPs/Subject Matter Experts from both demand and supply side to get a 360-degree view of the market. The primary team conducts several interviews based on the complexity of the markets to understand the various market trends and dynamics which makes research more credible and precise.
A typical research interview fulfils the following functions:
- Provides first-hand information on the market size, market trends, growth trends, competitive landscape, and outlook
- Validates and strengthens in-house secondary research findings
- Develops the analysis team’s expertise and market understanding
Primary research involves email interactions and telephone interviews for each market, category, segment, and sub-segment across geographies. The participants who typically take part in such a process include, but are not limited to:
- Industry participants: VPs, business development managers, market intelligence managers and national sales managers
- Outside experts: Valuation experts, research analysts and key opinion leaders specializing in the electronics and semiconductor industry.
Below is the breakup of our primary respondents by company, designation, and region:

Once we receive the confirmation from primary research sources or primary respondents, we finalize the base year market estimation and forecast the data as per the macroeconomic and microeconomic factors assessed during data collection.
- Data Analysis:
Once data is validated through both secondary as well as primary respondents, we finalize the market estimations by hypothesis formulation and factor analysis at regional and country level.
- 3.1 Macro-Economic Factor Analysis:
We analyse macroeconomic indicators such the gross domestic product (GDP), increase in the demand for goods and services across industries, technological advancement, regional economic growth, governmental policies, the influence of COVID-19, PEST analysis, and other aspects. This analysis aids in setting benchmarks for various nations/regions and approximating market splits. Additionally, the general trend of the aforementioned components aid in determining the market's development possibilities.
- 3.2 Country Level Data:
Various factors that are especially aligned to the country are taken into account to determine the market size for a certain area and country, including the presence of vendors, such as headquarters and offices, the country's GDP, demand patterns, and industry growth. To comprehend the market dynamics for the nation, a number of growth variables, inhibitors, application areas, and current market trends are researched. The aforementioned elements aid in determining the country's overall market's growth potential.
- 3.3 Company Profile:
The “Table of Contents” is formulated by listing and analyzing more than 25 - 30 companies operating in the market ecosystem across geographies. However, we profile only 10 companies as a standard practice in our syndicate reports. These 10 companies comprise leading, emerging, and regional players. Nonetheless, our analysis is not restricted to the 10 listed companies, we also analyze other companies present in the market to develop a holistic view and understand the prevailing trends. The “Company Profiles” section in the report covers key facts, business description, products & services, financial information, SWOT analysis, and key developments. The financial information presented is extracted from the annual reports and official documents of the publicly listed companies. Upon collecting the information for the sections of respective companies, we verify them via various primary sources and then compile the data in respective company profiles. The company level information helps us in deriving the base number as well as in forecasting the market size.
- 3.4 Developing Base Number:
Aggregation of sales statistics (2020-2022) and macro-economic factor, and other secondary and primary research insights are utilized to arrive at base number and related market shares for 2022. The data gaps are identified in this step and relevant market data is analyzed, collected from paid primary interviews or databases. On finalizing the base year market size, forecasts are developed on the basis of macro-economic, industry and market growth factors and company level analysis.
- Data Triangulation and Final Review:
The market findings and base year market size calculations are validated from supply as well as demand side. Demand side validations are based on macro-economic factor analysis and benchmarks for respective regions and countries. In case of supply side validations, revenues of major companies are estimated (in case not available) based on industry benchmark, approximate number of employees, product portfolio, and primary interviews revenues are gathered. Further revenue from target product/service segment is assessed to avoid overshooting of market statistics. In case of heavy deviations between supply and demand side values, all thes steps are repeated to achieve synchronization.
We follow an iterative model, wherein we share our research findings with Subject Matter Experts (SME’s) and Key Opinion Leaders (KOLs) until consensus view of the market is not formulated – this model negates any drastic deviation in the opinions of experts. Only validated and universally acceptable research findings are quoted in our reports.
We have important check points that we use to validate our research findings – which we call – data triangulation, where we validate the information, we generate from secondary sources with primary interviews and then we re-validate with our internal data bases and Subject matter experts. This comprehensive model enables us to deliver high quality, reliable data in shortest possible time.
Trends and growth analysis reports related to 3D Measurement Sensors in Logistics Market

Jul 2023
Remote Access Solution Market
Size and Forecast (2021 - 2031), Global and Regional Share, Trend, and Growth Opportunity Analysis Report Coverage: By Type [Secure Remote Access-VPN, Identity and Access Management (IAM) Solutions, Multi-Factor Authentication, Single Sign-On (SSO), Endpoint Security, and Others], Mode of Deployment (Cloud and On-Premise), End-Use Industry (IT and Telecommunications, BFSI, Healthcare, Government, Manufacturing, and Others), and Geography
Jul 2023
Hall Effect Teslameter Market
Size and Forecast (2021 - 2031), Global and Regional Share, Trend, and Growth Opportunity Analysis Report Coverage: By Type (Analog Hall Effect Teslameters and Digital Hall Effect Teslameters), End Users (Automotive, Industrial, Healthcare, Aerospace, Laboratory, and Others), and Geography
Jul 2023
Automotive Board to Board Connector Market
Size and Forecast (2021 - 2031), Global and Regional Share, Trend, and Growth Opportunity Analysis Report Coverage: By Type (Pin Headers, Sockets, Floating Connector, and Card Edge Connector), Pin Headers (Stacked Headers and Shrouded Headers), Application (Powertrain Control Systems, Infotainment and Navigation Systems, Advanced Driver Assistance Systems (ADAS), Electric Vehicles (EV) and Hybrid Vehicle Systems, Lighting Control Systems, Autonomous Vehicles, and Others), Pitch (Less Than 1 mm, 1–2 mm, and More Than 2 mm), Number of Pin (2–12 Pin, 13–30 Pin, 31–50 Pin, 51–100 Pin, and 100+ Pin), and Geography
Jul 2023
Radiation Hardened Motor Controller and Motor Drive Market
Size and Forecast (2021 - 2031), Global and Regional Share, Trend, and Growth Opportunity Analysis Report Coverage: By Type (Motor Controller and Motor Drive), Motor Drive (AC Drive, DC Drive, and BLDC), Application (Space Exploration, Military and Defense, Nuclear Power Plants, and Others), and Geography
Jul 2023
Pluggable Optics for Data Center Market
Size and Forecast (2021 - 2031), Global and Regional Share, Trend, and Growth Opportunity Analysis Report Coverage: By Component (Switches, Routers, and Servers), Data Rate (100–400 Gb/s, 400–800 Gb/s, and 800 Gb/s and above), and Geography
Jul 2023
Doors and Windows Automation Market
Size and Forecast (2021–2031), Global and Regional Share, Trend, and Growth Opportunity Analysis Report Coverage: By Type (Pedestrian Doors, Industrial Doors, and Windows), Component (Sensors and Detectors, Access Control Systems, Control Panels, Motors and Actuators, and Others), Industry Vertical (Commercial, Industrial, and Residential), Control System (Fully Automatic, Semi-Automatic, and Power Assist), and Geography
Jul 2023
Substrate-Like PCB Market
Size and Forecast (2021 - 2031), Global and Regional Share, Trend, and Growth Opportunity Analysis Report Coverage: By Line/Space (25/25 and 30/30 µm and Less than 25/25 µm), Fabrication Process (MSAP and UV LDI), Application (Consumer Electronics, Automotive, Industrial, Medical, and Others), and Geography
Jul 2023
LED Flashlight Market
Size and Forecast (2021 - 2031), Global and Regional Share, Trend, and Growth Opportunity Analysis Report Coverage: By Type (Rechargeable LED Flashlight and Non-Rechargeable LED Flashlight), Product (Everyday Carry Flashlights, Tactical Flashlights, and Safety Flashlights), Application (Residential, Commercial, and Military and Law Enforcement), and Geography
 Get Free Sample For