The 3D stacking market size is expected to reach US$ 5.94 billion by 2031 from US$ 1.81 billion in 2023. The market is estimated to record a CAGR of 16.0% from 2023 to 2031. The adoption of fast processors for gaming purposes is likely to remain a key market trend.
3D Stacking Market Analysis
Shorter interconnects within a 3D stacked configuration result in reduced power consumption and improved signal integrity, making it an attractive solution for energy-efficient and high-performance applications. The growing adoption of 3D stacking technology is a key factor contributing to the 3D stacking market growth. This technology allows for the stacking of dies on a substrate, creating chips in packages that are smaller and more energy-efficient. Additionally, 3D stacking technology facilitates the development of innovative, feature-rich products, particularly in the consumer electronics sector. The ability to stack memory and logic components vertically allows for the creation of more powerful and compact devices—which align with the market demand for sleek, high-performance gadgets.
3D Stacking Market Overview
3D stacking technology represents a transformative advancement in the field of semiconductor packaging, offering a paradigm shift in the way electronic components are integrated and interconnected. This cutting-edge technology involves vertically stacking multiple integrated circuit (IC) layers, typically using through-silicon vias (TSVs) to establish connections between the stacked layers. 3D stacking technology holds the potential to revolutionize product design and performance across various industries to achieve superior functionality in a more compact form factor. Furthermore, this technology empowers businesses to stay at the forefront of technological innovation, fostering a competitive position in the rapidly evolving landscape of electronic devices and semiconductor solutions. 3D stacking technology enables the efficient integration of disparate components, such as memory, logic, and sensors, into a single package, leading to enhanced performance and reduced footprint. This technology helps in providing streamlined manufacturing processes, optimized supply chain management, and cost savings.
Customize Research To Suit Your Requirement
We can optimize and tailor the analysis and scope which is unmet through our standard offerings. This flexibility will help you gain the exact information needed for your business planning and decision making.
3D Stacking Market: Strategic Insights
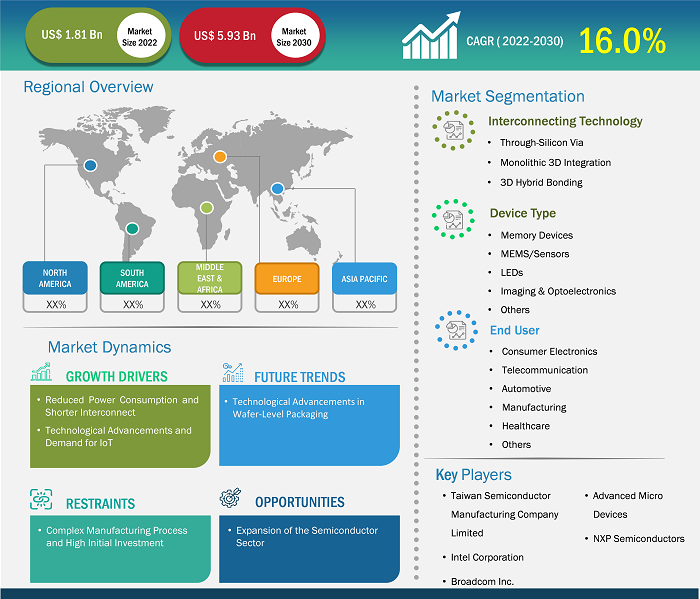
Market Size Value in US$ 1.81 billion in 2022 Market Size Value by US$ 5.93 billion by 2030 Growth rate CAGR of 16.0% from 2022 to 2030 Forecast Period 2022-2030 Base Year 2022

Naveen
Have a question?
Naveen will walk you through a 15-minute call to present the report’s content and answer all queries if you have any.
 Speak to Analyst
Customize Research To Suit Your Requirement
We can optimize and tailor the analysis and scope which is unmet through our standard offerings. This flexibility will help you gain the exact information needed for your business planning and decision making.
3D Stacking Market: Strategic Insights
| Market Size Value in | US$ 1.81 billion in 2022 |
| Market Size Value by | US$ 5.93 billion by 2030 |
| Growth rate | CAGR of 16.0% from 2022 to 2030 |
| Forecast Period | 2022-2030 |
| Base Year | 2022 |
Naveen
Have a question?
Naveen will walk you through a 15-minute call to present the report’s content and answer all queries if you have any.
Speak to Analyst
3D Stacking Market Drivers and Opportunities
Rising Demand for Consumer Electronics to Favor Market
The proliferating demand for sleek, feature-rich, and power-efficient gadgets such as smartphones, tablets, smartwatches, and portable devices has led to immense pressure on manufacturers to deliver compact, high-performance solutions. For instance, according to Omdia data published in February 2024, the preliminary shipment of smartphones was 328 million units in the fourth quarter of 2023. This represents 8.6% gain over 4Q22, establishing 4Q23 as the first quarter to show major growth since 2Q21. Consumers across the globe are highly adopting smartphones for shopping, communication, entertainment, and other purposes. These devices use 3D stacked die packaging, which is revolutionizing their designs and functionality. 3D stacked die packaging is capable of significantly reducing form factors without compromising performance. By vertically stacking multiple layers of integrated circuits, this technology allows for the smooth integration of diverse components within a compact space. This consolidation not only streamlines the design and assembly processes but also enables manufacturers to create thin, more aesthetically appealing devices that align with the evolving preferences of consumers.
Surge in Demand for High-Bandwidth Memory
High-bandwidth memory (HBM), which reaches extremely high density by stacking numerous dynamic random access memory (DRAMs) vertically, is distinguished by rapid data processing and low power consumption. It is essential in high-performance computing (HPC), such as generative AI, which requires processing enormous amounts of data at significantly fast speeds. Samsung Electronics 12-layer stacked HBM uses next-generation 3D stacking packaging technique to boost performance and yield. With a processing speed of 6.4Gbps and a bandwidth of 819 GB/s, HBM3 is 1.8 times faster than the previous-generation DRAM while using 10% less power. The demand for HBM in high-performance computing applications encourages market players to increase their production. For instance, in March 2024, SK HYNIX INC started volume production of HBM3E1, the newest AI memory product with ultra-high performance. HBM3E is designed for an AI system that processes a huge amount of data quickly. The high-bandwidth memory is used by various industries, including telecommunication, automotive, healthcare, and manufacturing, for high-speed data processing.
3D Stacking Market Report Segmentation Analysis
Key segments that contributed to the derivation of the 3D stacking market analysis are technology, device type, and end user.
- Based on technology, the 3D stacking market is segmented into through-silicon via, monolithic 3D integration, and 3d hybrid bonding. The through-silicon via segment held a larger market share in 2023.
- Based on device type, the 3D stacking market is segmented into memory devices, mems/sensors, leds, imaging & optoelectronics, and others. The memory devices segment dominated the market in 2023.
- In terms of end user, the 3D stacking market is segmented into consumer electronics, telecommunication, automotive, manufacturing, healthcare, and others. The consumer electronics segment dominated the market in 2023.
3D Stacking Market Share Analysis by Geography
- The 3D stacking market is segmented into five major regions—North America, Europe, Asia Pacific (APAC), the Middle East & Africa (MEA), and South & Central America. Asia Pacific dominated the market in 2023, followed by North America and Europe.
- The 3D stacking market growth in Asia Pacific is attributed to the growing deman from semiconductor manufacturing and consumer electronics. According to the Asia Pacific Foundation, China and Taiwan have significantly boosted investments in chip manufacturing, which is also expected to benefit South Korea and Japan. Also, the Taiwan Semiconductor Manufacturing Company planned to set up its first factory in Japan, which aligned with the Japanese Prime Minister's agenda of prioritizing semiconductor manufacturing to further expand domestic supply chains. Moreover, expanding of the semiconductor manufacturing and consumer electronics industries are anticipated to create lucrative opportunities for the market growth during the forecast period.
3D Stacking Market Report Scope
3D Stacking Market News and Recent Developments
The 3D stacking market is evaluated by gathering qualitative and quantitative data post primary and secondary research, which includes important corporate publications, association data, and databases. A few of the developments in the 3D stacking market are listed below:
- Intel researchers showcased advancements in 3D stacked complementary metal oxide semiconductor (CMOS) transistors combined with backside power and direct backside contacts at the 2023 IEEE International Electron Devices Meeting (IEDM). The company also reported on scaling paths for recent R&D breakthroughs for backside power delivery, such as backside contacts, and it was the first to demonstrate successful large-scale 3D monolithic integration of silicon transistors with gallium nitride (GaN) transistors on the same 300-millimeter (mm) wafer, rather than on the package. (Source: Intel Corp, Press Release, December 2023)
3D Stacking Market Report Coverage and Deliverables
The "3D Stacking Market Size and Forecast (2021–2031)" provides a detailed analysis of the market covering the areas mentioned below:
- 3D stacking market size and forecast at global, regional, and country levels for all the key market segments covered under the scope
- 3D stacking market trends as well as market dynamics such as drivers, restraints, and key opportunities
- Detailed PEST/Porter’s Five Forces and SWOT analysis
- 3D stacking market analysis covering key market trends, global and regional framework, major players, regulations, and recent market developments
- Industry landscape and competition analysis covering market concentration, heat map analysis, prominent players, and recent developments for the 3D stacking market
- Detailed company profiles

Report Coverage
Revenue forecast, Company Analysis, Industry landscape, Growth factors, and Trends

Segment Covered
Interconnecting Technology, Device Type, End User, and Geography

Regional Scope
North America, Europe, Asia Pacific, Middle East & Africa, South & Central America

Country Scope
This text is related
to country scope.
Frequently Asked Questions
The key players holding majority shares in the global 3D stacking market are Taiwan Semiconductor Manufacturing Company Limited, Intel Corp, Advanced Micro Devices, Broadcom Inc., NXP Semiconductors, ASE Technology, Texas Instruments Incorporated, MediaTek Inc., Amkor Technology, and Samsung Semiconductor, Inc.
Asia Pacific dominated the 3D stacking market in 2023.
The rising demand for consumer electronic is the major factors that propel the global 3D stacking market.
The global 3D stacking market is estimated to register a CAGR of 16.0% during the forecast period 2023–2031.
The global 3D stacking market is expected to reach US$ 5.94 billion by 2031.
Adotion of fast processors for gaming purposes to play a significant role in the global 3D stacking market in the coming years.
1. Introduction
1.1 The Insight Partners Research Report Guidance
1.2 Market Segmentation
2. Executive Summary
2.1 Key Insights
2.2 Market Attractiveness
3. Research Methodology
3.1 Secondary Research
3.2 Primary Research
3.2.1 Hypothesis formulation:
3.2.2 Macro-economic factor analysis:
3.2.3 Developing base number:
3.2.4 Data Triangulation:
3.2.5 Country level data:
4. 3D Stacking Market Landscape
4.1 Overview
4.2 PEST Analysis
4.3 Ecosystem Analysis
4.3.1 List of Vendors in the Value Chain
5. 3D Stacking Market – Key Market Dynamics
5.1 3D Stacking Market – Key Market Dynamics
5.2 Market Drivers
5.2.1 Rising Demand for Consumer Electronics
5.2.2 Increasing Use of Heterogeneous Integration and Component Optimization
5.3 Market Restraints
5.3.1 Complexity Associated with 3D Stacking Technology
5.4 Market Opportunities
5.4.1 Surge in Demand for High-Bandwidth Memory
5.5 Future Trends
5.5.1 Fast Processors for Gaming Purposes
5.6 Impact of Drivers and Restraints:
6. 3D Stacking Market – Global Market Analysis
6.1 3D Stacking Market Revenue (US$ Million), 2021–2031
6.2 3D Stacking Market Forecast Analysis
7. 3D Stacking Market Analysis – by Interconnecting Technology
7.1 Through-Silicon Via
7.1.1 Overview
7.1.2 Through-Silicon Via: 3D Stacking Market – Revenue and Forecast to 2031 (US$ Million)
7.2 Monolithic 3D Integration
7.2.1 Overview
7.2.2 Monolithic 3D Integration: 3D Stacking Market – Revenue and Forecast to 2031 (US$ Million)
7.3 3D Hybrid Bonding
7.3.1 Overview
7.3.2 3D Hybrid Bonding: 3D Stacking Market – Revenue and Forecast to 2031 (US$ Million)
8. 3D Stacking Market Analysis – by Device Type
8.1 Memory Devices
8.1.1 Overview
8.1.2 Memory Devices: 3D Stacking Market – Revenue and Forecast to 2031 (US$ Million)
8.2 MEMS/Sensors
8.2.1 Overview
8.2.2 MEMS/Sensors: 3D Stacking Market – Revenue and Forecast to 2031 (US$ Million)
8.3 LEDs
8.3.1 Overview
8.3.2 LEDs: 3D Stacking Market – Revenue and Forecast to 2031 (US$ Million)
8.4 Imaging and Optoelectronics
8.4.1 Overview
8.4.2 Imaging and Optoelectronics: 3D Stacking Market – Revenue and Forecast to 2031 (US$ Million)
8.5 Others
8.5.1 Overview
8.5.2 Others: 3D Stacking Market – Revenue and Forecast to 2031 (US$ Million)
9. 3D Stacking Market Analysis – by End User
9.1 Consumer Electronics
9.1.1 Overview
9.1.2 Consumer Electronics: 3D Stacking Market – Revenue and Forecast to 2031 (US$ Million)
9.2 Telecommunication
9.2.1 Overview
9.2.2 Telecommunication: 3D Stacking Market – Revenue and Forecast to 2031 (US$ Million)
9.3 Automotive
9.3.1 Overview
9.3.2 Automotive: 3D Stacking Market – Revenue and Forecast to 2031 (US$ Million)
9.4 Manufacturing
9.4.1 Overview
9.4.2 Manufacturing: 3D Stacking Market – Revenue and Forecast to 2031 (US$ Million)
9.5 Healthcare
9.5.1 Overview
9.5.2 Healthcare: 3D Stacking Market – Revenue and Forecast to 2031 (US$ Million)
9.6 Others
9.6.1 Overview
9.6.2 Others: 3D Stacking Market – Revenue and Forecast to 2031 (US$ Million)
10. 3D Stacking Market – Geographical Analysis
10.1 Overview
10.2 North America
10.2.1 North America 3D Stacking Market Overview
10.2.2 North America: 3D Stacking Market – Revenue and Forecast to 2031 (US$ Million)
10.2.3 North America: 3D Stacking Market Breakdown, by Interconnecting Technology
10.2.3.1 North America: 3D Stacking Market – Revenue and Forecast Analysis – by Interconnecting Technology
10.2.4 North America: 3D Stacking Market Breakdown, by Device Type
10.2.4.1 North America: 3D Stacking Market – Revenue and Forecast Analysis – by Device Type
10.2.5 North America: 3D Stacking Market Breakdown, by End User
10.2.5.1 North America: 3D Stacking Market – Revenue and Forecast Analysis – by End User
10.2.6 North America: 3D Stacking Market – Revenue and Forecast Analysis – by Country
10.2.6.1 North America: 3D Stacking Market – Revenue and Forecast Analysis – by Country
10.2.6.2 United States: 3D Stacking Market – Revenue and Forecast to 2031 (US$ Million)
10.2.6.2.1 United States: 3D Stacking Market Breakdown, by Interconnecting Technology
10.2.6.2.2 United States: 3D Stacking Market Breakdown, by Device Type
10.2.6.2.3 United States: 3D Stacking Market Breakdown, by End User
10.2.6.3 Canada: 3D Stacking Market – Revenue and Forecast to 2031 (US$ Million)
10.2.6.3.1 Canada: 3D Stacking Market Breakdown, by Interconnecting Technology
10.2.6.3.2 Canada: 3D Stacking Market Breakdown, by Device Type
10.2.6.3.3 Canada: 3D Stacking Market Breakdown, by End User
10.2.6.4 Mexico: 3D Stacking Market – Revenue and Forecast to 2031 (US$ Million)
10.2.6.4.1 Mexico: 3D Stacking Market Breakdown, by Interconnecting Technology
10.2.6.4.2 Mexico: 3D Stacking Market Breakdown, by Device Type
10.2.6.4.3 Mexico: 3D Stacking Market Breakdown, by End User
10.3 Europe
10.3.1 Europe 3D Stacking Market Overview
10.3.2 Europe: 3D Stacking Market – Revenue and Forecast to 2031 (US$ Million)
10.3.3 Europe: 3D Stacking Market Breakdown, by Interconnecting Technology
10.3.3.1 Europe: 3D Stacking Market – Revenue and Forecast Analysis – by Interconnecting Technology
10.3.4 Europe: 3D Stacking Market Breakdown, by Device Type
10.3.4.1 Europe: 3D Stacking Market – Revenue and Forecast Analysis – by Device Type
10.3.5 Europe: 3D Stacking Market Breakdown, by End User
10.3.5.1 Europe: 3D Stacking Market – Revenue and Forecast Analysis – by End User
10.3.6 Europe: 3D Stacking Market – Revenue and Forecast Analysis – by Country
10.3.6.1 Europe: 3D Stacking Market – Revenue and Forecast Analysis – by Country
10.3.6.2 United Kingdom: 3D Stacking Market – Revenue and Forecast to 2031 (US$ Million)
10.3.6.2.1 United Kingdom: 3D Stacking Market Breakdown, by Interconnecting Technology
10.3.6.2.2 United Kingdom: 3D Stacking Market Breakdown, by Device Type
10.3.6.2.3 United Kingdom: 3D Stacking Market Breakdown, by End User
10.3.6.3 Germany: 3D Stacking Market – Revenue and Forecast to 2031 (US$ Million)
10.3.6.3.1 Germany: 3D Stacking Market Breakdown, by Interconnecting Technology
10.3.6.3.2 Germany: 3D Stacking Market Breakdown, by Device Type
10.3.6.3.3 Germany: 3D Stacking Market Breakdown, by End User
10.3.6.4 France: 3D Stacking Market – Revenue and Forecast to 2031 (US$ Million)
10.3.6.4.1 France: 3D Stacking Market Breakdown, by Interconnecting Technology
10.3.6.4.2 France: 3D Stacking Market Breakdown, by Device Type
10.3.6.4.3 France: 3D Stacking Market Breakdown, by End User
10.3.6.5 Italy: 3D Stacking Market – Revenue and Forecast to 2031 (US$ Million)
10.3.6.5.1 Italy: 3D Stacking Market Breakdown, by Interconnecting Technology
10.3.6.5.2 Italy: 3D Stacking Market Breakdown, by Device Type
10.3.6.5.3 Italy: 3D Stacking Market Breakdown, by End User
10.3.6.6 Russia: 3D Stacking Market – Revenue and Forecast to 2031 (US$ Million)
10.3.6.6.1 Russia: 3D Stacking Market Breakdown, by Interconnecting Technology
10.3.6.6.2 Russia: 3D Stacking Market Breakdown, by Device Type
10.3.6.6.3 Russia: 3D Stacking Market Breakdown, by End User
10.3.6.7 Rest of Europe: 3D Stacking Market – Revenue and Forecast to 2031 (US$ Million)
10.3.6.7.1 Rest of Europe: 3D Stacking Market Breakdown, by Interconnecting Technology
10.3.6.7.2 Rest of Europe: 3D Stacking Market Breakdown, by Device Type
10.3.6.7.3 Rest of Europe: 3D Stacking Market Breakdown, by End User
10.4 Asia Pacific
10.4.1 Asia Pacific 3D Stacking Market Overview
10.4.2 Asia Pacific: 3D Stacking Market – Revenue and Forecast to 2031 (US$ Million)
10.4.3 Asia Pacific: 3D Stacking Market Breakdown, by Interconnecting Technology
10.4.3.1 Asia Pacific: 3D Stacking Market – Revenue and Forecast Analysis – by Interconnecting Technology
10.4.4 Asia Pacific: 3D Stacking Market Breakdown, by Device Type
10.4.4.1 Asia Pacific: 3D Stacking Market – Revenue and Forecast Analysis – by Device Type
10.4.5 Asia Pacific: 3D Stacking Market Breakdown, by End User
10.4.5.1 Asia Pacific: 3D Stacking Market – Revenue and Forecast Analysis – by End User
10.4.6 Asia Pacific: 3D Stacking Market – Revenue and Forecast Analysis – by Country
10.4.6.1 Asia Pacific: 3D Stacking Market – Revenue and Forecast Analysis – by Country
10.4.6.2 India: 3D Stacking Market – Revenue and Forecast to 2031 (US$ Million)
10.4.6.2.1 India: 3D Stacking Market Breakdown, by Interconnecting Technology
10.4.6.2.2 India: 3D Stacking Market Breakdown, by Device Type
10.4.6.2.3 India: 3D Stacking Market Breakdown, by End User
10.4.6.3 China: 3D Stacking Market – Revenue and Forecast to 2031 (US$ Million)
10.4.6.3.1 China: 3D Stacking Market Breakdown, by Interconnecting Technology
10.4.6.3.2 China: 3D Stacking Market Breakdown, by Device Type
10.4.6.3.3 China: 3D Stacking Market Breakdown, by End User
10.4.6.4 Japan: 3D Stacking Market – Revenue and Forecast to 2031 (US$ Million)
10.4.6.4.1 Japan: 3D Stacking Market Breakdown, by Interconnecting Technology
10.4.6.4.2 Japan: 3D Stacking Market Breakdown, by Device Type
10.4.6.4.3 Japan: 3D Stacking Market Breakdown, by End User
10.4.6.5 South Korea: 3D Stacking Market – Revenue and Forecast to 2031 (US$ Million)
10.4.6.5.1 South Korea: 3D Stacking Market Breakdown, by Interconnecting Technology
10.4.6.5.2 South Korea: 3D Stacking Market Breakdown, by Device Type
10.4.6.5.3 South Korea: 3D Stacking Market Breakdown, by End User
10.4.6.6 Taiwan: 3D Stacking Market – Revenue and Forecast to 2031 (US$ Million)
10.4.6.6.1 Taiwan: 3D Stacking Market Breakdown, by Interconnecting Technology
10.4.6.6.2 Taiwan: 3D Stacking Market Breakdown, by Device Type
10.4.6.6.3 Taiwan: 3D Stacking Market Breakdown, by End User
10.4.6.7 Australia: 3D Stacking Market – Revenue and Forecast to 2031 (US$ Million)
10.4.6.7.1 Australia: 3D Stacking Market Breakdown, by Interconnecting Technology
10.4.6.7.2 Australia: 3D Stacking Market Breakdown, by Device Type
10.4.6.7.3 Australia: 3D Stacking Market Breakdown, by End User
10.4.6.8 Rest of APAC: 3D Stacking Market – Revenue and Forecast to 2031 (US$ Million)
10.4.6.8.1 Rest of APAC: 3D Stacking Market Breakdown, by Interconnecting Technology
10.4.6.8.2 Rest of APAC: 3D Stacking Market Breakdown, by Device Type
10.4.6.8.3 Rest of APAC: 3D Stacking Market Breakdown, by End User
10.5 Middle East and Africa
10.5.1 Middle East and Africa 3D Stacking Market Overview
10.5.2 Middle East and Africa: 3D Stacking Market – Revenue and Forecast to 2031 (US$ Million)
10.5.3 Middle East and Africa: 3D Stacking Market Breakdown, by Interconnecting Technology
10.5.3.1 Middle East and Africa: 3D Stacking Market – Revenue and Forecast Analysis – by Interconnecting Technology
10.5.4 Middle East and Africa: 3D Stacking Market Breakdown, by Device Type
10.5.4.1 Middle East and Africa: 3D Stacking Market – Revenue and Forecast Analysis – by Device Type
10.5.5 Middle East and Africa: 3D Stacking Market Breakdown, by End User
10.5.5.1 Middle East and Africa: 3D Stacking Market – Revenue and Forecast Analysis – by End User
10.5.6 Middle East and Africa: 3D Stacking Market – Revenue and Forecast Analysis – by Country
10.5.6.1 Middle East and Africa: 3D Stacking Market – Revenue and Forecast Analysis – by Country
10.5.6.2 Saudi Arabia: 3D Stacking Market – Revenue and Forecast to 2031 (US$ Million)
10.5.6.2.1 Saudi Arabia: 3D Stacking Market Breakdown, by Interconnecting Technology
10.5.6.2.2 Saudi Arabia: 3D Stacking Market Breakdown, by Device Type
10.5.6.2.3 Saudi Arabia: 3D Stacking Market Breakdown, by End User
10.5.6.3 United Arab Emirates: 3D Stacking Market – Revenue and Forecast to 2031 (US$ Million)
10.5.6.3.1 United Arab Emirates: 3D Stacking Market Breakdown, by Interconnecting Technology
10.5.6.3.2 United Arab Emirates: 3D Stacking Market Breakdown, by Device Type
10.5.6.3.3 United Arab Emirates: 3D Stacking Market Breakdown, by End User
10.5.6.4 South Africa: 3D Stacking Market – Revenue and Forecast to 2031 (US$ Million)
10.5.6.4.1 South Africa: 3D Stacking Market Breakdown, by Interconnecting Technology
10.5.6.4.2 South Africa: 3D Stacking Market Breakdown, by Device Type
10.5.6.4.3 South Africa: 3D Stacking Market Breakdown, by End User
10.5.6.5 Rest of Middle East and Africa: 3D Stacking Market – Revenue and Forecast to 2031 (US$ Million)
10.5.6.5.1 Rest of Middle East and Africa: 3D Stacking Market Breakdown, by Interconnecting Technology
10.5.6.5.2 Rest of Middle East and Africa: 3D Stacking Market Breakdown, by Device Type
10.5.6.5.3 Rest of Middle East and Africa: 3D Stacking Market Breakdown, by End User
10.6 South and Central America
10.6.1 South and Central America 3D Stacking Market Overview
10.6.2 South and Central America: 3D Stacking Market – Revenue and Forecast to 2031 (US$ Million)
10.6.3 South and Central America: 3D Stacking Market Breakdown, by Interconnecting Technology
10.6.3.1 South and Central America: 3D Stacking Market – Revenue and Forecast Analysis – by Interconnecting Technology
10.6.4 South and Central America: 3D Stacking Market Breakdown, by Device Type
10.6.4.1 South and Central America: 3D Stacking Market – Revenue and Forecast Analysis – by Device Type
10.6.5 South and Central America: 3D Stacking Market Breakdown, by End User
10.6.5.1 South and Central America: 3D Stacking Market – Revenue and Forecast Analysis – by End User
10.6.6 South and Central America: 3D Stacking Market – Revenue and Forecast Analysis – by Country
10.6.6.1 South and Central America: 3D Stacking Market – Revenue and Forecast Analysis – by Country
10.6.6.2 Brazil: 3D Stacking Market – Revenue and Forecast to 2031 (US$ Million)
10.6.6.2.1 Brazil: 3D Stacking Market Breakdown, by Interconnecting Technology
10.6.6.2.2 Brazil: 3D Stacking Market Breakdown, by Device Type
10.6.6.2.3 Brazil: 3D Stacking Market Breakdown, by End User
10.6.6.3 Argentina: 3D Stacking Market – Revenue and Forecast to 2031 (US$ Million)
10.6.6.3.1 Argentina: 3D Stacking Market Breakdown, by Interconnecting Technology
10.6.6.3.2 Argentina: 3D Stacking Market Breakdown, by Device Type
10.6.6.3.3 Argentina: 3D Stacking Market Breakdown, by End User
10.6.6.4 Rest of South and Central America: 3D Stacking Market – Revenue and Forecast to 2031 (US$ Million)
10.6.6.4.1 Rest of South and Central America: 3D Stacking Market Breakdown, by Interconnecting Technology
10.6.6.4.2 Rest of South and Central America: 3D Stacking Market Breakdown, by Device Type
10.6.6.4.3 Rest of South and Central America: 3D Stacking Market Breakdown, by End User
11. Competitive Landscape
11.1 Heat Map Analysis By Key Players
11.2 Company Positioning & Concentration
12. Industry Landscape
12.1 Overview
12.2 Market Initiative
12.3 Product Development
13. Company Profiles
13.1 Taiwan Semiconductor Manufacturing Co Ltd
13.1.1 Key Facts
13.1.2 Business Description
13.1.3 Products and Services
13.1.4 Financial Overview
13.1.5 SWOT Analysis
13.1.6 Key Developments
13.2 Samsung Electronics Co Ltd
13.2.1 Key Facts
13.2.2 Business Description
13.2.3 Products and Services
13.2.4 Financial Overview
13.2.5 SWOT Analysis
13.2.6 Key Developments
13.3 Intel Corp
13.3.1 Key Facts
13.3.2 Business Description
13.3.3 Products and Services
13.3.4 Financial Overview
13.3.5 SWOT Analysis
13.3.6 Key Developments
13.4 MediaTek Inc
13.4.1 Key Facts
13.4.2 Business Description
13.4.3 Products and Services
13.4.4 Financial Overview
13.4.5 SWOT Analysis
13.4.6 Key Developments
13.5 Texas Instruments Inc
13.5.1 Key Facts
13.5.2 Business Description
13.5.3 Products and Services
13.5.4 Financial Overview
13.5.5 SWOT Analysis
13.5.6 Key Developments
13.6 Amkor Technology Inc
13.6.1 Key Facts
13.6.2 Business Description
13.6.3 Products and Services
13.6.4 Financial Overview
13.6.5 SWOT Analysis
13.6.6 Key Developments
13.7 ASE Technology Holding Co Ltd
13.7.1 Key Facts
13.7.2 Business Description
13.7.3 Products and Services
13.7.4 Financial Overview
13.7.5 SWOT Analysis
13.7.6 Key Developments
13.8 Advanced Micro Devices Inc
13.8.1 Key Facts
13.8.2 Business Description
13.8.3 Products and Services
13.8.4 Financial Overview
13.8.5 SWOT Analysis
13.8.6 Key Developments
13.9 3M Co
13.9.1 Key Facts
13.9.2 Business Description
13.9.3 Products and Services
13.9.4 Financial Overview
13.9.5 SWOT Analysis
13.9.6 Key Developments
13.10 Globalfoundries Inc
13.10.1 Key Facts
13.10.2 Business Description
13.10.3 Products and Services
13.10.4 Financial Overview
13.10.5 SWOT Analysis
13.10.6 Key Developments
14. Appendix
14.1 About The Insight Partners
14.2 Word Index
List of Tables
Table 1. 3D Stacking Market Segmentation
Table 2. List of Vendors
Table 3. 3D Stacking Market – Revenue and Forecast to 2031 (US$ Million)
Table 4. 3D Stacking Market – Revenue and Forecast to 2031 (US$ Million) – by Interconnecting Technology
Table 5. 3D Stacking Market – Revenue and Forecast to 2031 (US$ Million) – by Device Type
Table 6. 3D Stacking Market – Revenue and Forecast to 2031 (US$ Million) – by End User
Table 7. North America: 3D Stacking Market – Revenue and Forecast to 2031(US$ Million) – by Interconnecting Technology
Table 8. North America: 3D Stacking Market – Revenue and Forecast to 2031(US$ Million) – by Device Type
Table 9. North America: 3D Stacking Market – Revenue and Forecast to 2031(US$ Million) – by End User
Table 10. North America: 3D Stacking Market – Revenue and Forecast to 2031(US$ Million) – by Country
Table 11. United States: 3D Stacking Market – Revenue and Forecast to 2031(US$ Million) – by Interconnecting Technology
Table 12. United States: 3D Stacking Market – Revenue and Forecast to 2031(US$ Million) – by Device Type
Table 13. United States: 3D Stacking Market – Revenue and Forecast to 2031(US$ Million) – by End User
Table 14. Canada: 3D Stacking Market – Revenue and Forecast to 2031(US$ Million) – by Interconnecting Technology
Table 15. Canada: 3D Stacking Market – Revenue and Forecast to 2031(US$ Million) – by Device Type
Table 16. Canada: 3D Stacking Market – Revenue and Forecast to 2031(US$ Million) – by End User
Table 17. Mexico: 3D Stacking Market – Revenue and Forecast to 2031(US$ Million) – by Interconnecting Technology
Table 18. Mexico: 3D Stacking Market – Revenue and Forecast to 2031(US$ Million) – by Device Type
Table 19. Mexico: 3D Stacking Market – Revenue and Forecast to 2031(US$ Million) – by End User
Table 20. Europe: 3D Stacking Market – Revenue and Forecast to 2031(US$ Million) – by Interconnecting Technology
Table 21. Europe: 3D Stacking Market – Revenue and Forecast to 2031(US$ Million) – by Device Type
Table 22. Europe: 3D Stacking Market – Revenue and Forecast to 2031(US$ Million) – by End User
Table 23. Europe: 3D Stacking Market – Revenue and Forecast to 2031(US$ Million) – by Country
Table 24. United Kingdom: 3D Stacking Market – Revenue and Forecast to 2031(US$ Million) – by Interconnecting Technology
Table 25. United Kingdom: 3D Stacking Market – Revenue and Forecast to 2031(US$ Million) – by Device Type
Table 26. United Kingdom: 3D Stacking Market – Revenue and Forecast to 2031(US$ Million) – by End User
Table 27. Germany: 3D Stacking Market – Revenue and Forecast to 2031(US$ Million) – by Interconnecting Technology
Table 28. Germany: 3D Stacking Market – Revenue and Forecast to 2031(US$ Million) – by Device Type
Table 29. Germany: 3D Stacking Market – Revenue and Forecast to 2031(US$ Million) – by End User
Table 30. France: 3D Stacking Market – Revenue and Forecast to 2031(US$ Million) – by Interconnecting Technology
Table 31. France: 3D Stacking Market – Revenue and Forecast to 2031(US$ Million) – by Device Type
Table 32. France: 3D Stacking Market – Revenue and Forecast to 2031(US$ Million) – by End User
Table 33. Italy: 3D Stacking Market – Revenue and Forecast to 2031(US$ Million) – by Interconnecting Technology
Table 34. Italy: 3D Stacking Market – Revenue and Forecast to 2031(US$ Million) – by Device Type
Table 35. Italy: 3D Stacking Market – Revenue and Forecast to 2031(US$ Million) – by End User
Table 36. Russia: 3D Stacking Market – Revenue and Forecast to 2031(US$ Million) – by Interconnecting Technology
Table 37. Russia: 3D Stacking Market – Revenue and Forecast to 2031(US$ Million) – by Device Type
Table 38. Russia: 3D Stacking Market – Revenue and Forecast to 2031(US$ Million) – by End User
Table 39. Rest of Europe: 3D Stacking Market – Revenue and Forecast to 2031(US$ Million) – by Interconnecting Technology
Table 40. Rest of Europe: 3D Stacking Market – Revenue and Forecast to 2031(US$ Million) – by Device Type
Table 41. Rest of Europe: 3D Stacking Market – Revenue and Forecast to 2031(US$ Million) – by End User
Table 42. Asia Pacific: 3D Stacking Market – Revenue and Forecast to 2031(US$ Million) – by Interconnecting Technology
Table 43. Asia Pacific: 3D Stacking Market – Revenue and Forecast to 2031(US$ Million) – by Device Type
Table 44. Asia Pacific: 3D Stacking Market – Revenue and Forecast to 2031(US$ Million) – by End User
Table 45. Asia Pacific: 3D Stacking Market – Revenue and Forecast to 2031(US$ Million) – by Country
Table 46. India: 3D Stacking Market – Revenue and Forecast to 2031(US$ Million) – by Interconnecting Technology
Table 47. India: 3D Stacking Market – Revenue and Forecast to 2031(US$ Million) – by Device Type
Table 48. India: 3D Stacking Market – Revenue and Forecast to 2031(US$ Million) – by End User
Table 49. China: 3D Stacking Market – Revenue and Forecast to 2031(US$ Million) – by Interconnecting Technology
Table 50. China: 3D Stacking Market – Revenue and Forecast to 2031(US$ Million) – by Device Type
Table 51. China: 3D Stacking Market – Revenue and Forecast to 2031(US$ Million) – by End User
Table 52. Japan: 3D Stacking Market – Revenue and Forecast to 2031(US$ Million) – by Interconnecting Technology
Table 53. Japan: 3D Stacking Market – Revenue and Forecast to 2031(US$ Million) – by Device Type
Table 54. Japan: 3D Stacking Market – Revenue and Forecast to 2031(US$ Million) – by End User
Table 55. South Korea: 3D Stacking Market – Revenue and Forecast to 2031(US$ Million) – by Interconnecting Technology
Table 56. South Korea: 3D Stacking Market – Revenue and Forecast to 2031(US$ Million) – by Device Type
Table 57. South Korea: 3D Stacking Market – Revenue and Forecast to 2031(US$ Million) – by End User
Table 58. Taiwan: 3D Stacking Market – Revenue and Forecast to 2031(US$ Million) – by Interconnecting Technology
Table 59. Taiwan: 3D Stacking Market – Revenue and Forecast to 2031(US$ Million) – by Device Type
Table 60. Taiwan: 3D Stacking Market – Revenue and Forecast to 2031(US$ Million) – by End User
Table 61. Australia: 3D Stacking Market – Revenue and Forecast to 2031(US$ Million) – by Interconnecting Technology
Table 62. Australia: 3D Stacking Market – Revenue and Forecast to 2031(US$ Million) – by Device Type
Table 63. Australia: 3D Stacking Market – Revenue and Forecast to 2031(US$ Million) – by End User
Table 64. Rest of APAC: 3D Stacking Market – Revenue and Forecast to 2031(US$ Million) – by Interconnecting Technology
Table 65. Rest of APAC: 3D Stacking Market – Revenue and Forecast to 2031(US$ Million) – by Device Type
Table 66. Rest of APAC: 3D Stacking Market – Revenue and Forecast to 2031(US$ Million) – by End User
Table 67. Middle East and Africa: 3D Stacking Market – Revenue and Forecast to 2031(US$ Million) – by Interconnecting Technology
Table 68. Middle East and Africa: 3D Stacking Market – Revenue and Forecast to 2031(US$ Million) – by Device Type
Table 69. Middle East and Africa: 3D Stacking Market – Revenue and Forecast to 2031(US$ Million) – by End User
Table 70. Middle East and Africa: 3D Stacking Market – Revenue and Forecast to 2031(US$ Million) – by Country
Table 71. Saudi Arabia: 3D Stacking Market – Revenue and Forecast to 2031(US$ Million) – by Interconnecting Technology
Table 72. Saudi Arabia: 3D Stacking Market – Revenue and Forecast to 2031(US$ Million) – by Device Type
Table 73. Saudi Arabia: 3D Stacking Market – Revenue and Forecast to 2031(US$ Million) – by End User
Table 74. United Arab Emirates: 3D Stacking Market – Revenue and Forecast to 2031(US$ Million) – by Interconnecting Technology
Table 75. United Arab Emirates: 3D Stacking Market – Revenue and Forecast to 2031(US$ Million) – by Device Type
Table 76. United Arab Emirates: 3D Stacking Market – Revenue and Forecast to 2031(US$ Million) – by End User
Table 77. South Africa: 3D Stacking Market – Revenue and Forecast to 2031(US$ Million) – by Interconnecting Technology
Table 78. South Africa: 3D Stacking Market – Revenue and Forecast to 2031(US$ Million) – by Device Type
Table 79. South Africa: 3D Stacking Market – Revenue and Forecast to 2031(US$ Million) – by End User
Table 80. Rest of Middle East and Africa: 3D Stacking Market – Revenue and Forecast to 2031(US$ Million) – by Interconnecting Technology
Table 81. Rest of Middle East and Africa: 3D Stacking Market – Revenue and Forecast to 2031(US$ Million) – by Device Type
Table 82. Rest of Middle East and Africa: 3D Stacking Market – Revenue and Forecast to 2031(US$ Million) – by End User
Table 83. South and Central America: 3D Stacking Market – Revenue and Forecast to 2031(US$ Million) – by Interconnecting Technology
Table 84. South and Central America: 3D Stacking Market – Revenue and Forecast to 2031(US$ Million) – by Device Type
Table 85. South and Central America: 3D Stacking Market – Revenue and Forecast to 2031(US$ Million) – by End User
Table 86. South and Central America: 3D Stacking Market – Revenue and Forecast to 2031(US$ Million) – by Country
Table 87. Brazil: 3D Stacking Market – Revenue and Forecast to 2031(US$ Million) – by Interconnecting Technology
Table 88. Brazil: 3D Stacking Market – Revenue and Forecast to 2031(US$ Million) – by Device Type
Table 89. Brazil: 3D Stacking Market – Revenue and Forecast to 2031(US$ Million) – by End User
Table 90. Argentina: 3D Stacking Market – Revenue and Forecast to 2031(US$ Million) – by Interconnecting Technology
Table 91. Argentina: 3D Stacking Market – Revenue and Forecast to 2031(US$ Million) – by Device Type
Table 92. Argentina: 3D Stacking Market – Revenue and Forecast to 2031(US$ Million) – by End User
Table 93. Rest of South and Central America: 3D Stacking Market – Revenue and Forecast to 2031(US$ Million) – by Interconnecting Technology
Table 94. Rest of South and Central America: 3D Stacking Market – Revenue and Forecast to 2031(US$ Million) – by Device Type
Table 95. Rest of South and Central America: 3D Stacking Market – Revenue and Forecast to 2031(US$ Million) – by End User
Table 96. List of Abbreviation
List of Figures
Figure 1. 3D Stacking Market Segmentation, by Geography
Figure 2. PEST Analysis
Figure 3. Impact Analysis of Drivers and Restraints
Figure 4. 3D Stacking Market Revenue (US$ Million), 2021–2031
Figure 5. 3D Stacking Market Share (%) – by Interconnecting Technology (2023 and 2031)
Figure 6. Through-Silicon Via: 3D Stacking Market – Revenue and Forecast to 2031 (US$ Million)
Figure 7. Monolithic 3D Integration: 3D Stacking Market – Revenue and Forecast to 2031 (US$ Million)
Figure 8. 3D Hybrid Bonding: 3D Stacking Market – Revenue and Forecast to 2031 (US$ Million)
Figure 9. 3D Stacking Market Share (%) – by Device Type (2023 and 2031)
Figure 10. Memory Devices: 3D Stacking Market – Revenue and Forecast to 2031 (US$ Million)
Figure 11. MEMS/Sensors: 3D Stacking Market – Revenue and Forecast to 2031 (US$ Million)
Figure 12. LEDs: 3D Stacking Market – Revenue and Forecast to 2031 (US$ Million)
Figure 13. Imaging and Optoelectronics: 3D Stacking Market – Revenue and Forecast to 2031 (US$ Million)
Figure 14. Others: 3D Stacking Market – Revenue and Forecast to 2031 (US$ Million)
Figure 15. 3D Stacking Market Share (%) – by End User (2023 and 2031)
Figure 16. Consumer Electronics: 3D Stacking Market – Revenue and Forecast to 2031 (US$ Million)
Figure 17. Telecommunication: 3D Stacking Market – Revenue and Forecast to 2031 (US$ Million)
Figure 18. Automotive: 3D Stacking Market – Revenue and Forecast to 2031 (US$ Million)
Figure 19. Manufacturing: 3D Stacking Market – Revenue and Forecast to 2031 (US$ Million)
Figure 20. Healthcare: 3D Stacking Market – Revenue and Forecast to 2031 (US$ Million)
Figure 21. Others: 3D Stacking Market – Revenue and Forecast to 2031 (US$ Million)
Figure 22. 3D Stacking Market Breakdown by Region, 2023 and 2031 (%)
Figure 23. North America: 3D Stacking Market – Revenue and Forecast to 2031(US$ Million)
Figure 24. North America: 3D Stacking Market Breakdown, by Interconnecting Technology (2023 and 2031)
Figure 25. North America: 3D Stacking Market Breakdown, by Device Type (2023 and 2031)
Figure 26. North America: 3D Stacking Market Breakdown, by End User (2023 and 2031)
Figure 27. North America: 3D Stacking Market Breakdown, by Key Countries, 2023 and 2031 (%)
Figure 28. United States: 3D Stacking Market – Revenue and Forecast to 2031(US$ Million)
Figure 29. Canada: 3D Stacking Market – Revenue and Forecast to 2031(US$ Million)
Figure 30. Mexico: 3D Stacking Market – Revenue and Forecast to 2031(US$ Million)
Figure 31. Europe: 3D Stacking Market – Revenue and Forecast to 2031(US$ Million)
Figure 32. Europe: 3D Stacking Market Breakdown, by Interconnecting Technology (2023 and 2031)
Figure 33. Europe: 3D Stacking Market Breakdown, by Device Type (2023 and 2031)
Figure 34. Europe: 3D Stacking Market Breakdown, by End User (2023 and 2031)
Figure 35. Europe: 3D Stacking Market Breakdown, by Key Countries, 2023 and 2031 (%)
Figure 36. United Kingdom: 3D Stacking Market – Revenue and Forecast to 2031(US$ Million)
Figure 37. Germany: 3D Stacking Market – Revenue and Forecast to 2031(US$ Million)
Figure 38. France: 3D Stacking Market – Revenue and Forecast to 2031(US$ Million)
Figure 39. Italy: 3D Stacking Market – Revenue and Forecast to 2031(US$ Million)
Figure 40. Russia: 3D Stacking Market – Revenue and Forecast to 2031(US$ Million)
Figure 41. Rest of Europe: 3D Stacking Market – Revenue and Forecast to 2031(US$ Million)
Figure 42. Asia Pacific: 3D Stacking Market – Revenue and Forecast to 2031(US$ Million)
Figure 43. Asia Pacific: 3D Stacking Market Breakdown, by Interconnecting Technology (2023 and 2031)
Figure 44. Asia Pacific: 3D Stacking Market Breakdown, by Device Type (2023 and 2031)
Figure 45. Asia Pacific: 3D Stacking Market Breakdown, by End User (2023 and 2031)
Figure 46. Asia Pacific: 3D Stacking Market Breakdown, by Key Countries, 2023 and 2031 (%)
Figure 47. India: 3D Stacking Market – Revenue and Forecast to 2031(US$ Million)
Figure 48. China: 3D Stacking Market – Revenue and Forecast to 2031(US$ Million)
Figure 49. Japan: 3D Stacking Market – Revenue and Forecast to 2031(US$ Million)
Figure 50. South Korea: 3D Stacking Market – Revenue and Forecast to 2031(US$ Million)
Figure 51. Taiwan: 3D Stacking Market – Revenue and Forecast to 2031(US$ Million)
Figure 52. Australia: 3D Stacking Market – Revenue and Forecast to 2031(US$ Million)
Figure 53. Rest of APAC: 3D Stacking Market – Revenue and Forecast to 2031(US$ Million)
Figure 54. Middle East and Africa: 3D Stacking Market – Revenue and Forecast to 2031(US$ Million)
Figure 55. Middle East and Africa: 3D Stacking Market Breakdown, by Interconnecting Technology (2023 and 2031)
Figure 56. Middle East and Africa: 3D Stacking Market Breakdown, by Device Type (2023 and 2031)
Figure 57. Middle East and Africa: 3D Stacking Market Breakdown, by End User (2023 and 2031)
Figure 58. Middle East and Africa: 3D Stacking Market Breakdown, by Key Countries, 2023 and 2031 (%)
Figure 59. Saudi Arabia: 3D Stacking Market – Revenue and Forecast to 2031(US$ Million)
Figure 60. United Arab Emirates: 3D Stacking Market – Revenue and Forecast to 2031(US$ Million)
Figure 61. South Africa: 3D Stacking Market – Revenue and Forecast to 2031(US$ Million)
Figure 62. Rest of Middle East and Africa: 3D Stacking Market – Revenue and Forecast to 2031(US$ Million)
Figure 63. South and Central America: 3D Stacking Market – Revenue and Forecast to 2031(US$ Million)
Figure 64. South and Central America: 3D Stacking Market Breakdown, by Interconnecting Technology (2023 and 2031)
Figure 65. South and Central America: 3D Stacking Market Breakdown, by Device Type (2023 and 2031)
Figure 66. South and Central America: 3D Stacking Market Breakdown, by End User (2023 and 2031)
Figure 67. South and Central America: 3D Stacking Market Breakdown, by Key Countries, 2023 and 2031 (%)
Figure 68. Brazil: 3D Stacking Market – Revenue and Forecast to 2031(US$ Million)
Figure 69. Argentina: 3D Stacking Market – Revenue and Forecast to 2031(US$ Million)
Figure 70. Rest of South and Central America: 3D Stacking Market – Revenue and Forecast to 2031(US$ Million)
Figure 71. Heat Map Analysis by Key Players
Figure 72. Company Positioning & Concentration
The List of Companies - 3D Stacking Market
- Taiwan Semiconductor Manufacturing Co Ltd
- Samsung Electronics Co Ltd
- Intel Corp
- MediaTek Inc
- Texas Instruments Inc
- Amkor Technology Inc
- ASE Technology Holding Co Ltd
- Advanced Micro Devices Inc
- 3M Co
- Globalfoundries Inc
The Insight Partners performs research in 4 major stages: Data Collection & Secondary Research, Primary Research, Data Analysis and Data Triangulation & Final Review.
- Data Collection and Secondary Research:
As a market research and consulting firm operating from a decade, we have published many reports and advised several clients across the globe. First step for any study will start with an assessment of currently available data and insights from existing reports. Further, historical and current market information is collected from Investor Presentations, Annual Reports, SEC Filings, etc., and other information related to company’s performance and market positioning are gathered from Paid Databases (Factiva, Hoovers, and Reuters) and various other publications available in public domain.
Several associations trade associates, technical forums, institutes, societies and organizations are accessed to gain technical as well as market related insights through their publications such as research papers, blogs and press releases related to the studies are referred to get cues about the market. Further, white papers, journals, magazines, and other news articles published in the last 3 years are scrutinized and analyzed to understand the current market trends.
- Primary Research:
The primarily interview analysis comprise of data obtained from industry participants interview and answers to survey questions gathered by in-house primary team.
For primary research, interviews are conducted with industry experts/CEOs/Marketing Managers/Sales Managers/VPs/Subject Matter Experts from both demand and supply side to get a 360-degree view of the market. The primary team conducts several interviews based on the complexity of the markets to understand the various market trends and dynamics which makes research more credible and precise.
A typical research interview fulfils the following functions:
- Provides first-hand information on the market size, market trends, growth trends, competitive landscape, and outlook
- Validates and strengthens in-house secondary research findings
- Develops the analysis team’s expertise and market understanding
Primary research involves email interactions and telephone interviews for each market, category, segment, and sub-segment across geographies. The participants who typically take part in such a process include, but are not limited to:
- Industry participants: VPs, business development managers, market intelligence managers and national sales managers
- Outside experts: Valuation experts, research analysts and key opinion leaders specializing in the electronics and semiconductor industry.
Below is the breakup of our primary respondents by company, designation, and region:

Once we receive the confirmation from primary research sources or primary respondents, we finalize the base year market estimation and forecast the data as per the macroeconomic and microeconomic factors assessed during data collection.
- Data Analysis:
Once data is validated through both secondary as well as primary respondents, we finalize the market estimations by hypothesis formulation and factor analysis at regional and country level.
- 3.1 Macro-Economic Factor Analysis:
We analyse macroeconomic indicators such the gross domestic product (GDP), increase in the demand for goods and services across industries, technological advancement, regional economic growth, governmental policies, the influence of COVID-19, PEST analysis, and other aspects. This analysis aids in setting benchmarks for various nations/regions and approximating market splits. Additionally, the general trend of the aforementioned components aid in determining the market's development possibilities.
- 3.2 Country Level Data:
Various factors that are especially aligned to the country are taken into account to determine the market size for a certain area and country, including the presence of vendors, such as headquarters and offices, the country's GDP, demand patterns, and industry growth. To comprehend the market dynamics for the nation, a number of growth variables, inhibitors, application areas, and current market trends are researched. The aforementioned elements aid in determining the country's overall market's growth potential.
- 3.3 Company Profile:
The “Table of Contents” is formulated by listing and analyzing more than 25 - 30 companies operating in the market ecosystem across geographies. However, we profile only 10 companies as a standard practice in our syndicate reports. These 10 companies comprise leading, emerging, and regional players. Nonetheless, our analysis is not restricted to the 10 listed companies, we also analyze other companies present in the market to develop a holistic view and understand the prevailing trends. The “Company Profiles” section in the report covers key facts, business description, products & services, financial information, SWOT analysis, and key developments. The financial information presented is extracted from the annual reports and official documents of the publicly listed companies. Upon collecting the information for the sections of respective companies, we verify them via various primary sources and then compile the data in respective company profiles. The company level information helps us in deriving the base number as well as in forecasting the market size.
- 3.4 Developing Base Number:
Aggregation of sales statistics (2020-2022) and macro-economic factor, and other secondary and primary research insights are utilized to arrive at base number and related market shares for 2022. The data gaps are identified in this step and relevant market data is analyzed, collected from paid primary interviews or databases. On finalizing the base year market size, forecasts are developed on the basis of macro-economic, industry and market growth factors and company level analysis.
- Data Triangulation and Final Review:
The market findings and base year market size calculations are validated from supply as well as demand side. Demand side validations are based on macro-economic factor analysis and benchmarks for respective regions and countries. In case of supply side validations, revenues of major companies are estimated (in case not available) based on industry benchmark, approximate number of employees, product portfolio, and primary interviews revenues are gathered. Further revenue from target product/service segment is assessed to avoid overshooting of market statistics. In case of heavy deviations between supply and demand side values, all thes steps are repeated to achieve synchronization.
We follow an iterative model, wherein we share our research findings with Subject Matter Experts (SME’s) and Key Opinion Leaders (KOLs) until consensus view of the market is not formulated – this model negates any drastic deviation in the opinions of experts. Only validated and universally acceptable research findings are quoted in our reports.
We have important check points that we use to validate our research findings – which we call – data triangulation, where we validate the information, we generate from secondary sources with primary interviews and then we re-validate with our internal data bases and Subject matter experts. This comprehensive model enables us to deliver high quality, reliable data in shortest possible time.
Trends and growth analysis reports related to 3D Stacking Market

Jul 2024
Remote Access Solution Market
Size and Forecast (2021 - 2031), Global and Regional Share, Trend, and Growth Opportunity Analysis Report Coverage: By Type [Secure Remote Access-VPN, Identity and Access Management (IAM) Solutions, Multi-Factor Authentication, Single Sign-On (SSO), Endpoint Security, and Others], Mode of Deployment (Cloud and On-Premise), End-Use Industry (IT and Telecommunications, BFSI, Healthcare, Government, Manufacturing, and Others), and Geography
Jul 2024
Hall Effect Teslameter Market
Size and Forecast (2021 - 2031), Global and Regional Share, Trend, and Growth Opportunity Analysis Report Coverage: By Type (Analog Hall Effect Teslameters and Digital Hall Effect Teslameters), End Users (Automotive, Industrial, Healthcare, Aerospace, Laboratory, and Others), and Geography
Jul 2024
Automotive Board to Board Connector Market
Size and Forecast (2021 - 2031), Global and Regional Share, Trend, and Growth Opportunity Analysis Report Coverage: By Type (Pin Headers, Sockets, Floating Connector, and Card Edge Connector), Pin Headers (Stacked Headers and Shrouded Headers), Application (Powertrain Control Systems, Infotainment and Navigation Systems, Advanced Driver Assistance Systems (ADAS), Electric Vehicles (EV) and Hybrid Vehicle Systems, Lighting Control Systems, Autonomous Vehicles, and Others), Pitch (Less Than 1 mm, 1–2 mm, and More Than 2 mm), Number of Pin (2–12 Pin, 13–30 Pin, 31–50 Pin, 51–100 Pin, and 100+ Pin), and Geography
Jul 2024
Radiation Hardened Motor Controller and Motor Drive Market
Size and Forecast (2021 - 2031), Global and Regional Share, Trend, and Growth Opportunity Analysis Report Coverage: By Type (Motor Controller and Motor Drive), Motor Drive (AC Drive, DC Drive, and BLDC), Application (Space Exploration, Military and Defense, Nuclear Power Plants, and Others), and Geography
Jul 2024
Pluggable Optics for Data Center Market
Size and Forecast (2021 - 2031), Global and Regional Share, Trend, and Growth Opportunity Analysis Report Coverage: By Component (Switches, Routers, and Servers), Data Rate (100–400 Gb/s, 400–800 Gb/s, and 800 Gb/s and above), and Geography
Jul 2024
Doors and Windows Automation Market
Size and Forecast (2021–2031), Global and Regional Share, Trend, and Growth Opportunity Analysis Report Coverage: By Type (Pedestrian Doors, Industrial Doors, and Windows), Component (Sensors and Detectors, Access Control Systems, Control Panels, Motors and Actuators, and Others), Industry Vertical (Commercial, Industrial, and Residential), Control System (Fully Automatic, Semi-Automatic, and Power Assist), and Geography
Jul 2024
Substrate-Like PCB Market
Size and Forecast (2021 - 2031), Global and Regional Share, Trend, and Growth Opportunity Analysis Report Coverage: By Line/Space (25/25 and 30/30 µm and Less than 25/25 µm), Fabrication Process (MSAP and UV LDI), Application (Consumer Electronics, Automotive, Industrial, Medical, and Others), and Geography
Jul 2024
LED Flashlight Market
Size and Forecast (2021 - 2031), Global and Regional Share, Trend, and Growth Opportunity Analysis Report Coverage: By Type (Rechargeable LED Flashlight and Non-Rechargeable LED Flashlight), Product (Everyday Carry Flashlights, Tactical Flashlights, and Safety Flashlights), Application (Residential, Commercial, and Military and Law Enforcement), and Geography
 Get Free Sample For