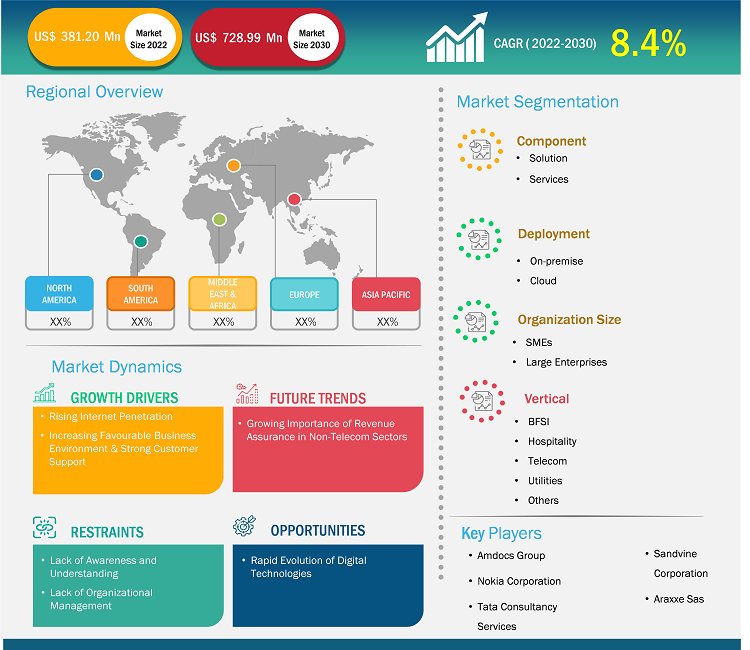
The Middle East & Africa revenue assurance market size is estimated to grow from US$ 381.20 million in 2022 to US$ 728.99 million by 2030; it is projected to grow at a CAGR of 8.4% from 2022 to 2030.
Analyst Perspective:
The Middle East & Africa revenue assurance market has grown significantly in recent years. The revenue assurance market in the MEA is experiencing significant growth, driven by factors such as the rise in favorable business environments and the provision of solid customer support. Above factors contribute to developing and expanding these solutions that help businesses optimize revenue streams, mitigate risks, and enhance operational efficiency.
Market Overview:
Revenue assurance is a crucial process businesses employ to identify, analyze, mitigate, and prevent revenue leakage through various measures. It aims to reduce the risks of financial losses due to errors, inaccuracies, or inefficiencies in revenue-related activities. It encompasses multiple internal and external activities, including auditing, reconciliation, budgeting, and reporting, to ensure that the income generated from business operations is accurate, secure, and compliant. Factors such as the rise in internet penetration, favorable business environment, and strong customer support fuel the growth of the revenue assurance market in the MEA.
Technological enhancements, particularly in big data and machine learning (ML), are revolutionizing the revenue assurance market in the Middle East & Africa. These advancements empower businesses to manage and optimize their revenue streams effectively, leading to increased profitability and operational efficiency. Big data analytics allow organizations to gather and analyze vast amounts of data from sources, including customer transactions, billing systems, and network operations. By leveraging advanced analytics techniques, businesses can gain valuable insights into their revenue generation processes, identify potential revenue leakages, and proactively address them. This proactive approach helps minimize financial losses and ensures accurate billing and revenue recognition.
Customize Research To Suit Your Requirement
We can optimize and tailor the analysis and scope which is unmet through our standard offerings. This flexibility will help you gain the exact information needed for your business planning and decision making.
Middle East & Africa Revenue Assurance Market: Strategic Insights
Market Size Value in US$ 381.20 million in 2022 Market Size Value by US$ 728.99 million by 2030 Growth rate CAGR of 8.4% from 2022 to 2030 Forecast Period 2023-2030 Base Year 2022

Naveen
Have a question?
Naveen will walk you through a 15-minute call to present the report’s content and answer all queries if you have any.
 Speak to Analyst
Customize Research To Suit Your Requirement
We can optimize and tailor the analysis and scope which is unmet through our standard offerings. This flexibility will help you gain the exact information needed for your business planning and decision making.
Middle East & Africa Revenue Assurance Market: Strategic Insights
| Market Size Value in | US$ 381.20 million in 2022 |
| Market Size Value by | US$ 728.99 million by 2030 |
| Growth rate | CAGR of 8.4% from 2022 to 2030 |
| Forecast Period | 2023-2030 |
| Base Year | 2022 |
Naveen
Have a question?
Naveen will walk you through a 15-minute call to present the report’s content and answer all queries if you have any.
Speak to Analyst
Revenue Assurance Market Driver:
Increasing Favorable Business Environment & Strong Customer Support to Drive Middle East & Africa Revenue Assurance Market Growth
The MEA has witnessed the emergence of favorable business environments characterized by progressive regulatory frameworks, government support, and growing investor confidence. These factors have fostered a conducive atmosphere for businesses to flourish and expand their operations while also driving the MEA revenue assurance market. A favorable business environment encourages companies to invest in these solutions to safeguard revenue streams, prevent financial leakages, and maintain compliance with regulatory requirements. Additionally, the availability of advanced technologies and infrastructure facilitates the implementation of revenue management measures, further boosting market growth. According to the International Monetary Fund, Saudi Arabia country in the MEA is poised to emerge as one of the global leaders in economic growth in 2023, driven by comprehensive pro-business reforms, a substantial increase in oil prices, and a surge in production. Following a recession caused by the COVID-19 pandemic in 2020, the country is projected to experience a remarkable recovery with a forecast GDP expansion of 7.6%. This growth rate is the highest in nearly ten years and signifies the positive impact of Saudi Arabia's business-friendly initiatives and the resilience of its economy.
Revenue Assurance Market Segmentation and Scope:
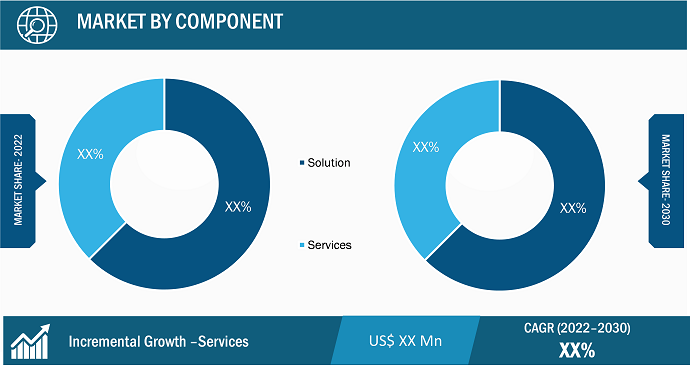
The revenue assurance market is categorized on the basis of component, deployment, organizational size, and vertical. Based on the component, the revenue assurance market is bifurcated into solutions and services. In terms of deployment, the revenue assurance market is segmented into on-premises and cloud. Based on organization size, the revenue assurance market is segmented into SMEs and large enterprises. In terms of vertical, the revenue assurance market is segmented into BFSI, hospitality, telecom, utilities, and others.
- Sample PDF showcases the content structure and the nature of the information with qualitative and quantitative analysis.
- Request discounts available for Start-Ups & Universities
Segmental Analysis:
The revenue assurance market is segmented by component into solutions and services. The solution segment held the largest share of the revenue assurance market in 2022. The solutions segment plays a crucial role in the revenue assurance market, offering a range of innovative tools and technologies that help businesses ensure the accuracy and integrity of their revenue streams. These solutions help to address complex challenges in industries, including telecommunications, banking, retail, and healthcare. These solutions provide comprehensive capabilities to monitor, analyze, and manage revenue-related processes, enabling businesses to identify and rectify revenue leakages, fraud, and billing errors. These solutions leverage advanced technologies such as data analytics, machine learning, and artificial intelligence to detect revenue data anomalies, patterns, and discrepancies. Thus, considering the above advantages, the solution segment is positively influencing the revenue assurance market.

- Sample PDF showcases the content structure and the nature of the information with qualitative and quantitative analysis.
- Request discounts available for Start-Ups & Universities
Revenue Assurance Market Regional Analysis:
The revenue assurance market in the UAE has witnessed substantial growth, primarily due to its expansion. The rise in internet penetration is one of the major factors attributing to the revenue assurance market growth in the country. As internet usage continues to develop, businesses operating in the country are expected to continue their operations online, leading to more and more digital payments. Furthermore, according to the analysis of a prominent consulting firm, at the beginning of 2023, the UAE boasted a staggering 99% internet penetration, with approximately 9.38 million individuals actively using the internet in the country. Such trends are anticipated to propel the industry growth in the near future. Additionally, according to Ookla's data, the median mobile internet connection speed in the UAE experienced a gain of 2.3%, equivalent to an increase of 3.08 Mbps, during the twelve months leading up to the start of 2023.
Key Player Analysis:
Amdocs Ltd, Nokia Corp, Tata Consultancy Services Ltd, Subex Ltd, LATRO Services Inc, Araxxe SAS, Substratal Solutions Pvt Ltd, BDO South Africa Inc, Panamax Inc, and Adapt IT Holdings Proprietary Ltd are among the vital revenue assurance market players profiled in the report.
Recent Developments:
Inorganic and organic strategies such as mergers and acquisitions, new product launches, expansion, and diversification are highly adopted by companies in the revenue assurance market. A few recent key developments in the revenue assurance market are listed below:
- In June 2023, Subex, a telecom analytics solution provider, was awarded a five-year contract with inwi, a major telecom operator in Morocco, to transform their existing Revenue Assurance and Fraud Management (RAFM) system to HyperSense Business Assurance and Fraud Management, including Managed Services support. By deploying the HyperSense platform, inwi will benefit from a more advanced and sophisticated system with greater automation and best-in-class AI/ML capabilities. These capabilities will enable inwi to identify and prevent revenue leakages and fraud more efficiently.
- In April 2022, LATRO bolsters telecom revenue protection efforts with the appointment of Jacob Howell as director of corporate strategy. This strategic move underscores LATRO's dedication to fostering innovation within the telecom sector and fortifying its position as a pioneer in analytics-driven telecom solutions.
- In May 2023, Cable & Wireless Seychelles selected LATRO for revenue assurance and fraud management. The solution chosen, Versassure, is based on innovative, high-performance big data architecture with advanced real-time analytics, reporting, and reconciliation functions.
- In February 2023, Digital financial solutions provider Panamax acquired Acute Informatics, an enterprise digital core banking solution provider and IT consultancy firm. The acquisition of India-based Acute for an undisclosed sum is set to boost Panamax's global digital finance and core banking offering.
- In December 2022, LATRO, a global provider of telecommunications revenue assurance and fraud management (RAFM) product and services solutions, announced the extension of their services agreement with inwi. LATRO has supported inwi in fighting fraud within the country for nearly a decade.
- In August 2021, Subex announced that it had been awarded a seven-digit, five-year contract from Dhiraagu, the leading telecom operator of Maldives, to provide its integrated Revenue Assurance and Fraud Management (iRAFM) solution. Through the deployment, Dhiraagu upgraded its systems and consolidated its standalone assurance functions to equip itself better for the 5G era.
- In August 2021, Subex Ltd. extended its partnership with telecom operator Robi to upgrade its existing integrated revenue assurance and fraud management (iRAFM) system. Through this upgrade, Robi leveraged the artificial intelligence/machine learning (AI/ML) capabilities of Subex's revenue assurance and fraud management solutions to tackle new-age telecom threats in the region and deliver a superior customer experience as it looks to provide services built on 5G.
- In December 2020, Subex announced that it had been selected by STC to deploy an integrated Revenue Assurance and Fraud Management (iRAFM) solution. This deal marked another chapter in the long-standing partnership between Subex and STC through the earlier deployments of ROC Revenue Assurance and an award-winning Fraud Management engagement.
- In January 2020, Subex extended its agreement with Jawwal, a Palestine-based MNO, to provide its ROC RA platform for the next five years. The collaboration entails adopting the ROC revenue assurance platform, which will allow Jawwal to cover its recently released digital services while also improving revenue streams and reducing risks.

Report Coverage
Revenue forecast, Company Analysis, Industry landscape, Growth factors, and Trends

Segment Covered
Component, Deployment, Organization Size, Vertical, and Geography

Regional Scope
North America, Europe, Asia Pacific, Middle East & Africa, South & Central America

Country Scope
This text is related
to country scope.
Frequently Asked Questions
The Middle East & Africa revenue assurance market are expected to reach US$ 728.99 million by 2030.
The growing importance of revenue assurance in non-telecom sectors is expected to drive the growth of the Middle East & Africa revenue assurance market in the coming years.
The Middle East & Africa revenue assurance market was estimated to be valued at US$ 381.20 million in 2022 and is projected to reach US$ 728.99 million by 2030; it is expected to grow at a CAGR of 8.4% during the forecast period.
Rising internet penetration, increasing favourable business environment & strong customer support and growing technological enhancement are driving factors of Middle East & Africa revenue assurance market.
The solution segment led the Middle East & Africa revenue assurance market with a significant share in 2022 and services segment is expected to grow with the highest CAGR.
The key players holding majority shares in the Middle East & Africa revenue assurance market include Amdocs Group, Nokia Corporation, Tata Consultancy Services, Sandvine Corporation, Araxxe Sas.
1. Introduction
1.1 The Insight Partners Research Report Guidance
1.2 Market Segmentation
2. Executive Summary
2.1 Key Insights
3. Research Methodology
3.1 Coverage
3.2 Secondary Research
3.3 Primary Research
4. Revenue Assurance Market Landscape
4.1 Overview
4.2 PEST Analysis
4.3 Ecosystem Analysis
4.3.1 Solution Providers:
4.3.2 Service Providers
4.3.3 End Users:
5. Revenue Assurance Market - Key Market Dynamics
5.1 Drivers
5.1.1 Rising Internet Penetration
5.1.2 Increasing Favourable Business Environment & Strong Customer Support
5.1.3 Growing Technological Enhancement
5.2 Restraints
5.2.1 Lack of Awareness and Understanding
5.2.2 Lack of Organizational Management
5.3 Opportunity
5.3.1 Rapid Evolution of Digital Technologies
5.3.2 Expansion of Telecom Sector
5.4 Future Trend
5.4.1 Growing Importance of Revenue Assurance in Non-Telecom Sectors
5.5 Impact of Drivers and Restraints:
6. Revenue Assurance Market – Middle East and Africa Market Analysis
6.1 Revenue Assurance Market Revenue (US$ Million), 2022 – 2030
7. Revenue Assurance Market Analysis - Component
7.1 Solution
7.1.1 Overview
7.1.2 Solution Market Revenue and Forecasts To 2030 (US$ Million)
7.2 Services
7.2.1 Overview
7.2.2 Services Market Revenue and Forecasts To 2030 (US$ Million)
8. Revenue Assurance Market Analysis - Deployment
8.1 On-Premise
8.1.1 Overview
8.1.2 On-Premise Market Revenue and Forecasts To 2030 (US$ Million)
8.2 Cloud-based
8.2.1 Overview
8.2.2 Cloud-based Market Revenue and Forecasts To 2030 (US$ Million)
9. Revenue Assurance Market Analysis - Organization Size
9.1 SMEs
9.1.1 Overview
9.1.2 SMEs Market Revenue and Forecasts To 2030 (US$ Million)
9.2 Large Enterprises
9.2.1 Overview
9.2.2 Large Enterprises Market Revenue and Forecasts To 2030 (US$ Million)
10. Revenue Assurance Market Analysis – Vertical
10.1 BFSI
10.1.1 Overview
10.1.2 BFSI Market Revenue and Forecasts To 2030 (US$ Million)
10.2 Hospitality
10.2.1 Overview
10.2.2 Hospitality Market Revenue and Forecasts To 2030 (US$ Million)
10.3 Telecom
10.3.1 Overview
10.3.2 Telecom Market Revenue and Forecasts To 2030 (US$ Million)
10.4 Utilities
10.4.1 Overview
10.4.2 Utilities Market Revenue and Forecasts To 2030 (US$ Million)
10.5 Others
10.5.1 Overview
10.5.2 Others Market Revenue and Forecasts To 2030 (US$ Million)
11. Revenue Assurance Market – Country Analysis
11.1 Middle East Revenue Assurance Market
11.1.1 Middle East Revenue Assurance Market Overview
11.1.2 Middle East Revenue Assurance Market Revenue and Forecasts To 2030 (US$ Million)
11.1.3 Middle East Revenue Assurance Market Breakdown by Component
11.1.3.1 Middle East Revenue Assurance Market Revenue and Forecasts and Analysis - By Component
11.1.4 Middle East Revenue Assurance Market Breakdown by Deployment
11.1.4.1 Middle East Revenue Assurance Market Revenue and Forecasts and Analysis - By Deployment
11.1.5 Middle East and Africa Revenue Assurance Market Breakdown by Organization Size
11.1.5.1 Middle East Revenue Assurance Market Revenue and Forecasts and Analysis - By Organization Size
11.1.6 Middle East Revenue Assurance Market Breakdown by Vertical
11.1.6.1 Middle East Revenue Assurance Market Revenue and Forecasts and Analysis - By Vertical
11.1.7 Revenue Assurance Market Breakdown by Country
11.1.7.1 Saudi Arabia Revenue Assurance Market Revenue and Forecasts To 2030 (US$ Million)
11.1.7.1.1 Saudi Arabia Revenue Assurance Market Breakdown by Component
11.1.7.1.2 Saudi Arabia Revenue Assurance Market Breakdown by Deployment
11.1.7.1.3 Saudi Arabia Revenue Assurance Market Breakdown by Organization Size
11.1.7.1.4 Saudi Arabia Revenue Assurance Market Breakdown by Vertical
11.1.7.2 UAE Revenue Assurance Market Revenue and Forecasts To 2030 (US$ Million)
11.1.7.2.1 UAE Revenue Assurance Market Breakdown by Component
11.1.7.2.2 UAE Revenue Assurance Market Breakdown by Deployment
11.1.7.2.3 UAE Revenue Assurance Market Breakdown by Organization Size
11.1.7.2.4 UAE Revenue Assurance Market Breakdown by Vertical
11.1.7.3 Kuwait Revenue Assurance Market Revenue and Forecasts To 2030 (US$ Million)
11.1.7.3.1 Kuwait Revenue Assurance Market Breakdown by Component
11.1.7.3.2 Kuwait Revenue Assurance Market Breakdown by Deployment
11.1.7.3.3 Kuwait Revenue Assurance Market Breakdown by Organization Size
11.1.7.3.4 Kuwait Revenue Assurance Market Breakdown by Vertical
11.1.7.4 Qatar Revenue Assurance Market Revenue and Forecasts To 2030 (US$ Million)
11.1.7.4.1 Qatar Revenue Assurance Market Breakdown by Component
11.1.7.4.2 Qatar Revenue Assurance Market Breakdown by Deployment
11.1.7.4.3 Qatar Revenue Assurance Market Breakdown by Organization Size
11.1.7.4.4 Qatar Revenue Assurance Market Breakdown by Vertical
11.1.7.5 Oman Revenue Assurance Market Revenue and Forecasts To 2030 (US$ Million)
11.1.7.5.1 Oman Revenue Assurance Market Breakdown by Component
11.1.7.5.2 Oman Revenue Assurance Market Breakdown by Deployment
11.1.7.5.3 Oman Revenue Assurance Market Breakdown by Organization Size
11.1.7.5.4 Oman Revenue Assurance Market Breakdown by Vertical
11.1.7.6 Rest of Middle East Revenue Assurance Market Revenue and Forecasts To 2030 (US$ Million)
11.1.7.6.1 Rest of Middle East Revenue Assurance Market Breakdown by Component
11.1.7.6.2 Rest of Middle East Revenue Assurance Market Breakdown by Deployment
11.1.7.6.3 Rest of Middle East Revenue Assurance Market Breakdown by Organization Size
11.1.7.6.4 Rest of Middle East Revenue Assurance Market Breakdown by Vertical
11.2 Africa Revenue Assurance Market
11.2.1 Africa Revenue Assurance Market Overview
11.2.2 Africa Revenue Assurance Market Revenue and Forecasts To 2030 (US$ Million)
11.2.3 Africa Revenue Assurance Market Breakdown by Component
11.2.3.1 Africa Revenue Assurance Market Revenue and Forecasts and Analysis - By Component
11.2.4 Africa Revenue Assurance Market Breakdown by Deployment
11.2.4.1 Africa Revenue Assurance Market Revenue and Forecasts and Analysis - By Deployment
11.2.5 Africa Revenue Assurance Market Breakdown by Organization Size
11.2.5.1 Africa Revenue Assurance Market Revenue and Forecasts and Analysis - By Organization Size
11.2.6 Africa Revenue Assurance Market Breakdown by Vertical
11.2.6.1 Africa Revenue Assurance Market Revenue and Forecasts and Analysis - By Vertical
11.2.7 Revenue Assurance Market Breakdown by Region
11.2.7.1 Northern Africa Revenue Assurance Market Revenue and Forecasts To 2030 (US$ Million)
11.2.7.1.1 Northern Africa Revenue Assurance Market Breakdown by Component
11.2.7.1.2 Northern Africa Revenue Assurance Market Breakdown by Deployment
11.2.7.1.3 Northern Africa Revenue Assurance Market Breakdown by Organization Size
11.2.7.1.4 Northern Africa Revenue Assurance Market Breakdown by Vertical
11.2.7.2 Western Africa Assurance Market Revenue and Forecasts To 2030 (US$ Million)
11.2.7.2.1 Western Africa Assurance Market Breakdown by Component
11.2.7.2.2 Western Africa Assurance Market Breakdown by Deployment
11.2.7.2.3 Western Africa Assurance Market Breakdown by Organization Size
11.2.7.2.4 Western Africa Assurance Market Breakdown by Vertical
11.2.7.3 Southern Africa Revenue Assurance Market Revenue and Forecasts To 2030 (US$ Million)
11.2.7.3.1 Southern Africa Revenue Assurance Market Breakdown by Component
11.2.7.3.2 Southern Africa Revenue Assurance Market Breakdown by Deployment
11.2.7.3.3 Southern Africa Revenue Assurance Market Breakdown by Organization Size
11.2.7.3.4 Southern Africa Revenue Assurance Market Breakdown by Vertical
11.2.7.4 Eastern Africa Revenue Assurance Market Revenue and Forecasts To 2030 (US$ Million)
11.2.7.4.1 Eastern Africa Revenue Assurance Market Breakdown by Component
11.2.7.4.2 Eastern Africa Revenue Assurance Market Breakdown by Deployment
11.2.7.4.3 Eastern Africa Revenue Assurance Market Breakdown by Organization Size
11.2.7.4.4 Eastern Africa Revenue Assurance Market Breakdown by Vertical
11.2.7.5 Central Africa Revenue Assurance Market Revenue and Forecasts To 2030 (US$ Million)
11.2.7.5.1 Central Africa Revenue Assurance Market Breakdown by Component
11.2.7.5.2 Central Africa Revenue Assurance Market Breakdown by Deployment
11.2.7.5.3 Central Africa Revenue Assurance Market Breakdown by Organization Size
11.2.7.5.4 Central Africa Revenue Assurance Market Breakdown by Vertical
12. Revenue Assurance Market – Impact of COVID-19 Pandemic
12.1 Pre & Post Covid-19 Impact
13. Competitive Landscape
13.1 Heat Map Analysis By Key Players
13.2 Company Positioning & Concentration
14. Industry Landscape
14.1 Overview
14.2 Market Initiative
14.3 Mergers & Acquisitions
15. Company Profiles
15.1 Nokia Corp
15.1.1 Key Facts
15.1.2 Business Description
15.1.3 Products and Services
15.1.4 Financial Overview
15.1.5 SWOT Analysis
15.1.6 Key Developments
15.2 Tata Consultancy Services Ltd
15.2.1 Key Facts
15.2.2 Business Description
15.2.3 Products and Services
15.2.4 Financial Overview
15.2.5 SWOT Analysis
15.2.6 Key Developments
15.3 Amdocs Ltd
15.3.1 Key Facts
15.3.2 Business Description
15.3.3 Products and Services
15.3.4 Financial Overview
15.3.5 SWOT Analysis
15.3.6 Key Developments
15.4 Subex Ltd
15.4.1 Key Facts
15.4.2 Business Description
15.4.3 Products and Services
15.4.4 Financial Overview
15.4.5 SWOT Analysis
15.4.6 Key Developments
15.5 LATRO Services Inc
15.5.1 Key Facts
15.5.2 Business Description
15.5.3 Products and Services
15.5.4 Financial Overview
15.5.5 SWOT Analysis
15.5.6 Key Developments
15.6 Araxxe SAS
15.6.1 Key Facts
15.6.2 Business Description
15.6.3 Products and Services
15.6.4 Financial Overview
15.6.5 SWOT Analysis
15.6.6 Key Developments
15.7 BDO South Africa Inc
15.7.1 Key Facts
15.7.2 Business Description
15.7.3 Products and Services
15.7.4 Financial Overview
15.7.5 SWOT Analysis
15.7.6 Key Developments
15.8 Panamax Inc
15.8.1 Key Facts
15.8.2 Business Description
15.8.3 Products and Services
15.8.4 Financial Overview
15.8.5 SWOT Analysis
15.8.6 Key Developments
15.9 Adapt IT Holdings Proprietary Ltd
15.9.1 Key Facts
15.9.2 Business Description
15.9.3 Products and Services
15.9.4 Financial Overview
15.9.5 SWOT Analysis
15.9.6 Key Developments
15.10 Substratal Solutions Pvt Ltd
15.10.1 Key Facts
15.10.2 Business Description
15.10.3 Products and Services
15.10.4 Financial Overview
15.10.5 SWOT Analysis
15.10.6 Key Developments
16. Appendix
16.1 About The Insight Partners
16.2 Word Index
List of Tables
Table 1. Revenue Assurance Market Segmentation
Table 2. List of Vendors in Value Chain:
Table 3. Revenue assurance Market Revenue and Forecasts To 2030 (US$ Million) – Component
Table 4. Revenue assurance Market Revenue and Forecasts To 2030 (US$ Million) – Deployment
Table 5. Revenue assurance Market Revenue and Forecasts To 2030 (US$ Million) – Organization Size
Table 6. Revenue assurance Market Revenue and Forecasts To 2030 (US$ Million) – Vertical
Table 7. Middle East Revenue Assurance Market Revenue And Forecasts To 2030 (US$ Million) – Component
Table 8. Middle East Revenue Assurance Market Revenue And Forecasts To 2030 (US$ Million) – Deployment
Table 9. Middle East Revenue Assurance Market Revenue And Forecasts To 2030 (US$ Million) – Organization Size
Table 10. Middle East Revenue Assurance Market Revenue And Forecasts To 2030 (US$ Million) – Vertical
Table 11. Middle East Revenue Assurance Market, by Country – Revenue and Forecast to 2030 (USD Million)
Table 12. Saudi Arabia Revenue Assurance Market Revenue And Forecasts To 2030 (US$ Million) – Component
Table 13. Saudi Arabia Revenue Assurance Market Revenue And Forecasts To 2030 (US$ Million) – Deployment
Table 14. Saudi Arabia Revenue Assurance Market Revenue And Forecasts To 2030 (US$ Million) – Organization Size
Table 15. Saudi Arabia Revenue Assurance Market Revenue And Forecasts To 2030 (US$ Million) – Vertical
Table 16. UAE Revenue Assurance Market Revenue And Forecasts To 2030 (US$ Million) – Component
Table 17. UAE Revenue Assurance Market Revenue And Forecasts To 2030 (US$ Million) – Deployment
Table 18. UAE Revenue Assurance Market Revenue And Forecasts To 2030 (US$ Million) – Organization Size
Table 19. UAE Revenue Assurance Market Revenue And Forecasts To 2030 (US$ Million) – Vertical
Table 20. Kuwait Revenue Assurance Market Revenue And Forecasts To 2030 (US$ Million) – Component
Table 21. Kuwait Revenue Assurance Market Revenue And Forecasts To 2030 (US$ Million) – Deployment
Table 22. Kuwait Revenue Assurance Market Revenue And Forecasts To 2030 (US$ Million) – Organization Size
Table 23. Kuwait Revenue Assurance Market Revenue And Forecasts To 2030 (US$ Million) – Vertical
Table 24. Qatar Revenue Assurance Market Revenue And Forecasts To 2030 (US$ Million) – Component
Table 25. Qatar Revenue Assurance Market Revenue And Forecasts To 2030 (US$ Million) – Deployment
Table 26. Qatar Revenue Assurance Market Revenue And Forecasts To 2030 (US$ Million) – Organization Size
Table 27. Qatar Revenue Assurance Market Revenue And Forecasts To 2030 (US$ Million) – Vertical
Table 28. Oman Revenue Assurance Market Revenue And Forecasts To 2030 (US$ Million) – Component
Table 29. Oman Revenue Assurance Market Revenue And Forecasts To 2030 (US$ Million) – Deployment
Table 30. Oman Revenue Assurance Market Revenue And Forecasts To 2030 (US$ Million) – Organization Size
Table 31. Oman Revenue Assurance Market Revenue And Forecasts To 2030 (US$ Million) – Vertical
Table 32. Rest of Middle East Revenue Assurance Market Revenue And Forecasts To 2030 (US$ Million) – Component
Table 33. Rest of Middle East Revenue Assurance Market Revenue And Forecasts To 2030 (US$ Million) – Deployment
Table 34. Rest of Middle East Revenue Assurance Market Revenue And Forecasts To 2030 (US$ Million) – Organization Size
Table 35. Rest of Middle East & Africa Revenue Assurance Market Revenue And Forecasts To 2030 (US$ Million) – Vertical
Table 36. Africa Revenue Assurance Market Revenue And Forecasts To 2030 (US$ Million) – Component
Table 37. Africa Revenue Assurance Market Revenue And Forecasts To 2030 (US$ Million) – Deployment
Table 38. Africa Revenue Assurance Market Revenue And Forecasts To 2030 (US$ Million) – Organization Size
Table 39. Africa Revenue Assurance Market Revenue And Forecasts To 2030 (US$ Million) – Vertical
Table 40. Africa Revenue Assurance Market, by Regions – Revenue and Forecast to 2030 (USD Million)
Table 41. Northern Africa Revenue Assurance Market Revenue And Forecasts To 2030 (US$ Million) – Component
Table 42. Northern Africa Revenue Assurance Market Revenue And Forecasts To 2030 (US$ Million) – Deployment
Table 43. Northern Africa Revenue Assurance Market Revenue And Forecasts To 2030 (US$ Million) – Organization Size
Table 44. Northern Africa Revenue Assurance Market Revenue And Forecasts To 2030 (US$ Million) – Vertical
Table 45. Western Africa Assurance Market Revenue And Forecasts To 2030 (US$ Million) – Component
Table 46. Western Africa Assurance Market Revenue And Forecasts To 2030 (US$ Million) – Deployment
Table 47. Western Africa Assurance Market Revenue And Forecasts To 2030 (US$ Million) – Organization Size
Table 48. Western Africa Assurance Market Revenue And Forecasts To 2030 (US$ Million) – Vertical
Table 49. Southern Africa Revenue Assurance Market Revenue And Forecasts To 2030 (US$ Million) – Component
Table 50. Southern Africa Revenue Assurance Market Revenue And Forecasts To 2030 (US$ Million) – Deployment
Table 51. Southern Africa Revenue Assurance Market Revenue And Forecasts To 2030 (US$ Million) – Organization Size
Table 52. Southern Africa Revenue Assurance Market Revenue And Forecasts To 2030 (US$ Million) – Vertical
Table 53. Eastern Africa Revenue Assurance Market Revenue And Forecasts To 2030 (US$ Million) – Component
Table 54. Eastern Africa Revenue Assurance Market Revenue And Forecasts To 2030 (US$ Million) – Deployment
Table 55. Eastern Africa Revenue Assurance Market Revenue And Forecasts To 2030 (US$ Million) – Organization Size
Table 56. Eastern Africa Revenue Assurance Market Revenue And Forecasts To 2030 (US$ Million) – Vertical
Table 57. Central Africa Revenue Assurance Market Revenue And Forecasts To 2030 (US$ Million) – Component
Table 58. Central Africa Revenue Assurance Market Revenue And Forecasts To 2030 (US$ Million) – Deployment
Table 59. Central Africa Revenue Assurance Market Revenue And Forecasts To 2030 (US$ Million) – Organization Size
Table 60. Central Africa Revenue Assurance Market Revenue And Forecasts To 2030 (US$ Million) – Vertical
Table 61. Company Positioning & Concentration
Table 62. List of Abbreviation
List of Figures
Figure 1. Revenue Assurance Market Segmentation, By Geography
Figure 2. PEST Analysis
Figure 3. Ecosystem: Revenue Assurance Market
Figure 4. Revenue Assurance Market - Key Market Dynamics
Figure 5. Impact Analysis of Drivers And Restraints
Figure 6. Revenue Assurance Market Revenue (US$ Million), 2022 – 2030
Figure 7. Revenue assurance Market Share (%) – Component, 2022 and 2030
Figure 8. Solution Market Revenue and Forecasts To 2030 (US$ Million)
Figure 9. Services Market Revenue and Forecasts To 2030 (US$ Million)
Figure 10. Revenue assurance Market Share (%) – Component, 2022 and 2030
Figure 11. On-premise Market Revenue and Forecasts To 2030 (US$ Million)
Figure 12. Cloud-based Market Revenue and Forecasts To 2030 (US$ Million)
Figure 13. Revenue assurance Market Share (%) – Organization Size, 2022 and 2030
Figure 14. SMEs Market Revenue and Forecasts To 2030 (US$ Million)
Figure 15. Large Enterprise Market Revenue and Forecasts To 2030 (US$ Million)
Figure 16. Revenue assurance Market Share (%) – Organization Size, 2022 and 2030
Figure 17. BFSI Market Revenue and Forecasts To 2030 (US$ Million)
Figure 18. Hospitality Market Revenue and Forecasts To 2030 (US$ Million)
Figure 19. Telecom Market Revenue and Forecasts To 2030 (US$ Million)
Figure 20. Utilities Market Revenue and Forecasts To 2030 (US$ Million)
Figure 21. Others Market Revenue and Forecasts To 2030 (US$ Million)
Figure 22. Middle East Revenue Assurance Market Revenue And Forecasts To 2030 (US$ Million)
Figure 23. Middle East Revenue Assurance Market Breakdown by Component (2022 and 2023)
Figure 24. Middle East Revenue Assurance Market Breakdown by Deployment (2022 and 2023)
Figure 25. Middle East Revenue Assurance Market Breakdown by Organization Size (2022 and 2023)
Figure 26. Middle East Revenue Assurance Market Breakdown by Vertical (2022 and 2023)
Figure 27. Middle East Revenue Assurance Market Breakdown By Key Countries, 2022 And 2030 (%)
Figure 28. Saudi Arabia Revenue Assurance Market Revenue And Forecasts To 2030 (US$ Million)
Figure 29. UAE Revenue Assurance Market Revenue And Forecasts To 2030 (US$ Million)
Figure 30. Kuwait Revenue Assurance Market Revenue And Forecasts To 2030 (US$ Million)
Figure 31. Qatar Revenue Assurance Market Revenue And Forecasts To 2030 (US$ Million)
Figure 32. Oman Revenue Assurance Market Revenue And Forecasts To 2030 (US$ Million)
Figure 33. Rest of Middle East Revenue Assurance Market Revenue And Forecasts To 2030 (US$ Million)
Figure 34. Africa Revenue Assurance Market Revenue And Forecasts To 2030 (US$ Million)
Figure 35. Africa Revenue Assurance Market Breakdown by Component (2022 and 2023)
Figure 36. Africa Revenue Assurance Market Breakdown by Deployment (2022 and 2023)
Figure 37. Africa Revenue Assurance Market Breakdown by Organization Size (2022 and 2023)
Figure 38. Africa Revenue Assurance Market Breakdown by Vertical (2022 and 2023)
Figure 39. Africa Revenue Assurance Market Breakdown By Key Regions, 2022 And 2030 (%)
Figure 40. Northern Africa Revenue Assurance Market Revenue And Forecasts To 2030 (US$ Million)
Figure 41. Western Africa Assurance Market Revenue And Forecasts To 2030 (US$ Million)
Figure 42. Southern Africa Revenue Assurance Market Revenue And Forecasts To 2030 (US$ Million)
Figure 43. Eastern Africa Revenue Assurance Market Revenue And Forecasts To 2030 (US$ Million)
Figure 44. Central Africa Revenue Assurance Market Revenue And Forecasts To 2030 (US$ Million)
Figure 45. Heat Map Analysis By Key Players
The List of Companies - MEA Revenue Assurance Market
- Nokia Corp
- Tata Consultancy Services Ltd
- Amdocs Ltd
- Subex Ltd
- LATRO Services Inc
- Araxxe SAS
- BDO South Africa Inc
- Panamax Inc
- Adapt IT Holdings Proprietary Ltd
- Substratal Solutions Pvt Ltd
The Insight Partners performs research in 4 major stages: Data Collection & Secondary Research, Primary Research, Data Analysis and Data Triangulation & Final Review.
- Data Collection and Secondary Research:
As a market research and consulting firm operating from a decade, we have published many reports and advised several clients across the globe. First step for any study will start with an assessment of currently available data and insights from existing reports. Further, historical and current market information is collected from Investor Presentations, Annual Reports, SEC Filings, etc., and other information related to company’s performance and market positioning are gathered from Paid Databases (Factiva, Hoovers, and Reuters) and various other publications available in public domain.
Several associations trade associates, technical forums, institutes, societies and organizations are accessed to gain technical as well as market related insights through their publications such as research papers, blogs and press releases related to the studies are referred to get cues about the market. Further, white papers, journals, magazines, and other news articles published in the last 3 years are scrutinized and analyzed to understand the current market trends.
- Primary Research:
The primarily interview analysis comprise of data obtained from industry participants interview and answers to survey questions gathered by in-house primary team.
For primary research, interviews are conducted with industry experts/CEOs/Marketing Managers/Sales Managers/VPs/Subject Matter Experts from both demand and supply side to get a 360-degree view of the market. The primary team conducts several interviews based on the complexity of the markets to understand the various market trends and dynamics which makes research more credible and precise.
A typical research interview fulfils the following functions:
- Provides first-hand information on the market size, market trends, growth trends, competitive landscape, and outlook
- Validates and strengthens in-house secondary research findings
- Develops the analysis team’s expertise and market understanding
Primary research involves email interactions and telephone interviews for each market, category, segment, and sub-segment across geographies. The participants who typically take part in such a process include, but are not limited to:
- Industry participants: VPs, business development managers, market intelligence managers and national sales managers
- Outside experts: Valuation experts, research analysts and key opinion leaders specializing in the electronics and semiconductor industry.
Below is the breakup of our primary respondents by company, designation, and region:

Once we receive the confirmation from primary research sources or primary respondents, we finalize the base year market estimation and forecast the data as per the macroeconomic and microeconomic factors assessed during data collection.
- Data Analysis:
Once data is validated through both secondary as well as primary respondents, we finalize the market estimations by hypothesis formulation and factor analysis at regional and country level.
- 3.1 Macro-Economic Factor Analysis:
We analyse macroeconomic indicators such the gross domestic product (GDP), increase in the demand for goods and services across industries, technological advancement, regional economic growth, governmental policies, the influence of COVID-19, PEST analysis, and other aspects. This analysis aids in setting benchmarks for various nations/regions and approximating market splits. Additionally, the general trend of the aforementioned components aid in determining the market's development possibilities.
- 3.2 Country Level Data:
Various factors that are especially aligned to the country are taken into account to determine the market size for a certain area and country, including the presence of vendors, such as headquarters and offices, the country's GDP, demand patterns, and industry growth. To comprehend the market dynamics for the nation, a number of growth variables, inhibitors, application areas, and current market trends are researched. The aforementioned elements aid in determining the country's overall market's growth potential.
- 3.3 Company Profile:
The “Table of Contents” is formulated by listing and analyzing more than 25 - 30 companies operating in the market ecosystem across geographies. However, we profile only 10 companies as a standard practice in our syndicate reports. These 10 companies comprise leading, emerging, and regional players. Nonetheless, our analysis is not restricted to the 10 listed companies, we also analyze other companies present in the market to develop a holistic view and understand the prevailing trends. The “Company Profiles” section in the report covers key facts, business description, products & services, financial information, SWOT analysis, and key developments. The financial information presented is extracted from the annual reports and official documents of the publicly listed companies. Upon collecting the information for the sections of respective companies, we verify them via various primary sources and then compile the data in respective company profiles. The company level information helps us in deriving the base number as well as in forecasting the market size.
- 3.4 Developing Base Number:
Aggregation of sales statistics (2020-2022) and macro-economic factor, and other secondary and primary research insights are utilized to arrive at base number and related market shares for 2022. The data gaps are identified in this step and relevant market data is analyzed, collected from paid primary interviews or databases. On finalizing the base year market size, forecasts are developed on the basis of macro-economic, industry and market growth factors and company level analysis.
- Data Triangulation and Final Review:
The market findings and base year market size calculations are validated from supply as well as demand side. Demand side validations are based on macro-economic factor analysis and benchmarks for respective regions and countries. In case of supply side validations, revenues of major companies are estimated (in case not available) based on industry benchmark, approximate number of employees, product portfolio, and primary interviews revenues are gathered. Further revenue from target product/service segment is assessed to avoid overshooting of market statistics. In case of heavy deviations between supply and demand side values, all thes steps are repeated to achieve synchronization.
We follow an iterative model, wherein we share our research findings with Subject Matter Experts (SME’s) and Key Opinion Leaders (KOLs) until consensus view of the market is not formulated – this model negates any drastic deviation in the opinions of experts. Only validated and universally acceptable research findings are quoted in our reports.
We have important check points that we use to validate our research findings – which we call – data triangulation, where we validate the information, we generate from secondary sources with primary interviews and then we re-validate with our internal data bases and Subject matter experts. This comprehensive model enables us to deliver high quality, reliable data in shortest possible time.
Trends and growth analysis reports related to Middle East & Africa Revenue Assurance Market

Jan 2024
Flight Planning Software Market
Size and Forecast (2021 - 2031), Global and Regional Share, Trend, and Growth Opportunity Analysis Report Coverage: By Component (Software and Services), Deployment (Cloud and On-Premise), Application (Logistics and Cargo, Airport, Private Airlines, Commercial Airlines, Flight School and Training Center, and Military and Defense), and Geography
Jan 2024
Deepfake AI Detection Market
Size and Forecast (2021 - 2031), Global and Regional Share, Trend, and Growth Opportunity Analysis Report Coverage: By Component (Software and Services), Deployment (Cloud and On-Premises), Enterprise Size (Large Enterprises and SMEs), Industry Vertical (Media and Entertainment, BFSI, Government and Politics, Healthcare and Life Sciences, IT and Telecom, Retail and E-Commerce, and Others), and Geography
Jan 2024
Electronic Patient-Reported Outcomes (ePROS) Market
Size and Forecast (2021 - 2031), Global and Regional Share, Trend, and Growth Opportunity Analysis Report Coverage: By Delivery Mode (Cloud Based and On-Premises), Application (Oncology, Respiratory, and Others), End User [Contract Research Organizations (CROs), Pharmaceutical Companies, and Others], and Geography (North America, Europe, Asia Pacific, Middle East & Africa, and South & Central America)
Jan 2024
Travel and Expense Management Software Market
Size and Forecast (2021 - 2031), Global and Regional Share, Trend, and Growth Opportunity Analysis Report Coverage: By Deployment Mode (On-Premise and Cloud), Organization Size (Large Enterprises and Small and Medium Enterprises), Industry (BFSI, IT and Telecom, Manufacturing, Healthcare, Government and Defense, Retail, Transport and Logistics, and Others), and Geography
Jan 2024
Environmental Consulting Service Market
Size and Forecast (2021 - 2031), Global and Regional Share, Trend, and Growth Opportunity Analysis Report Coverage: By Service Type (Investment Assessment and Auditing, Permitting and Compliance, Project and Information Management, Monitoring and Testing, and Others), Media Type (Water Management, Waste Management, and Others), Vertical (Energy and Utilities, Chemical and Petroleum, Manufacturing and Process Industries, Transportation and Construction Industries, and Others), and Geography
Jan 2024
Cloud OSS BSS Market
Size and Forecast (2020 - 2030), Global and Regional Share, Trend, and Growth Opportunity Analysis Report Coverage: By solution [OSS (Network Management & Orchestration, Resource Management, Analytics & Assurance, and Service Design & Fulfilment) and BSS (Billing & Revenue Management, Product Management, Customer Management, and Others)], Deployment Model (Public Cloud, Private Cloud, and Hybrid Cloud), Enterprise Size (Small & Medium Enterprises and Large Enterprises), and Industry (IT & Telecom, BFSI, Media & Entertainment, Healthcare, and Others), and Geography
Jan 2024
Unified Endpoint Management Market
Size and Forecast (2021 - 2031), Global and Regional Share, Trend, and Growth Opportunity Analysis Report Coverage: By Component (Solutions and Services), Deployment Type (Cloud-Based and On-Premise), Platform (Desktop and Mobile), Organization Size (Large Enterprises and SMEs), End User (BFSI, Government and Defense, Healthcare, IT and Telecom, Automotive and Transportation, Retail, Manufacturing, and Others), and Geography
Jan 2024
AI in Computer Vision Market
Size and Forecast (2021–2031), Global and Regional Share, Trend, and Growth Opportunity Analysis Report Coverage: By Component (Software and Hardware) and End Use Industry (Security and Surveillance, Manufacturing, Automotive, Retail, Sports and Entertainment, and Others), and Geography
 Get Free Sample For