The natural fiber composites market is expected to grow from US$ 4,438.83 million in 2022 to US$ 6,910.46 million by 2028; it is estimated to register a CAGR of 7.7% from 2022 to 2028.
Natural fiber composites are composite materials with a polymer matrix embedded with high-strength natural fibers. Natural fibers are used as a component of composite materials, where the orientation of fibers impacts the properties. In composite materials, natural fibers often refer to plant fibers extracted from lignocellulosic biomass such as wood fibers and other plant fibers from the stem, leaf, fruit, and seed.
The demand for fiber-reinforced (glass and carbon fibers) composites is relatively high. However, they are expensive and are not environmentally friendly. These fibers are nonrenewable and nonrecyclable. Many European Union and Asian countries have introduced regulations for the automotive industry. According to European Union legislation passed in 2006, 80% of vehicles should be reused or recycled; in the 2015 revision, this percentage rose to 85%. According to a 2015 regulation in Japan, 95% of vehicles should be reused or recycled. Moreover, drawbacks such as high fiber density, poor recyclability, and handling hazards limit the use of glass fiber composites. These drawbacks of glass fiber composites boost the demand for natural fiber composites.
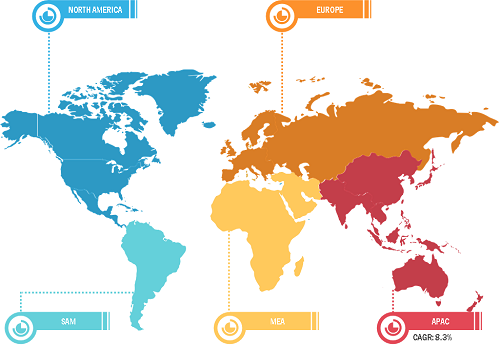
The natural fiber composites market is segmented into five major regions—North America, Europe, Asia Pacific, the Middle East & Africa, and South & Central America. In 2022, Europe held the largest market share, and Asia Pacific is estimated to register the highest CAGR during the forecast period. High demand for natural fiber composites from the automotive and construction industries favors the growth of the European natural fiber composites market. Further, Asia Pacific, the most populated region in the world, hosts one of the world's most rapidly developing construction and automotive industries. This factor contributes to the high demand for natural fiber composites in the region.
Customize Research To Suit Your Requirement
We can optimize and tailor the analysis and scope which is unmet through our standard offerings. This flexibility will help you gain the exact information needed for your business planning and decision making.
Natural Fiber Composites Market: Strategic Insights
Market Size Value in US$ 4,438.83 million in 2022 Market Size Value by US$ 6,910.46 million by 2028 Growth rate CAGR of 7.7% from 2022 to 2028 Forecast Period 2022-2028 Base Year 2022

Shejal
Have a question?
Shejal will walk you through a 15-minute call to present the report’s content and answer all queries if you have any.
 Speak to Analyst
Customize Research To Suit Your Requirement
We can optimize and tailor the analysis and scope which is unmet through our standard offerings. This flexibility will help you gain the exact information needed for your business planning and decision making.
Natural Fiber Composites Market: Strategic Insights
| Market Size Value in | US$ 4,438.83 million in 2022 |
| Market Size Value by | US$ 6,910.46 million by 2028 |
| Growth rate | CAGR of 7.7% from 2022 to 2028 |
| Forecast Period | 2022-2028 |
| Base Year | 2022 |
Shejal
Have a question?
Shejal will walk you through a 15-minute call to present the report’s content and answer all queries if you have any.
Speak to Analyst
Impact of COVID-19 Pandemic on Natural Fiber Composites Market
Before the COVID-19 pandemic, the natural fiber composites market was mainly driven by industries such as automotive, building & construction, sporting goods, and marine. In 2020, various industries had to slow down their operations due to disruptions in supply chains caused by the shutdown of national and international borders. The pandemic hampered manufacturing processes due to restrictions imposed by government authorities in various countries. Natural fiber reinforced composites have major applications in the aerospace and automobile industries, wherein they are used to manage the body weight of vehicles and fuel management. It is used in cement paste and mortar in the construction sector. Hence, with the reduction in activity in these sectors, the demand for natural fiber composites also decreased. The pandemic also caused fluctuations in the prices of raw materials. All these factors led to a decrease in demand for natural fiber composites.
However, in 2021, the economies started reviving as various industries resumed business activities. As a result, several industries, including automotive and building & construction, showed signs of recovery in their operations. Various industries are also overcoming the consequences of disruptions in their raw material supply chains. With such a promising recovery, the global industrial sector is expected to provide the impetus for the natural fiber composites market growth in the coming years.
Market Insights
Strategic Developments by Key Players Favor Natural Fiber Composites Market Growth
In July 2022, BMW Group, the premium carmaker's venture capital firm, invested in a Swiss clean tech company Bcomp Ltd, a manufacturer of high-performance components made from natural fibers. Such strategic developments by key players are expected to bolster the natural fiber composites market growth in the coming years. In addition, key market players are involved in strategies such as mergers and acquisitions to expand their geographic presence.
Raw Material-Based Insights
Based on raw material, the natural fiber composites market is segmented into the wood, cotton, flax, kenaf, hemp, and others. The hemp segment is expected to register the highest CAGR during the forecast period. Hemp fibers are found in the stem of the plant, making them strong. They are essential for the fortification of composite materials. With the surging demand for sustainable, biodegradable, and recyclable materials, the use of hemp fibers as support in composite materials has increased. Natural fiber composites made from hemp are biodegradable.
End User-Based Insights
Based on end user, the natural fiber composites market is divided into automotive & aerospace, building & construction, electrical & electronics, sporting goods, and others. The automotive & aerospace segment dominated the market in 2022. Natural fiber composites are widely used in fabricating electric car components because of their lightweight qualities. Due to their better stiffness and strength compared to other synthetic fibers and better acoustic insulation properties, these composites are also employed in vehicle door panels, seat backs, floor panels, underfloor pans, and trunk liners.
UPM-Kymmene Corp, Flexform Technologies LLC, Polyvlies Franz Beyer GmbH, Amorim Cork Composites SA, Tecnaro GmbH, Lanxess AG, Bcomp Ltd, Cobra Advanced Composites Co Ltd, Plasthill Oy Ltd, and Lingrove Inc are among the major players operating in the natural fiber composites market. These companies mainly focus on product innovation to expand their market share and follow emerging market trends.
Natural Fiber Composites Market Report Scope
Report Spotlights
- Progressive industry trends in the natural fiber composites market to help companies develop effective long-term strategies
- Business growth strategies adopted by market players in developed and developing countries
- Quantitative analysis of the natural fiber composites market from 2020 to 2028
- Estimation of global demand for natural fiber composites
- Porter's Five Forces analysis to illustrate the efficacy of buyers and suppliers operating in the natural fiber composites industry
- Recent developments to understand the competitive market scenario
- Market trends and outlook, as well as factors driving and restraining the growth of the natural fiber composites market
- Assistance in the decision-making process by highlighting market strategies that underpin commercial interest
- Size of the natural fiber composites market at various nodes
- Detailed overview and segmentation of the market and growth dynamics of the natural fiber composites industry
- Size of the natural fiber composites market in various regions with promising growth opportunities

Report Coverage
Revenue forecast, Company Analysis, Industry landscape, Growth factors, and Trends

Segment Covered
Raw Material , Technology, and End User

Regional Scope
North America, Europe, Asia Pacific, Middle East & Africa, South & Central America

Country Scope
Argentina, Australia, Brazil, Canada, China, France, Germany, India, Italy, Japan, Mexico, Russian Federation, Saudi Arabia, South Africa, South Korea, United Arab Emirates, United Kingdom, United States
Frequently Asked Questions
The primary advantage of natural fiber composites is that they are eco-friendly since they are low-cost, bio-based, sustainable, and reduce energy consumption. Natural fiber composites have drawn significant attention as alternative building materials, especially wood substitutes in developing countries. A high demand for sustainable and renewable composites from the automotive industry for the manufacturing of fuel-efficient, lightweight vehicles as well as rising adoption of electric vehicles (EVs) drives the natural fiber composites market. All these factors are driving the natural fiber composites market growth.
In 2022, the automotive segment held the largest market share. The rising demand for hybrid and electric vehicles has led to an increase in investments by automakers across the world. The flourishing automotive industry worldwide continues to be a key contributor to the growth of the natural fiber composites market. Natural fibers support the universal goal of the automotive industry to manufacture lightweight products with reduced fuel consumption and increased vehicle speeds, without compromising safety standards.
During the forecast period, the injection molding segment is expected to register highest CAGR. The injection molding process is a popular manufacturing method for mass production. Although the reinforcement fiber degrades during the process, high processability is a key factor that triggers the popularity of injection molding. Increasing demand for composite materials from automotive, hardware/apparatuses, medical, and bundling enterprises are driving the growth of the injection molding segment during the forecast period.
In 2022, the wood segment held the largest market share. Manufacturing wood fiber that is used to manufacture hardboard and insulation board is similar to that of MDF fiber. Wood contains polymers such as cellulose, lignin, and various hemicelluloses that have very different properties than synthetic polymers with which they are most often combined. Wood is stiffer, less expensive, and stronger than these synthetic polymers, making it a useful filler or reinforcement. These factors contribute to the dominance of the wood segment in the natural fiber composites market in 2022.
The major players operating in the natural fiber composites market are UPM-Kymmene Corp, Flexform Technologies LLC, Polyvlies Franz Beyer GmbH, Amorim Cork Composites SA, Tecnaro GmbH, Lanxess AG, Bcomp Ltd, Cobra Advanced Composites Co Ltd, Plasthill Oy Ltd, and Lingrove Inc.
In 2022, Europe accounted for the largest share of the global natural fiber composites market. The natural fiber composites market growth in this region is attributed to the high use of these materials in the automotive, aerospace, building & construction industries, among others. The construction sector in Europe has consistently expanded due to the rising population. Also, rapid shifts in the remodeling business trends, such as remodeling for accessibility, customizations, and technological integrations, are likely to fuel construction sector. All these factors led to the dominance of Europe region in 2022.
1. Introduction
1.1 Study Scope
1.2 The Insight Partners Research Report Guidance
1.3 Market Segmentation
1.3.1 Natural Fiber Composites Market, by Raw Material
1.3.2 Natural Fiber Composites Market, by Technology
1.3.3 Natural Fiber Composites Market, by End User
1.3.4 Natural Fiber Composites Market, by Geography
2. Key Takeaways
3. Research Methodology
3.1 Scope of the Study
3.2 Research Methodology
3.2.1 Data Collection:
3.2.2 Primary Interviews:
3.2.3 Hypothesis formulation:
3.2.4 Macro-economic factor analysis:
3.2.5 Developing base number:
3.2.6 Data Triangulation:
3.2.7 Country level data:
4. Natural Fiber Composites Market Landscape
4.1 Market Overview
4.2.1 Threat of New Entrants:
4.2.2 Bargaining Power of Buyers:
4.2.3 Bargaining Power of Suppliers:
4.2.4 Intensity of Competitive Rivalry:
4.3 Ecosystem Analysis
4.3.1 Raw Material Suppliers:
4.3.2 Natural Fiber Composites’ Manufacturing Process:
4.3.3 Distributors or Suppliers:
4.3.4 End Users
4.4 Expert Opinion
5. Global Natural Fiber Composites Market – Key Market Dynamics
5.1 Market Drivers
5.1.1 Increasing Demand for Natural Fiber Composites from Automotive Industry
5.1.2 Growing Focus on Eco-Friendly and Sustainable Products
5.2 Market Restraints
5.2.1 Hygroscopicity of Natural Fiber Composites
5.3 Market Opportunities
5.3.1 Applications of Natural Fiber Composites in Sporting Goods Applications
5.4 Future Trends
5.4.1 Development of Natural/Synthetic Fiber-Based Hybrid Composites
5.5 Impact Analysis
6. Natural Fiber Composites – Global Market Analysis
6.1 Natural Fiber Composites Market Overview
6.2 Natural Fiber Composites Market –Volume and Forecast to 2028 (Kilo Tons)
6.3 Natural Fiber Composites Market –Revenue and Forecast to 2028 (US$ Million)
6.4 Market Positioning – Key Market Players
7. Global Natural Fiber Composites Market Analysis – By Raw Material
7.1 Overview
7.2 Natural Fiber Composites Market, By Raw Material (2021 and 2028)
7.3 Wood
7.3.1 Overview
7.3.2 Wood: Natural Fiber Composites Market – Volume and Forecast to 2028 (Kilo Tons)
7.3.3 Wood: Natural Fiber Composites Market – Revenue and Forecast to 2028 (US$ Million)
7.4 Cotton
7.4.1 Overview
7.4.2 Cotton: Natural Fiber Composites Market – Volume and Forecast to 2028 (Kilo Tons)
7.4.3 Cotton: Natural Fiber Composites Market – Revenue and Forecast to 2028 (US$ Million)
7.5 Flax
7.5.1 Overview
7.5.2 Flax: Natural Fiber Composites Market – Volume and Forecast to 2028 (Kilo Tons)
7.5.3 Flax: Natural Fiber Composites Market – Revenue and Forecast to 2028 (US$ Million)
7.6 Kenaf
7.6.1 Overview
7.6.2 Kenaf: Natural Fiber Composites Market – Volume and Forecast to 2028 (Kilo Tons)
7.6.3 Kenaf: Natural Fiber Composites Market – Revenue and Forecast to 2028 (US$ Million)
7.7 Hemp
7.7.1 Overview
7.7.2 Hemp: Natural Fiber Composites Market – Volume and Forecast to 2028 (Kilo Tons)
7.7.3 Hemp: Natural Fiber Composites Market – Revenue and Forecast to 2028 (US$ Million)
7.8 Others
7.8.1 Overview
7.8.2 Others: Natural Fiber Composites Market – Volume and Forecast to 2028 (Kilo Tons)
7.8.3 Others: Natural Fiber Composites Market – Revenue and Forecast to 2028 (US$ Million)
8. Global Natural Fiber Composites Market Analysis – By Technology
8.1 Overview
8.2 Natural Fiber Composites Market, By Technology (2021 and 2028)
8.3 Injection Molding
8.3.1 Overview
8.3.2 Injection Molding: Natural Fiber Composites Market – Revenue and Forecast to 2028 (US$ Million)
8.4 Compression Molding
8.4.1 Overview
8.4.2 Compression Molding: Natural Fiber Composites Market – Revenue and Forecast to 2028 (US$ Million)
8.5 Pultrusion
8.5.1 Overview
8.5.2 Pultrusion: Natural Fiber Composites Market – Revenue and Forecast to 2028 (US$ Million)
8.6 Others
8.6.1 Overview
8.6.2 Others: Natural Fiber Composites Market – Revenue and Forecast to 2028 (US$ Million)
9. Global Natural Fiber Composites Market Analysis – By End User
9.1 Overview
9.2 Natural Fiber Composites Market, By End User (2021 and 2028)
9.3 Automotive & Aerospace
9.3.1 Overview
9.3.2 Automotive & Aerospace: Natural Fiber Composites Market – Revenue and Forecast to 2028 (US$ Million)
9.4 Building & Construction
9.4.1 Overview
9.4.2 Building & Construction: Natural Fiber Composites Market – Revenue and Forecast to 2028 (US$ Million)
9.5 Electrical & Electronics
9.5.1 Overview
9.5.2 Electrical & Electronics: Natural Fiber Composites Market – Revenue and Forecast to 2028 (US$ Million)
9.6 Sporting Goods
9.6.1 Overview
9.6.2 Sporting Goods: Natural Fiber Composites Market – Revenue and Forecast to 2028 (US$ Million)
9.7 Others
9.7.1 Overview
9.7.2 Others: Natural Fiber Composites Market – Revenue and Forecast to 2028 (US$ Million)
10. Global Natural Fiber Composites Market – Geographic Analysis
10.1 Overview
10.2 North America: Natural Fiber Composites Market
10.2.1 North America: Natural Fiber Composites Market –Volume and Forecast to 2028 (Kilo Tons)
10.2.2 North America: Natural Fiber Composites Market –Revenue and Forecast to 2028 (US$ Million)
10.2.3 North America: Natural Fiber Composites Market, by Raw Material
10.2.4 North America: Natural Fiber Composites Market, by Technology
10.2.5 North America: Natural Fiber Composites Market, by End User
10.2.6 North America: Natural Fiber Composites Market, by Key Country
10.2.6.1 US: Natural Fiber Composites Market –Volume and Forecast to 2028 (Kilo Tons)
10.2.6.2 US: Natural Fiber Composites Market –Revenue and Forecast to 2028 (US$ Million)
10.2.6.2.1 US: Natural Fiber Composites Market, by Raw Material
10.2.6.2.2 US: Natural Fiber Composites Market, by Raw Material
10.2.6.2.3 US: Natural Fiber Composites Market, by Technology
10.2.6.2.4 US: Natural Fiber Composites Market, by End User
10.2.6.3 Canada: Natural Fiber Composites Market–Volume and Forecast to 2028 (Kilo Tons)
10.2.6.4 Canada: Natural Fiber Composites Market–Revenue and Forecast to 2028 (US$ Million)
10.2.6.4.1 Canada: Natural Fiber Composites Market, by Raw Material
10.2.6.4.2 Canada: Natural Fiber Composites Market, by Raw Material
10.2.6.4.3 Canada: Natural Fiber Composites Market, by Technology
10.2.6.4.4 Canada: Natural Fiber Composites Market, by End User
10.2.6.5 Mexico: Natural Fiber Composites Market–Volume and Forecast to 2028 (Kilo Tons)
10.2.6.6 Mexico: Natural Fiber Composites Market–Revenue and Forecast to 2028 (US$ Million)
10.2.6.6.1 Mexico: Natural Fiber Composites Market, by Raw Material
10.2.6.6.2 Mexico: Natural Fiber Composites Market, by Raw Material
10.2.6.6.3 Mexico: Natural Fiber Composites Market, by Technology
10.2.6.6.4 Mexico: Natural Fiber Composites Market, by End User
10.3 Europe: Natural Fiber Composites Market
10.3.1 Europe: Natural Fiber Composites Market–Volume and Forecast to 2028 (Kilo Tons)
10.3.2 Europe: Natural Fiber Composites Market–Revenue and Forecast to 2028 (US$ Million)
10.3.3 Europe: Natural Fiber Composites Market, by Raw Material
10.3.4 Europe: Natural Fiber Composites Market, by Technology
10.3.5 Europe: Natural Fiber Composites Market, by End User
10.3.6 Europe: Natural Fiber Composites Market, by Key Country
10.3.6.1 Germany: Natural Fiber Composites Market–Volume and Forecast to 2028 (Kilo Tons)
10.3.6.2 Germany: Natural Fiber Composites Market–Revenue and Forecast to 2028 (US$ Million)
10.3.6.2.1 Germany: Natural Fiber Composites Market, by Raw Material
10.3.6.2.2 Germany: Natural Fiber Composites Market, by Raw Material
10.3.6.2.3 Germany: Natural Fiber Composites Market, by Technology
10.3.6.2.4 Germany: Natural Fiber Composites Market, by End User
10.3.6.3 France: Natural Fiber Composites Market–Volume and Forecast to 2028 (Kilo Tons)
10.3.6.4 France: Natural Fiber Composites Market–Revenue and Forecast to 2028 (US$ Million)
10.3.6.4.1 France: Natural Fiber Composites Market, by Raw Material
10.3.6.4.2 France: Natural Fiber Composites Market, by Raw Material
10.3.6.4.3 France: Natural Fiber Composites Market, by Technology
10.3.6.4.4 France: Natural Fiber Composites Market, by End User
10.3.6.5 Italy: Natural Fiber Composites Market–Volume and Forecast to 2028 (Kilo Tons)
10.3.6.6 Italy: Natural Fiber Composites Market–Revenue and Forecast to 2028 (US$ Million)
10.3.6.6.1 Italy: Natural Fiber Composites Market, by Raw Material
10.3.6.6.2 Italy: Natural Fiber Composites Market, by Raw Material
10.3.6.6.3 Italy: Natural Fiber Composites Market, by Technology
10.3.6.6.4 Italy: Natural Fiber Composites Market, by End User
10.3.6.7 United Kingdom: Natural Fiber Composites Market–Volume and Forecast to 2028 (Kilo Tons)
10.3.6.8 United Kingdom: Natural Fiber Composites Market–Revenue and Forecast to 2028 (US$ Million)
10.3.6.8.1 United Kingdom: Natural Fiber Composites Market, by Raw Material
10.3.6.8.2 United Kingdom: Natural Fiber Composites Market, by Raw Material
10.3.6.8.3 United Kingdom: Natural Fiber Composites Market, by Technology
10.3.6.8.4 United Kingdom: Natural Fiber Composites Market, by End User
10.3.6.9 Russia: Natural Fiber Composites Market–Volume and Forecast to 2028 (Kilo Tons)
10.3.6.10 Russia: Natural Fiber Composites Market–Revenue and Forecast to 2028 (US$ Million)
10.3.6.10.1 Russia: Natural Fiber Composites Market, by Raw Material
10.3.6.10.2 Russia: Natural Fiber Composites Market, by Raw Material
10.3.6.10.3 Russia: Natural Fiber Composites Market, by Technology
10.3.6.10.4 Russia: Natural Fiber Composites Market, by End User
10.3.6.11 Rest of Europe: Natural Fiber Composites Market – Volume and Forecast to 2028 (Kilo Tons)
10.3.6.12 Rest of Europe: Natural Fiber Composites Market –Revenue and Forecast to 2028 (US$ Million)
10.3.6.12.1 Rest of Europe: Natural Fiber Composites Market, by Raw Material
10.3.6.12.2 Rest of Europe: Natural Fiber Composites Market, by Raw Material
10.3.6.12.3 Rest of Europe: Natural Fiber Composites Market, by Technology
10.3.6.12.4 Rest of Europe: Natural Fiber Composites Market, by End User
10.4 Asia Pacific: Natural Fiber Composites Market
10.4.1 Asia Pacific: Natural Fiber Composites Market –Volume and Forecast to 2028 (Kilo Tons)
10.4.2 Asia Pacific: Natural Fiber Composites Market –Revenue and Forecast to 2028 (US$ Million)
10.4.3 Asia Pacific: Natural Fiber Composites Market, by Raw Material
10.4.4 Asia Pacific: Natural Fiber Composites Market, by Technology
10.4.5 Asia Pacific: Natural Fiber Composites Market, by End User
10.4.6 Asia Pacific: Natural Fiber Composites Market, by Key Country
10.4.6.1 Australia: Natural Fiber Composites Market – Volume and Forecast to 2028 (Kilo Tons)
10.4.6.2 Australia: Natural Fiber Composites Market –Revenue and Forecast to 2028 (US$ Million)
10.4.6.2.1 Australia: Natural Fiber Composites Market, by Raw Material
10.4.6.2.2 Australia: Natural Fiber Composites Market, by Raw Material
10.4.6.2.3 Australia: Natural Fiber Composites Market, by Technology
10.4.6.2.4 Australia: Natural Fiber Composites Market, by End User
10.4.6.3 China: Natural Fiber Composites Market – Volume and Forecast to 2028 (Kilo Tons)
10.4.6.4 China: Natural Fiber Composites Market –Revenue and Forecast to 2028 (US$ Million)
10.4.6.4.1 China: Natural Fiber Composites Market, by Raw Material
10.4.6.4.2 China: Natural Fiber Composites Market, by Raw Material
10.4.6.4.3 China: Natural Fiber Composites Market, by Technology
10.4.6.4.4 China: Natural Fiber Composites Market, by End User
10.4.6.5 India: Natural Fiber Composites Market – Volume and Forecast to 2028 (Kilo Tons)
10.4.6.6 India: Natural Fiber Composites Market –Revenue and Forecast to 2028 (US$ Million)
10.4.6.6.1 India: Natural Fiber Composites Market, by Raw Material
10.4.6.6.2 India: Natural Fiber Composites Market, by Raw Material
10.4.6.6.3 India: Natural Fiber Composites Market, by Technology
10.4.6.6.4 India: Natural Fiber Composites Market, by End User
10.4.6.7 Japan: Natural Fiber Composites Market – Volume and Forecast to 2028 (Kilo Tons)
10.4.6.8 Japan: Natural Fiber Composites Market –Revenue and Forecast to 2028 (US$ Million)
10.4.6.8.1 Japan: Natural Fiber Composites Market, by Raw Material
10.4.6.8.2 Japan: Natural Fiber Composites Market, by Raw Material
10.4.6.8.3 Japan: Natural Fiber Composites Market, by Technology
10.4.6.8.4 Japan: Natural Fiber Composites Market, by End User
10.4.6.9 South Korea: Natural Fiber Composites Market – Volume and Forecast to 2028 (Kilo Tons)
10.4.6.10 South Korea: Natural Fiber Composites Market –Revenue and Forecast to 2028 (US$ Million)
10.4.6.10.1 South Korea: Natural Fiber Composites Market, by Raw Material
10.4.6.10.2 South Korea: Natural Fiber Composites Market, by Raw Material
10.4.6.10.3 South Korea: Natural Fiber Composites Market, by Technology
10.4.6.10.4 South Korea: Natural Fiber Composites Market, by End User
10.4.6.11 Rest of Asia Pacific: Natural Fiber Composites Market – Volume and Forecast to 2028 (Kilo Tons)
10.4.6.12 Rest of Asia Pacific: Natural Fiber Composites Market –Revenue and Forecast to 2028 (US$ Million)
10.4.6.12.1 Rest of Asia Pacific: Natural Fiber Composites Market, by Raw Material
10.4.6.12.2 Rest of Asia Pacific: Natural Fiber Composites Market, by Raw Material
10.4.6.12.3 Rest of Asia Pacific: Natural Fiber Composites Market, by Technology
10.4.6.12.4 Rest of Asia Pacific: Natural Fiber Composites Market, by End User
10.5 Middle East and Africa: Natural Fiber Composites Market
10.5.1 Middle East and Africa: Natural Fiber Composites Market –Volume and Forecast to 2028 (Kilo Tons)
10.5.2 Middle East and Africa: Natural Fiber Composites Market –Revenue and Forecast to 2028 (US$ Million)
10.5.3 Middle East and Africa: Natural Fiber Composites Market, by Raw Material
10.5.4 Middle East and Africa: Natural Fiber Composites Market, by Technology
10.5.5 Middle East and Africa: Natural Fiber Composites Market, by End User
10.5.6 Middle East and Africa: Natural Fiber Composites Market, by Key Country
10.5.6.1 South Africa: Natural Fiber Composites Market –Volume and Forecast to 2028 (Kilo Tons)
10.5.6.2 South Africa: Natural Fiber Composites Market –Revenue and Forecast to 2028 (US$ Million)
10.5.6.2.1 South Africa: Natural Fiber Composites Market, by Raw Material
10.5.6.2.2 South Africa: Natural Fiber Composites Market, by Raw Material
10.5.6.2.3 South Africa: Natural Fiber Composites Market, by Technology
10.5.6.2.4 South Africa: Natural Fiber Composites Market, by End User
10.5.6.3 Saudi Arabia: Natural Fiber Composites Market –Volume and Forecast to 2028 (Kilo Tons)
10.5.6.4 Saudi Arabia: Natural Fiber Composites Market –Revenue and Forecast to 2028 (US$ Million)
10.5.6.4.1 Saudi Arabia: Natural Fiber Composites Market, by Raw Material
10.5.6.4.2 Saudi Arabia: Natural Fiber Composites Market, by Raw Material
10.5.6.4.3 Saudi Arabia: Natural Fiber Composites Market, by Technology
10.5.6.4.4 Saudi Arabia: Natural Fiber Composites Market, by End User
10.5.6.5 UAE: Natural Fiber Composites Market –Volume and Forecast to 2028 (Kilo Tons)
10.5.6.6 UAE: Natural Fiber Composites Market –Revenue and Forecast to 2028 (US$ Million)
10.5.6.6.1 UAE: Natural Fiber Composites Market, by Raw Material
10.5.6.6.2 UAE: Natural Fiber Composites Market, by Raw Material
10.5.6.6.3 UAE: Natural Fiber Composites Market, by Technology
10.5.6.6.4 UAE: Natural Fiber Composites Market, by End User
10.5.6.7 Rest of MEA: Natural Fiber Composites Market –Volume and Forecast to 2028 (Kilo Tons)
10.5.6.8 Rest of MEA: Natural Fiber Composites Market –Revenue and Forecast to 2028 (US$ Million)
10.5.6.8.1 Rest of MEA: Natural Fiber Composites Market, by Raw Material
10.5.6.8.2 Rest of MEA: Natural Fiber Composites Market, by Raw Material
10.5.6.8.3 Rest of MEA: Natural Fiber Composites Market, by Technology
10.5.6.8.4 Rest of MEA: Natural Fiber Composites Market, by End User
10.6 South & Central America: Natural Fiber Composites Market
10.6.1 South & Central America: Natural Fiber Composites Market –Volume and Forecast to 2028 (Kilo Tons)
10.6.2 South & Central America: Natural Fiber Composites Market –Revenue and Forecast to 2028 (US$ Million)
10.6.3 South & Central America: Natural Fiber Composites Market, by Raw Material
10.6.4 South & Central America: Natural Fiber Composites Market, by Technology
10.6.5 South & Central America: Natural Fiber Composites Market, by End User
10.6.6 South & Central America: Natural Fiber Composites Market, by Key Country
10.6.6.1 Brazil: Natural Fiber Composites Market –Volume and Forecast to 2028 (Kilo Tons)
10.6.6.2 Brazil: Natural Fiber Composites Market –Revenue and Forecast to 2028 (US$ Million)
10.6.6.2.1 Brazil: Natural Fiber Composites Market, by Raw Material
10.6.6.2.2 Brazil: Natural Fiber Composites Market, by Raw Material
10.6.6.2.3 Brazil: Natural Fiber Composites Market, by Technology
10.6.6.2.4 Brazil: Natural Fiber Composites Market, by End User
10.6.6.3 Argentina: Natural Fiber Composites Market –Volume and Forecast to 2028 (Kilo Tons)
10.6.6.4 Argentina: Natural Fiber Composites Market –Revenue and Forecast to 2028 (US$ Million)
10.6.6.4.1 Argentina: Natural Fiber Composites Market, by Raw Material
10.6.6.4.2 Argentina: Natural Fiber Composites Market, by Raw Material
10.6.6.4.3 Argentina: Natural Fiber Composites Market, by Technology
10.6.6.4.4 Argentina: Natural Fiber Composites Market, by End User
10.6.6.5 Rest of South & Central America: Natural Fiber Composites Market –Volume and Forecast to 2028 (Kilo Tons)
10.6.6.6 Rest of South & Central America: Natural Fiber Composites Market –Revenue and Forecast to 2028 (US$ Million)
10.6.6.6.1 Rest of South & Central America: Natural Fiber Composites Market, by Raw Material
10.6.6.6.2 Rest of South & Central America: Natural Fiber Composites Market, by Raw Material
10.6.6.6.3 Rest of South & Central America: Natural Fiber Composites Market, by Technology
10.6.6.6.4 Rest of South & Central America: Natural Fiber Composites Market, by End User
11. Impact of COVID-19 Pandemic on Natural Fiber Composites Market
11.1 Overview
11.2 Impact of COVID-19 on Natural Fiber Composites Market
11.3 North America: Impact Assessment of COVID-19 Pandemic
11.4 Europe: Impact Assessment of COVID-19 Pandemic
11.5 Asia Pacific: Impact Assessment of COVID-19 Pandemic
11.6 Middle East & Africa: Impact Assessment of COVID-19 Pandemic
11.7 South and Central America: Impact Assessment of COVID-19 Pandemic
12. Industry Landscape
12.1 Overview
12.2 Market Initiative
12.3 New Product Development
13. Company Profiles
13.1 UPM-Kymmene Corp
13.1.1 Key Facts
13.1.2 Business Description
13.1.3 Products and Services
13.1.4 Financial Overview
13.1.5 SWOT Analysis
13.1.6 Key Developments
13.2 Flexform Technologies LLC
13.2.1 Key Facts
13.2.2 Business Description
13.2.3 Products and Services
13.2.4 Financial Overview
13.2.5 SWOT Analysis
13.2.6 Key Developments
13.3 Polyvlies Franz Beyer GmbH
13.3.1 Key Facts
13.3.2 Business Description
13.3.3 Products and Services
13.3.4 Financial Overview
13.3.5 SWOT Analysis
13.3.6 Key Developments
13.4 Amorim Cork Composites SA
13.4.1 Key Facts
13.4.2 Business Description
13.4.3 Products and Services
13.4.4 Financial Overview
13.4.5 SWOT Analysis
13.4.6 Key Developments
13.5 Tecnaro GmbH
13.5.1 Key Facts
13.5.2 Business Description
13.5.3 Products and Services
13.5.4 Financial Overview
13.5.5 SWOT Analysis
13.5.6 Key Developments
13.6 Lanxess AG
13.6.1 Key Facts
13.6.2 Business Description
13.6.3 Products and Services
13.6.4 Financial Overview
13.6.5 SWOT Analysis
13.6.6 Key Developments
13.7 Bcomp Ltd
13.7.1 Key Facts
13.7.2 Business Description
13.7.3 Products and Services
13.7.4 Financial Overview
13.7.5 SWOT Analysis
13.7.6 Key Developments
13.8 Cobra Advanced Composites Co Ltd
13.8.1 Key Facts
13.8.2 Business Description
13.8.3 Products and Services
13.8.4 Financial Overview
13.8.5 SWOT Analysis
13.8.6 Key Developments
13.9 Plasthill Oy Ltd
13.9.1 Key Facts
13.9.2 Business Description
13.9.3 Products and Services
13.9.4 Financial Overview
13.9.5 SWOT Analysis
13.9.6 Key Developments
13.10 Lingrove Inc
13.10.1 Key Facts
13.10.2 Business Description
13.10.3 Products and Services
13.10.4 Financial Overview
13.10.5 SWOT Analysis
13.10.6 Key Developments
14. Appendix
14.1 About The Insight Partners
14.2 Glossary of Terms
LIST OF TABLES
Table 1. Natural Fiber Composites Market –Volume and Forecast to 2028 (Kilo Tons)
Table 2. Natural Fiber Composites Market –Revenue and Forecast to 2028 (US$ Million)
Table 3. Global Natural Fiber Composites Market, by Raw Material – Volume and Forecast to 2028 (Kilo Tons)
Table 4. Global Natural Fiber Composites Market, by Raw Material – Revenue and Forecast to 2028 (US$ Million)
Table 5. Global Natural Fiber Composites Market, by Technology – Revenue and Forecast to 2028 (US$ Million)
Table 6. Global Natural Fiber Composites Market, by End User – Revenue and Forecast to 2028 (US$ Million)
Table 7. North America Natural Fiber Composites Market, by Raw Material – Volume and Forecast to 2028 (Kilo Tons)
Table 8. North America Natural Fiber Composites Market, by Raw Material – Revenue and Forecast to 2028 (US$ Million)
Table 9. North America Natural Fiber Composites Market, by Technology – Revenue and Forecast to 2028 (US$ Million)
Table 10. North America Natural Fiber Composites Market, by End User – Revenue and Forecast to 2028 (US$ Million)
Table 11. US Natural Fiber Composites Market, by Raw Material – Volume and Forecast to 2028 (Kilo Tons)
Table 12. US Natural Fiber Composites Market, by Raw Material – Revenue and Forecast to 2028 (US$ Million)
Table 13. US Natural Fiber Composites Market, by Technology – Revenue and Forecast to 2028 (US$ Million)
Table 14. US Natural Fiber Composites Market, by End User – Revenue and Forecast to 2028 (US$ Million)
Table 15. Canada: Natural Fiber Composites Market, by Raw Material – Volume and Forecast to 2028 (Kilo Tons)
Table 16. Canada: Natural Fiber Composites Market, by Raw Material – Revenue and Forecast to 2028 (US$ Million)
Table 17. Canada: Natural Fiber Composites Market, by Technology – Revenue and Forecast to 2028 (US$ Million)
Table 18. Canada: Natural Fiber Composites Market, by End User – Revenue and Forecast to 2028 (US$ Million)
Table 19. Mexico Natural Fiber Composites Market, by Raw Material – Volume and Forecast to 2028 (Kilo Tons)
Table 20. Mexico Natural Fiber Composites Market, by Raw Material – Revenue and Forecast to 2028 (US$ Million)
Table 21. Mexico Natural Fiber Composites Market, by Technology – Revenue and Forecast to 2028 (US$ Million)
Table 22. Mexico Natural Fiber Composites Market, by End User – Revenue and Forecast to 2028 (US$ Million)
Table 23. Europe Natural Fiber Composites Market, by Raw Material – Volume and Forecast to 2028 (Kilo Tons)
Table 24. Europe Natural Fiber Composites Market, by Raw Material – Revenue and Forecast to 2028 (US$ Million)
Table 25. Europe Natural Fiber Composites Market, by Technology – Revenue and Forecast to 2028 (US$ Million)
Table 26. Europe Natural Fiber Composites Market, by End User – Revenue and Forecast to 2028 (US$ Million)
Table 27. Germany Natural Fiber Composites Market, by Raw Material – Volume and Forecast to 2028 (Kilo Tons)
Table 28. Germany Natural Fiber Composites Market, by Raw Material – Revenue and Forecast to 2028 (US$ Million)
Table 29. Germany Natural Fiber Composites Market, by Technology – Revenue and Forecast to 2028 (US$ Million)
Table 30. Germany Natural Fiber Composites Market, by End User – Revenue and Forecast to 2028 (US$ Million)
Table 31. France Natural Fiber Composites Market, by Raw Material – Volume and Forecast to 2028 (Kilo Tons)
Table 32. France Natural Fiber Composites Market, by Raw Material – Revenue and Forecast to 2028 (US$ Million)
Table 33. France Natural Fiber Composites Market, by Technology – Revenue and Forecast to 2028 (US$ Million)
Table 34. France Natural Fiber Composites Market, by End User – Revenue and Forecast to 2028 (US$ Million)
Table 35. Italy Natural Fiber Composites Market, by Raw Material – Volume and Forecast to 2028 (Kilo Tons)
Table 36. Italy Natural Fiber Composites Market, by Raw Material – Revenue and Forecast to 2028 (US$ Million)
Table 37. Italy Natural Fiber Composites Market, by Technology – Revenue and Forecast to 2028 (US$ Million)
Table 38. Italy Natural Fiber Composites Market, by End User – Revenue and Forecast to 2028 (US$ Million)
Table 39. United Kingdom Natural Fiber Composites Market, by Raw Material – Volume and Forecast to 2028 (Kilo Tons)
Table 40. United Kingdom Natural Fiber Composites Market, by Raw Material – Revenue and Forecast to 2028 (US$ Million)
Table 41. United Kingdom Natural Fiber Composites Market, by Technology – Revenue and Forecast to 2028 (US$ Million)
Table 42. United Kingdom Natural Fiber Composites Market, by End User – Revenue and Forecast to 2028 (US$ Million)
Table 43. Russia: Natural Fiber Composites Market, by Raw Material– Volume and Forecast to 2028 (Kilo Tons)
Table 44. Russia: Natural Fiber Composites Market, by Raw Material– Revenue and Forecast to 2028 (US$ Million)
Table 45. Russia: Natural Fiber Composites Market, by Technology – Revenue and Forecast to 2028 (US$ Million)
Table 46. Russia: Natural Fiber Composites Market, by End User – Revenue and Forecast to 2028 (US$ Million)
Table 47. Rest of Europe Natural Fiber Composites Market, by Raw Material – Volume and Forecast to 2028 (Kilo Tons)
Table 48. Rest of Europe Natural Fiber Composites Market, by Raw Material – Revenue and Forecast to 2028 (US$ Million)
Table 49. Rest of Europe Natural Fiber Composites Market, by Technology – Revenue and Forecast to 2028 (US$ Million)
Table 50. Rest of Europe Natural Fiber Composites Market, by End User – Revenue and Forecast to 2028 (US$ Million)
Table 51. Asia Pacific Natural Fiber Composites Market, by Raw Material – Volume and Forecast to 2028 (Kilo Tons)
Table 52. Asia Pacific Natural Fiber Composites Market, by Raw Material – Revenue and Forecast to 2028 (US$ Million)
Table 53. Asia Pacific Natural Fiber Composites Market, by Technology – Revenue and Forecast to 2028 (US$ Million)
Table 54. Asia Pacific Natural Fiber Composites Market, by End User – Revenue and Forecast to 2028 (US$ Million)
Table 55. Australia Natural Fiber Composites Market, by Raw Material– Volume and Forecast to 2028 (Kilo Tons)
Table 56. Australia Natural Fiber Composites Market, by Raw Material– Revenue and Forecast to 2028 (US$ Million)
Table 57. Australia Natural Fiber Composites Market, by Technology – Revenue and Forecast to 2028 (US$ Million)
Table 58. Australia Natural Fiber Composites Market, by End User – Revenue and Forecast to 2028 (US$ Million)
Table 59. China Natural Fiber Composites Market, by Raw Material – Volume and Forecast to 2028 (Kilo Tons)
Table 60. China Natural Fiber Composites Market, by Raw Material – Revenue and Forecast to 2028 (US$ Million)
Table 61. China Natural Fiber Composites Market, by Technology – Revenue and Forecast to 2028 (US$ Million)
Table 62. China Natural Fiber Composites Market, by End User – Revenue and Forecast to 2028 (US$ Million)
Table 63. India Natural Fiber Composites Market, by Raw Material – Volume and Forecast to 2028 (Kilo Tons)
Table 64. India Natural Fiber Composites Market, by Raw Material – Revenue and Forecast to 2028 (US$ Million)
Table 65. India Natural Fiber Composites Market, by Technology – Revenue and Forecast to 2028 (US$ Million)
Table 66. India Natural Fiber Composites Market, by End User – Revenue and Forecast to 2028 (US$ Million)
Table 67. Japan Natural Fiber Composites Market, by Raw Material – Volume and Forecast to 2028 (Kilo Tons)
Table 68. Japan Natural Fiber Composites Market, by Raw Material – Revenue and Forecast to 2028 (US$ Million)
Table 69. Japan Natural Fiber Composites Market, by Technology – Revenue and Forecast to 2028 (US$ Million)
Table 70. Japan Natural Fiber Composites Market, by End User – Revenue and Forecast to 2028 (US$ Million)
Table 71. South Korea Natural Fiber Composites Market, by Raw Material – Volume and Forecast to 2028 (Kilo Tons)
Table 72. South Korea Natural Fiber Composites Market, by Raw Material – Revenue and Forecast to 2028 (US$ Million)
Table 73. South Korea Natural Fiber Composites Market, by Technology – Revenue and Forecast to 2028 (US$ Million)
Table 74. South Korea Natural Fiber Composites Market, by End User – Revenue and Forecast to 2028 (US$ Million)
Table 75. Rest of Asia Pacific Natural Fiber Composites Market, by Raw Material – Volume and Forecast to 2028 (Kilo Tons)
Table 76. Rest of Asia Pacific Natural Fiber Composites Market, by Raw Material – Revenue and Forecast to 2028 (US$ Million)
Table 77. Rest of Asia Pacific Natural Fiber Composites Market, by Technology – Revenue and Forecast to 2028 (US$ Million)
Table 78. Rest of Asia Pacific Natural Fiber Composites Market, by End User – Revenue and Forecast to 2028 (US$ Million)
Table 83. South Africa Natural Fiber Composites Market, by Raw Material – Volume and Forecast to 2028 (Kilo Tons)
Table 84. South Africa Natural Fiber Composites Market, by Raw Material – Revenue and Forecast to 2028 (US$ Million)
Table 85. South Africa Natural Fiber Composites Market, by Technology – Revenue and Forecast to 2028 (US$ Million)
Table 86. South Africa Natural Fiber Composites Market, by End User – Revenue and Forecast to 2028 (US$ Million)
Table 87. Saudi Arabia Natural Fiber Composites Market, by Raw Material – Volume and Forecast to 2028 (Kilo Tons)
Table 88. Saudi Arabia Natural Fiber Composites Market, by Raw Material – Revenue and Forecast to 2028 (US$ Million)
Table 89. Saudi Arabia Natural Fiber Composites Market, by Technology – Revenue and Forecast to 2028 (US$ Million)
Table 90. Saudi Arabia Natural Fiber Composites Market, by End User – Revenue and Forecast to 2028 (US$ Million)
Table 91. UAE Natural Fiber Composites Market, by Raw Material – Volume and Forecast to 2028 (Kilo Tons)
Table 92. UAE Natural Fiber Composites Market, by Raw Material – Revenue and Forecast to 2028 (US$ Million)
Table 93. UAE Natural Fiber Composites Market, by Technology – Revenue and Forecast to 2028 (US$ Million)
Table 94. UAE Natural Fiber Composites Market, by End User – Revenue and Forecast to 2028 (US$ Million)
Table 95. Rest of MEA Natural Fiber Composites Market, by Raw Material – Volume and Forecast to 2028 (Kilo Tons)
Table 96. Rest of MEA Natural Fiber Composites Market, by Raw Material – Revenue and Forecast to 2028 (US$ Million)
Table 97. Rest of MEA Natural Fiber Composites Market, by Technology – Revenue and Forecast to 2028 (US$ Million)
Table 98. Rest of MEA Natural Fiber Composites Market, by End User – Revenue and Forecast to 2028 (US$ Million)
Table 99. South & Central America Natural Fiber Composites Market, by Raw Material – Volume and Forecast to 2028 (Kilo Tons)
Table 100. South & Central America Natural Fiber Composites Market, by Raw Material – Revenue and Forecast to 2028 (US$ Million)
Table 101. South & Central America Natural Fiber Composites Market, by Technology – Revenue and Forecast to 2028 (US$ Million)
Table 102. South & Central America Natural Fiber Composites Market, by End User – Revenue and Forecast to 2028 (US$ Million)
Table 103. Brazil Natural Fiber Composites Market, by Raw Material – Volume and Forecast to 2028 (Kilo Tons)
Table 104. Brazil Natural Fiber Composites Market, by Raw Material – Revenue and Forecast to 2028 (US$ Million)
Table 105. Brazil Natural Fiber Composites Market, by Technology – Revenue and Forecast to 2028 (US$ Million)
Table 106. Brazil Natural Fiber Composites Market, by End User – Revenue and Forecast to 2028 (US$ Million)
Table 107. Argentina Natural Fiber Composites Market, by Raw Material – Volume and Forecast to 2028 (Kilo Tons)
Table 108. Argentina Natural Fiber Composites Market, by Raw Material – Revenue and Forecast to 2028 (US$ Million)
Table 109. Argentina Natural Fiber Composites Market, by Technology – Revenue and Forecast to 2028 (US$ Million)
Table 110. Argentina Natural Fiber Composites Market, by End User – Revenue and Forecast to 2028 (US$ Million)
Table 111. Rest of South & Central America Natural Fiber Composites Market, by Raw Material – Volume and Forecast to 2028 (Kilo Tons)
Table 112. Rest of South & Central America Natural Fiber Composites Market, by Raw Material – Revenue and Forecast to 2028 (US$ Million)
Table 113. Rest of South & Central America Natural Fiber Composites Market, by Technology – Revenue and Forecast to 2028 (US$ Million)
Table 114. Rest of South & Central America Natural Fiber Composites Market, by End User – Revenue and Forecast to 2028 (US$ Million)
Table 115. Glossary of Terms, Global Natural Fiber Composites Market
LIST OF FIGURES
Figure 1. Natural Fiber Composites Market Segmentation
Figure 2. Natural Fiber Composites Market Segmentation – By Geography
Figure 3. Global Natural Fiber Composites Market Overview
Figure 4. Global Natural Fiber Composites Market, By Raw Material
Figure 5. Global Natural Fiber Composites Market, by Geography
Figure 6. Global Natural Fiber Composites Market, Industry Landscape
Figure 7. Porter's Five Forces Analysis
Figure 8. Ecosystem: Natural Fiber Composites Market
Figure 9. Expert Opinion
Figure 10. Global Natural Fiber Composites Market Impact Analysis of Drivers and Restraints
Figure 11. Geographic Overview of Natural Fiber Composites Market
Figure 12. Natural Fiber Composites Market – Volume and Forecast to 2028 (Kilo Tons)
Figure 13. Natural Fiber Composites Market – Revenue and Forecast to 2028 (US$ Million)
Figure 14. Natural Fiber Composites Market Revenue Share, By Raw Material (2021 and 2028)
Figure 15. Wood: Natural Fiber Composites Market – Volume and Forecast To 2028 (Kilo Tons)
Figure 16. Wood: Natural Fiber Composites Market – Revenue and Forecast To 2028 (US$ Million)
Figure 17. Cotton : Natural Fiber Composites Market – Volume and Forecast To 2028 (Kilo Tons)
Figure 18. Cotton : Natural Fiber Composites Market – Revenue and Forecast To 2028 (US$ Million)
Figure 19. Flax: Natural Fiber Composites Market – Volume and Forecast To 2028 (Kilo Tons)
Figure 20. Flax: Natural Fiber Composites Market – Revenue and Forecast To 2028 (US$ Million)
Figure 21. Kenaf: Natural Fiber Composites Market – Volume and Forecast To 2028 (Kilo Tons)
Figure 22. Kenaf Natural Fiber Composites Market – Revenue and Forecast To 2028 (US$ Million)
Figure 23. Hemp: Natural Fiber Composites Market – Volume and Forecast To 2028 (Kilo Tons)
Figure 24. Hemp Natural Fiber Composites Market – Revenue and Forecast To 2028 (US$ Million)
Figure 25. Others: Natural Fiber Composites Market – Volume and Forecast To 2028 (Kilo Tons)
Figure 26. Others Natural Fiber Composites Market – Revenue and Forecast To 2028 (US$ Million)
Figure 27. Natural Fiber Composites Market Revenue Share, By Technology (2021 and 2028)
Figure 28. Injection Molding: Natural Fiber Composites Market – Revenue and Forecast To 2028 (US$ Million)
Figure 29. Compression Molding: Natural Fiber Composites Market – Revenue and Forecast To 2028 (US$ Million)
Figure 30. Pultrusion: Natural Fiber Composites Market – Revenue and Forecast To 2028 (US$ Million)
Figure 31. Others: Natural Fiber Composites Market – Revenue and Forecast To 2028 (US$ Million)
Figure 32. Natural Fiber Composites Market Revenue Share, By End User (2021 and 2028)
Figure 33. Automotive & Aerospace: Natural Fiber Composites Market – Revenue and Forecast To 2028 (US$ Million)
Figure 34. Building & Construction: Natural Fiber Composites Market – Revenue and Forecast To 2028 (US$ Million)
Figure 35. Electrical & Electronics: Natural Fiber Composites Market – Revenue and Forecast To 2028 (US$ Million)
Figure 36. Sporting Goods: Natural Fiber Composites Market – Revenue and Forecast To 2028 (US$ Million)
Figure 37. Others: Natural Fiber Composites Market – Revenue and Forecast To 2028 (US$ Million)
Figure 38. Global Natural Fiber Composites Market Revenue Share, by Region (2021 and 2028)
Figure 39. North America: Natural Fiber Composites Market –Volume and Forecast to 2028 (Kilo Tons)
Figure 40. North America: Natural Fiber Composites Market – Revenue and Forecast to 2028 (US$ Million)
Figure 41. North America: Natural Fiber Composites Market Revenue Share, by Raw Material (2021 and 2028)
Figure 42. North America: Natural Fiber Composites Market Revenue Share, by Technology (2021 and 2028)
Figure 43. North America: Natural Fiber Composites Market Revenue Share, by End User (2021 and 2028)
Figure 44. North America: Natural Fiber Composites Market Revenue Share, by Key Country (2021 and 2028)
Figure 45. US: Natural Fiber Composites Market –Volume and Forecast to 2028 (Kilo Tons)
Figure 46. US: Natural Fiber Composites Market –Revenue and Forecast to 2028 (US$ Million)
Figure 47. Canada: Natural Fiber Composites Market–Volume and Forecast to 2028 (Kilo Tons)
Figure 48. Canada: Natural Fiber Composites Market–Revenue and Forecast to 2028 (US$ Million)
Figure 49. Mexico: Natural Fiber Composites Market–Volume and Forecast to 2028 (Kilo Tons)
Figure 50. Mexico: Natural Fiber Composites Market–Revenue and Forecast to 2028 (US$ Million)
Figure 51. Europe: Natural Fiber Composites Market–Volume and Forecast to 2028 (Kilo Tons)
Figure 52. Europe: Natural Fiber Composites Market– Revenue and Forecast to 2028 (US$ Million)
Figure 53. Europe: Natural Fiber Composites Market Revenue Share, by Raw Material (2021 and 2028)
Figure 54. Europe: Natural Fiber Composites Market Revenue Share, by Technology (2021 and 2028)
Figure 55. Europe: Natural Fiber Composites Market Revenue Share, by End User (2021 and 2028)
Figure 56. Europe: Natural Fiber Composites Market Revenue Share, by Key Country (2021 and 2028)
Figure 57. Germany: Natural Fiber Composites Market–Volume and Forecast to 2028 (Kilo Tons)
Figure 58. Germany: Natural Fiber Composites Market–Revenue and Forecast to 2028 (US$ Million)
Figure 59. France: Natural Fiber Composites Market–Volume and Forecast to 2028 (Kilo Tons)
Figure 60. France: Natural Fiber Composites Market–Revenue and Forecast to 2028 (US$ Million)
Figure 61. Italy: Natural Fiber Composites Market–Volume and Forecast to 2028 (Kilo Tons)
Figure 62. Italy: Natural Fiber Composites Market–Revenue and Forecast to 2028 (US$ Million)
Figure 63. United Kingdom: Natural Fiber Composites Market–Volume and Forecast to 2028 (Kilo Tons)
Figure 64. United Kingdom: Natural Fiber Composites Market–Revenue and Forecast to 2028 (US$ Million)
Figure 65. Russia: Natural Fiber Composites Market– Volume and Forecast to 2028 (Kilo Tons)
Figure 66. Russia: Natural Fiber Composites Market–Revenue and Forecast to 2028 (US$ Million)
Figure 67. Rest of Europe: Natural Fiber Composites Market – Volume and Forecast to 2028 (Kilo Tons)
Figure 68. Rest of Europe: Natural Fiber Composites Market –Revenue and Forecast to 2028 (US$ Million)
Figure 69. Asia Pacific: Natural Fiber Composites Market – Volume and Forecast to 2028 (Kilo Tons)
Figure 70. Asia Pacific: Natural Fiber Composites Market – Revenue and Forecast to 2028 (US$ Million)
Figure 71. Asia Pacific: Natural Fiber Composites Market Revenue Share, by Raw Material (2021 and 2028)
Figure 72. Asia Pacific: Natural Fiber Composites Market Revenue Share, by Technology (2021 and 2028)
Figure 73. Asia Pacific: Natural Fiber Composites Market Revenue Share, by End User (2021 and 2028)
Figure 74. Asia Pacific: Natural Fiber Composites Market Revenue Share, by Key Country (2021 and 2028)
Figure 75. Australia: Natural Fiber Composites Market – Volume and Forecast to 2028 (Kilo Tons)
Figure 76. Australia: Natural Fiber Composites Market –Revenue and Forecast to 2028 (US$ Million)
Figure 77. China: Natural Fiber Composites Market – Volume and Forecast to 2028 (Kilo Tons)
Figure 78. China: Natural Fiber Composites Market –Revenue and Forecast to 2028 (US$ Million)
Figure 79. India: Natural Fiber Composites Market – Volume and Forecast to 2028 (Kilo Tons)
Figure 80. India: Natural Fiber Composites Market –Revenue and Forecast to 2028 (US$ Million)
Figure 81. Japan: Natural Fiber Composites Market – Volume and Forecast to 2028 (Kilo Tons)
Figure 82. Japan: Natural Fiber Composites Market –Revenue and Forecast to 2028 (US$ Million)
Figure 83. South Korea: Natural Fiber Composites Market – Volume and Forecast to 2028 (Kilo Tons)
Figure 84. South Korea: Natural Fiber Composites Market –Revenue and Forecast to 2028 (US$ Million)
Figure 85. Rest of Asia Pacific: Natural Fiber Composites Market – Volume and Forecast to 2028 (Kilo Tons)
Figure 86. Rest of Asia Pacific: Natural Fiber Composites Market –Revenue and Forecast to 2028 (US$ Million)
Figure 87. Middle East and Africa: Natural Fiber Composites Market –Volume and Forecast to 2028 (Kilo Tons)
Figure 88. Middle East and Africa: Natural Fiber Composites Market – Revenue and Forecast to 2028 (US$ Million)
Figure 89. Middle East and Africa: Natural Fiber Composites Market Revenue Share, by Raw Material (2021 and 2028)
Figure 90. Middle East and Africa: Natural Fiber Composites Market Revenue Share, by Technology (2021 and 2028)
Figure 91. Middle East and Africa: Natural Fiber Composites Market Revenue Share, by End User (2021 and 2028)
Figure 92. Middle East and Africa: Natural Fiber Composites Market Revenue Share, by Key Country (2021 and 2028)
Figure 93. South Africa: Natural Fiber Composites Market –Volume and Forecast to 2028 (Kilo Tons)
Figure 94. South Africa: Natural Fiber Composites Market –Revenue and Forecast to 2028 (US$ Million)
Figure 95. Saudi Arabia: Natural Fiber Composites Market –Volume and Forecast to 2028 (Kilo Tons)
Figure 96. Saudi Arabia: Natural Fiber Composites Market –Revenue and Forecast to 2028 (US$ Million)
Figure 97. UAE: Natural Fiber Composites Market –Volume and Forecast to 2028 (Kilo Tons)
Figure 98. UAE: Natural Fiber Composites Market –Revenue and Forecast to 2028 (US$ Million)
Figure 99. Rest of MEA: Natural Fiber Composites Market –Volume and Forecast to 2028 (Kilo Tons)
Figure 100. Rest of MEA: Natural Fiber Composites Market –Revenue and Forecast to 2028 (US$ Million)
Figure 101. South & Central America: Natural Fiber Composites Market –Volume and Forecast to 2028 (Kilo Tons)
Figure 102. South & Central America: Natural Fiber Composites Market – Revenue and Forecast to 2028 (US$ Million)
Figure 103. South & Central America: Natural Fiber Composites Market Revenue Share, by Raw Material (2021 and 2028)
Figure 104. South & Central America: Natural Fiber Composites Market Revenue Share, by Technology (2021 and 2028)
Figure 105. South & Central America: Natural Fiber Composites Market Revenue Share, by End User (2021 and 2028)
Figure 106. South & Central America: Natural Fiber Composites Market Revenue Share, by Key Country (2021 and 2028)
Figure 107. Brazil: Natural Fiber Composites Market –Volume and Forecast to 2028 (Kilo Tons)
Figure 108. Brazil: Natural Fiber Composites Market –Revenue and Forecast to 2028 (US$ Million)
Figure 109. Argentina: Natural Fiber Composites Market –Volume and Forecast to 2028 (Kilo Tons)
Figure 110. Argentina: Natural Fiber Composites Market –Revenue and Forecast to 2028 (US$ Million)
Figure 111. Rest of South & Central America: Natural Fiber Composites Market –Volume and Forecast to 2028 (Kilo Tons)
Figure 112. Rest of South & Central America: Natural Fiber Composites Market –Revenue and Forecast to 2028 (US$ Million)
Figure 113. Impact of COVID-19 Pandemic on Market in North America
Figure 114. Impact of COVID-19 Pandemic on Market in Europe
Figure 115. Impact of COVID-19 Pandemic on Market in Asia Pacific
Figure 116. Impact of COVID-19 Pandemic on Market in Middle East & Africa
Figure 117. Impact of COVID-19 Pandemic in South and Central America
The List of Companies - Global Natural Fiber Composites Market
- UPM-Kymmene Corp
- Flexform Technologies LLC
- Polyvlies Franz Beyer GmbH
- Amorim Cork Composites SA
- Tecnaro GmbH
- Lanxess AG
- Bcomp Ltd
- Cobra Advanced Composites Co Ltd
- Plasthill Oy Ltd
- Lingrove Inc
The Insight Partners performs research in 4 major stages: Data Collection & Secondary Research, Primary Research, Data Analysis and Data Triangulation & Final Review.
- Data Collection and Secondary Research:
As a market research and consulting firm operating from a decade, we have published many reports and advised several clients across the globe. First step for any study will start with an assessment of currently available data and insights from existing reports. Further, historical and current market information is collected from Investor Presentations, Annual Reports, SEC Filings, etc., and other information related to company’s performance and market positioning are gathered from Paid Databases (Factiva, Hoovers, and Reuters) and various other publications available in public domain.
Several associations trade associates, technical forums, institutes, societies and organizations are accessed to gain technical as well as market related insights through their publications such as research papers, blogs and press releases related to the studies are referred to get cues about the market. Further, white papers, journals, magazines, and other news articles published in the last 3 years are scrutinized and analyzed to understand the current market trends.
- Primary Research:
The primarily interview analysis comprise of data obtained from industry participants interview and answers to survey questions gathered by in-house primary team.
For primary research, interviews are conducted with industry experts/CEOs/Marketing Managers/Sales Managers/VPs/Subject Matter Experts from both demand and supply side to get a 360-degree view of the market. The primary team conducts several interviews based on the complexity of the markets to understand the various market trends and dynamics which makes research more credible and precise.
A typical research interview fulfils the following functions:
- Provides first-hand information on the market size, market trends, growth trends, competitive landscape, and outlook
- Validates and strengthens in-house secondary research findings
- Develops the analysis team’s expertise and market understanding
Primary research involves email interactions and telephone interviews for each market, category, segment, and sub-segment across geographies. The participants who typically take part in such a process include, but are not limited to:
- Industry participants: VPs, business development managers, market intelligence managers and national sales managers
- Outside experts: Valuation experts, research analysts and key opinion leaders specializing in the electronics and semiconductor industry.
Below is the breakup of our primary respondents by company, designation, and region:

Once we receive the confirmation from primary research sources or primary respondents, we finalize the base year market estimation and forecast the data as per the macroeconomic and microeconomic factors assessed during data collection.
- Data Analysis:
Once data is validated through both secondary as well as primary respondents, we finalize the market estimations by hypothesis formulation and factor analysis at regional and country level.
- 3.1 Macro-Economic Factor Analysis:
We analyse macroeconomic indicators such the gross domestic product (GDP), increase in the demand for goods and services across industries, technological advancement, regional economic growth, governmental policies, the influence of COVID-19, PEST analysis, and other aspects. This analysis aids in setting benchmarks for various nations/regions and approximating market splits. Additionally, the general trend of the aforementioned components aid in determining the market's development possibilities.
- 3.2 Country Level Data:
Various factors that are especially aligned to the country are taken into account to determine the market size for a certain area and country, including the presence of vendors, such as headquarters and offices, the country's GDP, demand patterns, and industry growth. To comprehend the market dynamics for the nation, a number of growth variables, inhibitors, application areas, and current market trends are researched. The aforementioned elements aid in determining the country's overall market's growth potential.
- 3.3 Company Profile:
The “Table of Contents” is formulated by listing and analyzing more than 25 - 30 companies operating in the market ecosystem across geographies. However, we profile only 10 companies as a standard practice in our syndicate reports. These 10 companies comprise leading, emerging, and regional players. Nonetheless, our analysis is not restricted to the 10 listed companies, we also analyze other companies present in the market to develop a holistic view and understand the prevailing trends. The “Company Profiles” section in the report covers key facts, business description, products & services, financial information, SWOT analysis, and key developments. The financial information presented is extracted from the annual reports and official documents of the publicly listed companies. Upon collecting the information for the sections of respective companies, we verify them via various primary sources and then compile the data in respective company profiles. The company level information helps us in deriving the base number as well as in forecasting the market size.
- 3.4 Developing Base Number:
Aggregation of sales statistics (2020-2022) and macro-economic factor, and other secondary and primary research insights are utilized to arrive at base number and related market shares for 2022. The data gaps are identified in this step and relevant market data is analyzed, collected from paid primary interviews or databases. On finalizing the base year market size, forecasts are developed on the basis of macro-economic, industry and market growth factors and company level analysis.
- Data Triangulation and Final Review:
The market findings and base year market size calculations are validated from supply as well as demand side. Demand side validations are based on macro-economic factor analysis and benchmarks for respective regions and countries. In case of supply side validations, revenues of major companies are estimated (in case not available) based on industry benchmark, approximate number of employees, product portfolio, and primary interviews revenues are gathered. Further revenue from target product/service segment is assessed to avoid overshooting of market statistics. In case of heavy deviations between supply and demand side values, all thes steps are repeated to achieve synchronization.
We follow an iterative model, wherein we share our research findings with Subject Matter Experts (SME’s) and Key Opinion Leaders (KOLs) until consensus view of the market is not formulated – this model negates any drastic deviation in the opinions of experts. Only validated and universally acceptable research findings are quoted in our reports.
We have important check points that we use to validate our research findings – which we call – data triangulation, where we validate the information, we generate from secondary sources with primary interviews and then we re-validate with our internal data bases and Subject matter experts. This comprehensive model enables us to deliver high quality, reliable data in shortest possible time.
Trends and growth analysis reports related to Natural Fiber Composites Market

Mar 2023
Re-Refined Paraffinic Base Oil Market
Size and Forecast (2021 - 2031), Global and Regional Share, Trend, and Growth Opportunity Analysis Report Coverage: By Process (Acid Treatment, Clay Treatment, Solvent Extraction, and Hydrotreating), Application (Engine Oil, Hydraulic Oil, Metalworking Fluid, Compressor Oil, Grease, Turbine Oil, and Others), End Use (Automotive, Construction, Mining and Metallurgy, Marine, Energy and Power, Oil and Gas, and Others), and Geography
Mar 2023
Cosmetic Polymer Ingredients Market
Size and Forecast (2021 - 2031), Global and Regional Share, Trend, and Growth Opportunity Analysis Report Coverage: By Type (Polyethylene Glycol, Acrylic Acid-Based, Vinyl Acetate, Silicone, Cellulose, Collagen, Pectin, Xanthan Gum, Chitosan, and Others), Category (Natural, Synthetic, and Semi-Synthetic), Function (Rheology Modifier, Stabilizers, Emulsifiers, Film Formers, Conditioning, and Others), Application (Skincare, Hair Care, Makeup, and Others), and Geography
Mar 2023
Plastic Pipes Market
Size and Forecast (2021 - 2031), Global and Regional Share, Trend, and Growth Opportunity Analysis Report Coverage: By Type [Corrugated (Single-Wall and Multi-Wall) and Smoothwall], Material Type (Polyvinyl Chloride, High-Density Polyethylene, Polypropylene, and Others), Application (Water Supply, Sewage and Drainage, Irrigation, Gas Distribution, and Others), End-Use Industry (Construction and Infrastructure, Water and Wastewater Management, Oil and Gas, and Others), and Geography
Mar 2023
Nonwovens for Energy Applications Market
Size and Forecast (2021 - 2031), Global and Regional Share, Trend, and Growth Opportunity Analysis Report Coverage: By Type (Carbon Fiber, Titanium Fiber, and Others), Application [Battery, Fuel Cell Gas Diffusion Layer (GDL), PTL, and Wind Energy], and Geography
Mar 2023
Antimicrobial Coating Market
Size and Forecast (2021 - 2031), Global and Regional Share, Trend, and Growth Opportunity Analysis Report Coverage: By Material (Silver, Copper, Titanium Dioxide, and Others), Application (Healthcare, HVAC, Mold Remediation, Building and Construction, Food and Beverages, and Others), and Geography
Mar 2023
Hot Melt Adhesives Market
Size and Forecast (2020–2030), Global and Regional Share, Trend, and Growth Opportunity Analysis Report Coverage: By Product Type (Glue Sticks, Glue Slugs, and Others), Type (Ethylene Vinyl Acetate, Polyolefins, Polyamides, Polyurethanes, Styrene Block Copolymers, and Others), Application (Packaging, Construction, Automotive, Furniture, Footwear, Electronics, and Others), and Geography
Mar 2023
Lubricants Market
Size and Forecast (2021 - 2031), Global and Regional Share, Trend, and Growth Opportunity Analysis Report Coverage: By Base Oil (Mineral Oil, Synthetic Oil, and Bio-based Oil), Type (Hydraulic Fluid, Engine Oil, Driveline Lubricants, Metalworking Fluids, Grease, Process Oils, Coolants, and Others), End-Use Industry [Automotive (Passenger Cars, Light Commercial Vehicles, Heavy Commercial Vehicles, and Others), Building and Construction, Power Generation, Mining and Metallurgy, Food Processing, Oil and Gas, Marine, Aviation, and Others], and Geography
Mar 2023
Cosmetic Preservatives Market
Size and Forecast (2021 - 2031), Global and Regional Share, Trend, and Growth Opportunity Analysis Report Coverage: By Source (Natural and Synthetic), Product Type (Parabens, Formaldehyde Releasers, Organic Acids, Quaternary Compounds, Phenol Derivatives, Alcohols, and Others), Application (Hair Care, Skin Care, Makeup Products, Toiletries, Perfumes and Deodorants, and Others), and Geography
 Get Free Sample For