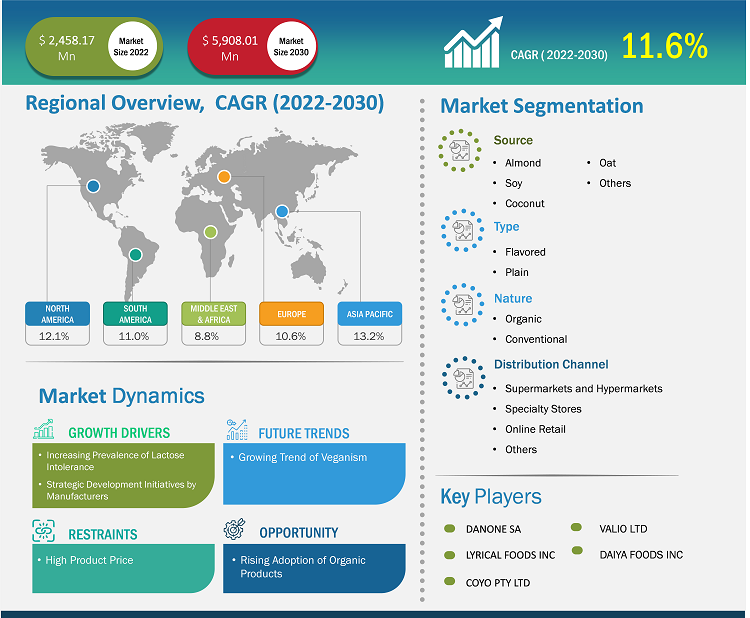
[Research Report] The non-dairy yogurt market size was valued at US$ 2,458.17 million in 2022 and is expected to reach US$ 5,908.01 million by 2030; the market is expected to record a CAGR of 11.6% from 2022 to 2030.
Market Insights and Analyst View:
Non-dairy yogurt is a type of yogurt that is made without any dairy ingredients, such as milk or yogurt cultures derived from dairy. Instead, it is typically produced from plant-based sources like almond, coconut, soy, or cashew milk, and it often contains live bacterial cultures that provide a fermentation process similar to traditional dairy yogurt. This allows people who are lactose intolerant, vegan, or following a dairy-free diet to enjoy a yogurt-like product with similar taste and texture. Increasing prevalence of lactose intolerance and rising veganism trend driving the non-dairy yogurt market growth across the globe.
Growth Drivers and Challenges:
Non-dairy yogurts are made from almond milk, soymilk, and coconut milk, which are free from lactose. Moreover, plant-based non-dairy yogurt has a similar texture, creaminess, and consistency to conventional yogurt. Moreover, plant-based non-dairy yogurts are fortified with protein, calcium, and other nutrients that meet the nutrient requirements of consumers on a daily basis. Thus, the growing prevalence of lactose intolerance and milk allergies among consumers is boosting the non-dairy yogurt market growth. Furthermore, the United Nations, PETA, Good Food Institute, and many other organizations believe that veganism can play a major role in saving the planet from the climate crisis. Awareness regarding the adverse effects of the livestock industry on the environment is rising among consumers. The growing consumption of plant-based dairy products helps minimize carbon footprints, save water and various other natural resources, and reduce the overall impact on the environment. Thus, rising veganism is driving the market growth. However, the cost of non-dairy yogurt is more than that of conventional yogurt due to the high raw material cost and high production and marketing expenses. This factor can hamper the non-dairy yogurt market growth.
Customize Research To Suit Your Requirement
We can optimize and tailor the analysis and scope which is unmet through our standard offerings. This flexibility will help you gain the exact information needed for your business planning and decision making.
Non-Dairy Yogurt Market: Strategic Insights
Market Size Value in US$ 2,458.17 million in 2022 Market Size Value by US$ 5,908.01 million by 2030 Growth rate CAGR of 11.6% from 2022 to 2030 Forecast Period 2022-2030 Base Year 2022

Shejal
Have a question?
Shejal will walk you through a 15-minute call to present the report’s content and answer all queries if you have any.
 Speak to Analyst
Customize Research To Suit Your Requirement
We can optimize and tailor the analysis and scope which is unmet through our standard offerings. This flexibility will help you gain the exact information needed for your business planning and decision making.
Non-Dairy Yogurt Market: Strategic Insights
| Market Size Value in | US$ 2,458.17 million in 2022 |
| Market Size Value by | US$ 5,908.01 million by 2030 |
| Growth rate | CAGR of 11.6% from 2022 to 2030 |
| Forecast Period | 2022-2030 |
| Base Year | 2022 |
Shejal
Have a question?
Shejal will walk you through a 15-minute call to present the report’s content and answer all queries if you have any.
Speak to Analyst
Report Segmentation and Scope:
The global non-dairy yogurt market is categorized on the basis of source, type, nature, distribution channel, and geography. Based on source, the non-dairy yogurt market is segmented into soy, almond, coconut, oat, and others. Based on type, the market is bifurcated into flavored and plain. In terms of nature, the market is divided into organic and conventional. Based on distribution channel, the non-dairy yogurt market is categorized into supermarkets & hypermarkets, convenience stores, online retail, and others. The market, based on geography, is categorized into North America (Canada, US, and Mexico), Europe (Germany, France, Italy, UK, Russia, and Rest of Europe), Asia Pacific (Australia, China, Japan, India, South Korea, and Rest of Asia Pacific), South & Central America (Brazil, Argentina, and Rest of South & Central America), and Middle East & Africa (Saudi Arabia, South Africa, UAE, and Rest of Middle East & Africa).
Segmental Analysis:
Based on source, the non-dairy yogurt market is segmented into soy, almond, coconut, oat, and others. The coconut segment holds a significant share of the market. Consumption of coconut-based products among consumers is increasing with a growing preference for healthier dairy alternatives. Coconut-based dairy alternatives are natural and organic and provide several health benefits to consumers. For instance, coconut milk helps promote good cardiovascular health, and its organic nature has anti-inflammatory, anti-microbial, and anti-fungal properties. Thus, all these factors are expected to fuel the market for the coconut segment during the forecast period.
Regional Analysis:
Based on geography, the non-dairy yogurt market is categorized into five key regions—North America, Europe, Asia Pacific, South & Central America, and Middle East & Africa. The global non-dairy yogurt market was dominated by Europe in 2022; and the market was valued at US$ 922.60 million. North America is the second major contributor to the market, which holds ~20% of the global market. Asia Pacific is expected to record a CAGR of 13.2% in the non-dairy yogurt market during the forecast period. The non-dairy yogurt market in Asia Pacific is significantly growing due to the changing lifestyles of consumers and an increase in the consumption of clean-label, organic, and gluten-free products. The market in the region is also undergoing a remarkable transformation due to increased urbanization, diet diversification, and the legalization of foreign direct investment in the food sector. These factors are expected to boost the demand for non-dairy yogurt in Asia Pacific during the forecast period.
Moreover, North America is one of the most significant regions for the non-dairy yogurt market due to the rising number of individuals opting for healthier alternatives to dairy products. Per the data from Cleveland Clinic, in 2019, 36% of Americans were lactose intolerant. This showcases that North Americans prefer to consume plant-based products, accelerating the demand for non-dairy products such as yogurt. With the rising number of health-conscious consumers, growing environmental concerns, and the increasing trend of plant-based diets, plant-based yogurt is becoming more popular in the region.
Industry Developments and Future Opportunities:
Various initiatives taken by key players operating in the non-dairy yogurt market are listed below:
- In March 2022, AYO Foods LLC, the US-based company, launched a new plant-based yogurt range by developing a plain almond milk yogurt in various flavors.
- In February 2021, Hasla Foods launched zero-sugar oat milk yogurt in a 24 oz family size. The product contains only 90 calories per serving and has no added sugar.
- In June 2021, Hasla Foods expanded its retail footprint by making its products available across 160 National Grocers by Vitamin Cottage stores in the US.
- In December 2020, Danone SA launched the Silk Kids Almond Milk Yogurt Alternative plant-based yogurt, specially formulated for kids. The product comprises fava bean protein, almond milk, live & active culture, and organic coconut oil. It is rich in vitamin D and calcium; this satisfies the children’s nutrition.
Non-dairy Yogurt Market Report Scope
COVID-19 Impact:
The COVID-19 pandemic affected almost all industries in various countries. Lockdowns, travel restrictions, and business shutdowns in North America, Europe, Asia Pacific (APAC), South & Central America (SAM), and the Middle East & Africa (MEA) hampered the growth of several industries, including the food & beverages industry. The shutdown of manufacturing units disturbed global supply chains, manufacturing activities, delivery schedules, and essential and nonessential product sales. Various companies witnessed delays in product deliveries and a slump in sales of their products in 2020.
During the COVID-19 pandemic, the dietary preferences of consumers changed significantly, with many consumers switching to plant-based diets. The demand for dairy alternatives increased significantly during the pandemic due to increased health and wellness concerns. Thus, owing to a rise in health consciousness, the demand for non-dairy yogurt has surged during the pandemic. However, as the manufacturing units remained shut, a production shortfall created a gap between the demand and supply sides. Manufacturers with high product inventories cater to the increasing demand; however, small-scale and mid-scale manufacturers lack product inventories that incur financial losses. These factors negatively impacted the non-dairy yogurt market size.
In 2021, various economies resumed operations as several governments announced relaxation in the previously imposed restrictions, which positively impacted the global marketplace. Moreover, manufacturers were permitted to operate at full capacity, which helped them overcome the demand and supply gap.
Competitive Landscape and Key Companies:
A few of the major players operating in the global non-dairy yogurt market include The Hain Celestial Group Inc, Danone Sa, Springfield Creamery Inc, Lyrical Foods Inc, Coyo Pty Ltd, Valio Ltd, Oatly Group Ab, Daiya Foods Inc, Forager Project LLC, and Harmless Harvest Inc. These market players are adopting strategic development initiatives to expand, further driving the market growth.

Report Coverage
Revenue forecast, Company Analysis, Industry landscape, Growth factors, and Trends

Segment Covered
Source, Type, Nature, Distribution Channel, and Geography

Regional Scope
North America, Europe, Asia Pacific, Middle East & Africa, South & Central America

Country Scope
This text is related
to country scope.
Frequently Asked Questions
The major players operating in the global non-dairy yogurt market are The Hain Celestial Group Inc, Danone Sa, Springfield Creamery Inc, Lyrical Foods Inc, Coyo Pty Ltd, Valio Ltd, Oatly Group Ab, Daiya Foods Inc, Forager Project LLC, and Harmless Harvest Inc. among few others.
Consumers prefer products made with natural and ethically sourced ingredients due to a focus on holistic and conscious food consumption. Thus, increasing demand for organically sourced products would create lucrative opportunities for the non-dairy yogurt market during the forecast period.
Based on the source, the coconut segment accounted for the largest revenue share as consumption of coconut-based products among consumers is increasing with a growing preference for healthier dairy alternatives.
Increasing prevalence of lactose intolerance and strategic development initiatives by manufacturers are some of the key driving factors for the non-dairy yogurt market.
Based on category, online is the fastest-growing segment in the non-dairy yogurt market. Online portals such as Amazon, offer various benefits such as home delivery, various secure payment options, attractive discounts, and convenience for customers.
Europe accounted for the largest share of the global non-dairy yogurt market as the popularity of plant-based dairy products is increasing in Europe due to the shift in consumer demand from animal protein to plant protein.
1. Introduction
1.1 The Insight Partners Research Report Guidance
1.2 Market Segmentation
2. Executive Summary
2.1 Key Insights
2.2 Market Attractiveness
3. Research Methodology
3.1 Coverage
3.2 Secondary Research
3.3 Primary Research
4. Non-Dairy Yogurt Market Landscape
4.1 Overview
4.2 Porter’s Five Forces Analysis
4.2.1 Bargaining Power of Suppliers
4.2.2 Bargaining Power of Buyers
4.2.3 Threat of New Entrants
4.2.4 Competitive Rivalry
4.2.5 Threat of Substitutes
4.3 Ecosystem Analysis
4.3.1 Raw Material Suppliers
4.3.2 Manufacturing Process
4.3.3 Packaging
4.3.4 Distribution Channel
4.3.5 List of Vendors in the Value Chain
4.3.5.1 List of Raw Type Suppliers for Non-Dairy Yogurt
5. Non-Dairy Yogurt Market - Key Industry Dynamics
5.1 Market Drivers
5.1.1 Increasing Prevalence of Lactose Intolerance
5.1.2 Strategic Development Initiatives by Manufacturers
5.2 Market Restraints
5.2.1 Higher Prices of Raw Material
5.3 Market Opportunities
5.3.1 Rising Adoption of Organic Products
5.4 Future Trends
5.4.1 Growing Trend of Veganism Due to Rising Environmental Concern
5.5 Impact Analysis of Drivers and Restraints
6. Non-Dairy Yogurt Market - Global Market Analysis
6.1 Non-Dairy Yogurt Market Revenue (US$ Million), 2022 – 2030
6.2 Non-Dairy Yogurt Market Forecast and Analysis
7. Global Non-Dairy Yogurt Market Analysis – Source
7.1 Almond
7.1.1 Overview
7.1.2 Almond Market Revenue and Forecast to 2030 (US$ Million)
7.2 Soy
7.2.1 Overview
7.2.2 Soy Market Revenue and Forecast to 2030 (US$ Million)
7.3 Coconut
7.3.1 Overview
7.3.2 Coconut Market Revenue and Forecast to 2030 (US$ Million)
7.4 Oat
7.4.1 Overview
7.4.2 Oat Market Revenue and Forecast to 2030 (US$ Million)
7.5 Others
7.5.1 Overview
7.5.2 Others Market Revenue and Forecast to 2030 (US$ Million)
8. Global Non-Dairy Yogurt Market Analysis – Type
8.1 Flavored
8.1.1 Overview
8.1.2 Flavored Market Revenue and Forecast to 2030 (US$ Million)
8.2 Plain
8.2.1 Overview
8.2.2 Plain Market Revenue and Forecast to 2030 (US$ Million)
9. Global Non-Dairy Yogurt Market Analysis – Nature
9.1 Organic
9.1.1 Overview
9.1.2 Organic Market Revenue, and Forecast to 2030 (US$ Million)
9.2 Conventional
9.2.1 Overview
9.2.2 Conventional Market Revenue, and Forecast to 2030 (US$ Million)
10. Global Non-Dairy Yogurt Market Analysis – Distribution Channel
10.1 Supermarkets and Hypermarkets
10.1.1 Overview
10.1.2 Supermarkets and Hypermarkets Market Revenue, and Forecast to 2030 (US$ Million)
10.2 Convenience Stores
10.2.1 Overview
10.2.2 Convenience Stores Market Revenue, and Forecast to 2030 (US$ Million)
10.3 Online Retail
10.3.1 Overview
10.3.2 Online Retail Market Revenue, and Forecast to 2030 (US$ Million)
10.4 Others
10.4.1 Overview
10.4.2 Others Market Revenue, and Forecast to 2030 (US$ Million)
11. Non-Dairy Yogurt Market - Geographical Analysis
11.1 North America
11.1.1 North America Non-Dairy Yogurt Market Overview
11.1.2 North America Non-Dairy Yogurt Market Revenue and Forecasts to 2030 (US$ Mn)
11.1.3 North America Non-Dairy Yogurt Market Breakdown by Source
11.1.3.1 North America Non-Dairy Yogurt Market Revenue and Forecasts and Analysis - By Source
11.1.4 North America Non-Dairy Yogurt Market Breakdown by Type
11.1.4.1 North America Non-Dairy Yogurt Market Revenue and Forecasts and Analysis - By Type
11.1.5 North America Non-Dairy Yogurt Market Breakdown by Nature
11.1.5.1 North America Non-Dairy Yogurt Market Revenue and Forecasts and Analysis - By Nature
11.1.6 North America Non-Dairy Yogurt Market Breakdown by Distribution Channel
11.1.6.1 North America Non-Dairy Yogurt Market Revenue and Forecasts and Analysis - By Distribution Channel
11.1.7 North America Non-Dairy Yogurt Market Revenue and Forecasts and Analysis - By Countries
11.1.7.1 North America Non-Dairy Yogurt Market Breakdown by Country
11.1.7.2 US Non-Dairy Yogurt Market Revenue and Forecasts to 2030 (US$ Mn)
11.1.7.2.1 US Non-Dairy Yogurt Market Breakdown by Source
11.1.7.2.2 US Non-Dairy Yogurt Market Breakdown by Type
11.1.7.2.3 US Non-Dairy Yogurt Market Breakdown by Nature
11.1.7.2.4 US Non-Dairy Yogurt Market Breakdown by Distribution Channel
11.1.7.3 Canada Non-Dairy Yogurt Market Revenue and Forecasts to 2030 (US$ Mn)
11.1.7.3.1 Canada Non-Dairy Yogurt Market Breakdown by Source
11.1.7.3.2 Canada Non-Dairy Yogurt Market Breakdown by Type
11.1.7.3.3 Canada Non-Dairy Yogurt Market Breakdown by Nature
11.1.7.3.4 Canada Non-Dairy Yogurt Market Breakdown by Distribution Channel
11.1.7.4 Mexico Non-Dairy Yogurt Market Revenue and Forecasts to 2030 (US$ Mn)
11.1.7.4.1 Mexico Non-Dairy Yogurt Market Breakdown by Source
11.1.7.4.2 Mexico Non-Dairy Yogurt Market Breakdown by Type
11.1.7.4.3 Mexico Non-Dairy Yogurt Market Breakdown by Nature
11.1.7.4.4 Mexico Non-Dairy Yogurt Market Breakdown by Distribution Channel
11.2 Europe
11.2.1 Europe Non-Dairy Yogurt Market Overview
11.2.2 Europe Non-Dairy Yogurt Market Revenue and Forecasts to 2030 (US$ Mn)
11.2.3 Europe Non-Dairy Yogurt Market Breakdown by Source
11.2.3.1 Europe Non-Dairy Yogurt Market Revenue and Forecasts and Analysis - By Source
11.2.4 Europe Non-Dairy Yogurt Market Breakdown by Type
11.2.4.1 Europe Non-Dairy Yogurt Market Revenue and Forecasts and Analysis - By Type
11.2.5 Europe Non-Dairy Yogurt Market Breakdown by Nature
11.2.5.1 Europe Non-Dairy Yogurt Market Revenue and Forecasts and Analysis - By Nature
11.2.6 Europe Non-Dairy Yogurt Market Breakdown by Distribution Channel
11.2.6.1 Europe Non-Dairy Yogurt Market Revenue and Forecasts and Analysis - By Distribution Channel
11.2.7 Europe Non-Dairy Yogurt Market Revenue and Forecasts and Analysis - By Countries
11.2.7.1 Europe Non-Dairy Yogurt Market Breakdown by Country
11.2.7.2 Germany Non-Dairy Yogurt Market Revenue and Forecasts to 2030 (US$ Mn)
11.2.7.2.1 Germany Non-Dairy Yogurt Market Breakdown by Source
11.2.7.2.2 Germany Non-Dairy Yogurt Market Breakdown by Type
11.2.7.2.3 Germany Non-Dairy Yogurt Market Breakdown by Nature
11.2.7.2.4 Germany Non-Dairy Yogurt Market Breakdown by Distribution Channel
11.2.7.3 France Non-Dairy Yogurt Market Revenue and Forecasts to 2030 (US$ Mn)
11.2.7.3.1 France Non-Dairy Yogurt Market Breakdown by Source
11.2.7.3.2 France Non-Dairy Yogurt Market Breakdown by Type
11.2.7.3.3 France Non-Dairy Yogurt Market Breakdown by Nature
11.2.7.3.4 France Non-Dairy Yogurt Market Breakdown by Distribution Channel
11.2.7.4 Italy Non-Dairy Yogurt Market Revenue and Forecasts to 2030 (US$ Mn)
11.2.7.4.1 Italy Non-Dairy Yogurt Market Breakdown by Source
11.2.7.4.2 Italy Non-Dairy Yogurt Market Breakdown by Type
11.2.7.4.3 Italy Non-Dairy Yogurt Market Breakdown by Nature
11.2.7.4.4 Italy Non-Dairy Yogurt Market Breakdown by Distribution Channel
11.2.7.5 UK Non-Dairy Yogurt Market Revenue and Forecasts to 2030 (US$ Mn)
11.2.7.5.1 UK Non-Dairy Yogurt Market Breakdown by Source
11.2.7.5.2 UK Non-Dairy Yogurt Market Breakdown by Type
11.2.7.5.3 UK Non-Dairy Yogurt Market Breakdown by Nature
11.2.7.5.4 UK Non-Dairy Yogurt Market Breakdown by Distribution Channel
11.2.7.6 Russia Non-Dairy Yogurt Market Revenue and Forecasts to 2030 (US$ Mn)
11.2.7.6.1 Russia Non-Dairy Yogurt Market Breakdown by Source
11.2.7.6.2 Russia Non-Dairy Yogurt Market Breakdown by Type
11.2.7.6.3 Russia Non-Dairy Yogurt Market Breakdown by Nature
11.2.7.6.4 Russia Non-Dairy Yogurt Market Breakdown by Distribution Channel
11.2.7.7 Rest of Europe Non-Dairy Yogurt Market Revenue and Forecasts to 2030 (US$ Mn)
11.2.7.7.1 Rest of Europe Non-Dairy Yogurt Market Breakdown by Source
11.2.7.7.2 Rest of Europe Non-Dairy Yogurt Market Breakdown by Type
11.2.7.7.3 Rest of Europe Non-Dairy Yogurt Market Breakdown by Nature
11.2.7.7.4 Rest of Europe Non-Dairy Yogurt Market Breakdown by Distribution Channel
11.3 Asia Pacific Non-Dairy Yogurt Market
11.3.1 Overview
11.3.2 Asia Pacific Non-Dairy Yogurt Market Revenue and Forecasts To 2030 (US$ Million)
11.3.3 Asia Pacific Non-Dairy Yogurt Market Breakdown by Source
11.3.3.1 Asia Pacific Non-Dairy Yogurt Market Revenue and Forecasts and Analysis - By Source
11.3.4 Asia Pacific Non-Dairy Yogurt Market Breakdown by Type
11.3.4.1 Asia Pacific Non-Dairy Yogurt Market Revenue and Forecasts and Analysis - By Type
11.3.5 Asia Pacific Non-Dairy Yogurt Market Breakdown by Nature
11.3.5.1 Asia Pacific Non-Dairy Yogurt Market Revenue and Forecasts and Analysis - By Nature
11.3.6 Asia Pacific Non-Dairy Yogurt Market Breakdown by Distribution Channel
11.3.6.1 Asia Pacific Non-Dairy Yogurt Market Revenue and Forecasts and Analysis - By Distribution Channel
11.3.7 Asia Pacific Non-Dairy Yogurt Market Breakdown by Country
11.3.7.1 Asia Pacific Non-Dairy Yogurt Market Breakdown by Country
11.3.7.2 Australia Non-Dairy Yogurt Market Revenue and Forecasts To 2030 (US$ Million)
11.3.7.2.1 Australia Non-Dairy Yogurt Market Breakdown by Source
11.3.7.2.2 Australia Non-Dairy Yogurt Market Breakdown by Type
11.3.7.2.3 Australia Non-Dairy Yogurt Market Breakdown by Nature
11.3.7.2.4 Australia Non-Dairy Yogurt Market Breakdown by Distribution Channel
11.3.7.3 China Non-Dairy Yogurt Market Revenue and Forecasts To 2030 (US$ Million)
11.3.7.3.1 China Non-Dairy Yogurt Market Breakdown by Source
11.3.7.3.2 China Non-Dairy Yogurt Market Breakdown by Type
11.3.7.3.3 China Non-Dairy Yogurt Market Breakdown by Nature
11.3.7.3.4 China Non-Dairy Yogurt Market Breakdown by Distribution Channel
11.3.7.4 India Non-Dairy Yogurt Market Revenue and Forecasts To 2030 (US$ Million)
11.3.7.4.1 India Non-Dairy Yogurt Market Breakdown by Source
11.3.7.4.2 India Non-Dairy Yogurt Market Breakdown by Type
11.3.7.4.3 India Non-Dairy Yogurt Market Breakdown by Nature
11.3.7.4.4 India Non-Dairy Yogurt Market Breakdown by Distribution Channel
11.3.7.5 Japan Non-Dairy Yogurt Market Revenue and Forecasts To 2030 (US$ Million)
11.3.7.5.1 Japan Non-Dairy Yogurt Market Breakdown by Source
11.3.7.5.2 Japan Non-Dairy Yogurt Market Breakdown by Type
11.3.7.5.3 Japan Non-Dairy Yogurt Market Breakdown by Nature
11.3.7.5.4 Japan Non-Dairy Yogurt Market Breakdown by Distribution Channel
11.3.7.6 South Korea Non-Dairy Yogurt Market Revenue and Forecasts To 2030 (US$ Million)
11.3.7.6.1 South Korea Non-Dairy Yogurt Market Breakdown by Source
11.3.7.6.2 South Korea Non-Dairy Yogurt Market Breakdown by Type
11.3.7.6.3 South Korea Non-Dairy Yogurt Market Breakdown by Nature
11.3.7.6.4 South Korea Non-Dairy Yogurt Market Breakdown by Distribution Channel
11.3.7.7 Rest of Asia Pacific Non-Dairy Yogurt Market Revenue and Forecasts To 2030 (US$ Million)
11.3.7.7.1 Rest of Asia Pacific Non-Dairy Yogurt Market Breakdown by Source
11.3.7.7.2 Rest of Asia Pacific Non-Dairy Yogurt Market Breakdown by Type
11.3.7.7.3 Rest of Asia Pacific Non-Dairy Yogurt Market Breakdown by Nature
11.3.7.7.4 Rest of Asia Pacific Non-Dairy Yogurt Market Breakdown by Distribution Channel
11.4 Middle East & Africa
11.4.1 Middle East & Africa Non-Dairy Yogurt Market Overview
11.4.2 Middle East & Africa Non-Dairy Yogurt Market Revenue and Forecasts to 2030 (US$ Million)
11.4.3 Middle East & Africa Non-Dairy Yogurt Market Breakdown by Source
11.4.3.1 Middle East & Africa Non-Dairy Yogurt Market and Forecasts and Analysis - By Source
11.4.4 Middle East & Africa Non-Dairy Yogurt Market Breakdown by Type
11.4.4.1 Middle East & Africa Non-Dairy Yogurt Market and Forecasts and Analysis - By Type
11.4.5 Middle East & Africa Non-Dairy Yogurt Market Breakdown by Nature
11.4.5.1 Middle East & Africa Non-Dairy Yogurt Market and Forecasts and Analysis - By Nature
11.4.6 Middle East & Africa Non-Dairy Yogurt Market Breakdown by Distribution Channel
11.4.6.1 Middle East & Africa Non-Dairy Yogurt Market and Forecasts and Analysis - By Distribution Channel
11.4.7 Middle East & Africa Non-Dairy Yogurt Market Revenue and Forecasts and Analysis - By Countries
11.4.7.1 Middle East & Africa Non-Dairy Yogurt Market Breakdown by Country
11.4.7.2 South Africa Non-Dairy Yogurt Market Revenue and Forecasts to 2030 (US$ Million)
11.4.7.2.1 South Africa Non-Dairy Yogurt Market Breakdown by Source
11.4.7.2.2 South Africa Non-Dairy Yogurt Market Breakdown by Type
11.4.7.2.3 South Africa Non-Dairy Yogurt Market Breakdown by Nature
11.4.7.2.4 South Africa Non-Dairy Yogurt Market Breakdown by Distribution Channel
11.4.7.3 Saudi Arabia Non-Dairy Yogurt Market Revenue and Forecasts to 2030 (US$ Million)
11.4.7.3.1 Saudi Arabia Non-Dairy Yogurt Market Breakdown by Source
11.4.7.3.2 Saudi Arabia Non-Dairy Yogurt Market Breakdown by Type
11.4.7.3.3 Saudi Arabia Non-Dairy Yogurt Market Breakdown by Nature
11.4.7.3.4 Saudi Arabia Non-Dairy Yogurt Market Breakdown by Distribution Channel
11.4.7.4 UAE Non-Dairy Yogurt Market Revenue and Forecasts to 2030 (US$ Million)
11.4.7.4.1 UAE Non-Dairy Yogurt Market Breakdown by Source
11.4.7.4.2 UAE Non-Dairy Yogurt Market Breakdown by Type
11.4.7.4.3 UAE Non-Dairy Yogurt Market Breakdown by Nature
11.4.7.4.4 UAE Non-Dairy Yogurt Market Breakdown by Distribution Channel
11.4.7.5 Rest of Middle East & Africa Non-Dairy Yogurt Market Revenue and Forecasts to 2030 (US$ Million)
11.4.7.5.1 Rest of Middle East & Africa Non-Dairy Yogurt Market Breakdown by Source
11.4.7.5.2 Rest of Middle East & Africa Non-Dairy Yogurt Market Breakdown by Type
11.4.7.5.3 Rest of Middle East & Africa Non-Dairy Yogurt Market Breakdown by Nature
11.4.7.5.4 Rest of Middle East & Africa Non-Dairy Yogurt Market Breakdown by Distribution Channel
11.5 South & Central America
11.5.1 South & Central America Non-Dairy Yogurt Market Overview
11.5.2 South & Central America Non-Dairy Yogurt Market Revenue and Forecasts to 2030 (US$ Million)
11.5.3 South & Central America Non-Dairy Yogurt Market Breakdown by Source
11.5.3.1 South & Central America Non-Dairy Yogurt Market and Forecasts and Analysis - By Source
11.5.4 South & Central America Non-Dairy Yogurt Market Breakdown by Type
11.5.4.1 South & Central America Non-Dairy Yogurt Market and Forecasts and Analysis - By Type
11.5.5 South & Central America Non-Dairy Yogurt Market Breakdown by Nature
11.5.5.1 South & Central America Non-Dairy Yogurt Market Revenue and Forecasts and Analysis - By Nature
11.5.6 South & Central America Non-Dairy Yogurt Market Breakdown by Distribution Channel
11.5.6.1 South & Central America Non-Dairy Yogurt Market Revenue and Forecasts and Analysis - By Distribution Channel
11.5.7 South & Central America Non-Dairy Yogurt Market Revenue and Forecasts and Analysis - By Countries
11.5.7.1 South & Central America Non-Dairy Yogurt Market Breakdown by Country
11.5.7.2 Brazil Non-Dairy Yogurt Market Revenue and Forecasts to 2030 (US$ Million)
11.5.7.2.1 Brazil Non-Dairy Yogurt Market Breakdown by Source
11.5.7.2.2 Brazil Non-Dairy Yogurt Market Breakdown by Type
11.5.7.2.3 Brazil Non-Dairy Yogurt Market Breakdown by Nature
11.5.7.2.4 Brazil Non-Dairy Yogurt Market Breakdown by Distribution Channel
11.5.7.3 Argentina Non-Dairy Yogurt Market Revenue and Forecasts to 2030 (US$ Million)
11.5.7.3.1 Argentina Non-Dairy Yogurt Market Breakdown by Source
11.5.7.3.2 Argentina Non-Dairy Yogurt Market Breakdown by Type
11.5.7.3.3 Argentina Non-Dairy Yogurt Market Breakdown by Nature
11.5.7.3.4 Argentina Non-Dairy Yogurt Market Breakdown by Distribution Channel
11.5.7.4 Rest of South & Central America Non-Dairy Yogurt Market Revenue and Forecasts to 2030 (US$ Million)
11.5.7.4.1 Rest of South & Central America Non-Dairy Yogurt Market Breakdown by Source
11.5.7.4.2 Rest of South & Central America Non-Dairy Yogurt Market Breakdown by Type
11.5.7.4.3 Rest of South & Central America Non-Dairy Yogurt Market Breakdown by Nature
11.5.7.4.4 Rest of South & Central America Non-Dairy Yogurt Market Breakdown by Distribution Channel
12. Non-Dairy Yogurt Market – Impact of COVID-19 Pandemic
10.1 Pre & Post COVID-19 Impact on Non-Dairy Yogurt Market
13. Industry Landscape
13.1 Overview
13.2 New Product Development
13.3 Partnerships
14. Competitive Landscape
14.1 Heat Map Analysis- By Key Players
14.2 Company Positioning & Concentration
15. Company Profiles
15.1 The Hain Celestial Group Inc
15.1.1 Key Facts
15.1.2 Business Description
15.1.3 Products and Services
15.1.4 Financial Overview
15.1.5 SWOT Analysis
15.1.6 Key Developments
15.2 Danone SA
15.2.1 Key Facts
15.2.2 Business Description
15.2.3 Products and Services
15.2.4 Financial Overview
15.2.5 SWOT Analysis
15.2.6 Key Developments
15.3 Springfield Creamery Inc
15.3.1 Key Facts
15.3.2 Business Description
15.3.3 Products and Services
15.3.4 Financial Overview
15.3.5 SWOT Analysis
15.3.6 Key Developments
15.4 Lyrical Foods Inc
15.4.1 Key Facts
15.4.2 Business Description
15.4.3 Products and Services
15.4.4 Financial Overview
15.4.5 SWOT Analysis
15.4.6 Key Developments
15.5 COYO Pty Ltd
15.5.1 Key Facts
15.5.2 Business Description
15.5.3 Products and Services
15.5.4 Financial Overview
15.5.5 SWOT Analysis
15.5.6 Key Developments
15.6 Valio Ltd
15.6.1 Key Facts
15.6.2 Business Description
15.6.3 Products and Services
15.6.4 Financial Overview
15.6.5 SWOT Analysis
15.6.6 Key Developments
15.7 Oatly Group AB
15.7.1 Key Facts
15.7.2 Business Description
15.7.3 Products and Services
15.7.4 Financial Overview
15.7.5 SWOT Analysis
15.7.6 Key Developments
15.8 Daiya Foods Inc
15.8.1 Key Facts
15.8.2 Business Description
15.8.3 Products and Services
15.8.4 Financial Overview
15.8.5 SWOT Analysis
15.8.6 Key Developments
15.9 Forager Project LLC
15.9.1 Key Facts
15.9.2 Business Description
15.9.3 Products and Services
15.9.4 Financial Overview
15.9.5 SWOT Analysis
15.9.6 Key Developments
15.10 Harmless Harvest Inc
15.10.1 Key Facts
15.10.2 Business Description
15.10.3 Products and Services
15.10.4 Financial Overview
15.10.5 SWOT Analysis
15.10.6 Key Developments
16. Appendix
List of Tables
Table 1. Non-Dairy Yogurt Market Segmentation
Table 2. Nutrients in 8 oz of Whole Milk and Soymilk
Table 3. Non-Dairy Yogurt Market Revenue and Forecasts To 2030 (US$ Million)
Table 4. Global Non-Dairy Yogurt Market Revenue and Forecasts To 2030 (US$ Million) – Source
Table 5. Global Non-Dairy Yogurt Market Revenue and Forecasts To 2030 (US$ Million) – Type
Table 6. Global Non-Dairy Yogurt Market Revenue and Forecasts To 2030 (US$ Million) – Nature
Table 7. Global Non-Dairy Yogurt Market Revenue and Forecasts To 2030 (US$ Million) – Distribution Channel
Table 8. North America Non-Dairy Yogurt Market Revenue and Forecasts To 2030 (US$ Mn) – By Source
Table 9. North America Non-Dairy Yogurt Market Revenue and Forecasts To 2030 (US$ Mn) – By Type
Table 10. North America Non-Dairy Yogurt Market Revenue and Forecasts To 2030 (US$ Mn) – By Nature
Table 11. North America Non-Dairy Yogurt Market Revenue and Forecasts To 2030 (US$ Mn) – By Distribution Channel
Table 12. US Non-Dairy Yogurt Market Revenue and Forecasts To 2030 (US$ Mn) – By Source
Table 13. US Non-Dairy Yogurt Market Revenue and Forecasts To 2030 (US$ Mn) – By Type
Table 14. US Non-Dairy Yogurt Market Revenue and Forecasts To 2030 (US$ Mn) – By Nature
Table 15. US Non-Dairy Yogurt Market Revenue and Forecasts To 2030 (US$ Mn) – By Distribution Channel
Table 16. Canada Non-Dairy Yogurt Market Revenue and Forecasts To 2030 (US$ Mn) – By Source
Table 17. Canada Non-Dairy Yogurt Market Revenue and Forecasts To 2030 (US$ Mn) – By Type
Table 18. Canada Non-Dairy Yogurt Market Revenue and Forecasts To 2030 (US$ Mn) – By Nature
Table 19. Canada Non-Dairy Yogurt Market Revenue and Forecasts To 2030 (US$ Mn) – By Distribution Channel
Table 20. Mexico Non-Dairy Yogurt Market Revenue and Forecasts To 2030 (US$ Mn) – By Source
Table 21. Mexico Non-Dairy Yogurt Market Revenue and Forecasts To 2030 (US$ Mn) – By Type
Table 22. Mexico Non-Dairy Yogurt Market Revenue and Forecasts To 2030 (US$ Mn) – By Nature
Table 23. Mexico Non-Dairy Yogurt Market Revenue and Forecasts To 2030 (US$ Mn) – By Distribution Channel
Table 24. Europe Non-Dairy Yogurt Market Revenue and Forecasts To 2030 (US$ Mn) – By Source
Table 25. Europe Non-Dairy Yogurt Market Revenue and Forecasts To 2030 (US$ Mn) – By Type
Table 26. Europe Non-Dairy Yogurt Market Revenue and Forecasts To 2030 (US$ Mn) – By Nature
Table 27. Europe Non-Dairy Yogurt Market Revenue and Forecasts To 2030 (US$ Mn) – By Distribution Channel
Table 28. Germany Non-Dairy Yogurt Market Revenue and Forecasts To 2030 (US$ Mn) – By Source
Table 29. Germany Non-Dairy Yogurt Market Revenue and Forecasts To 2030 (US$ Mn) – By Type
Table 30. Germany Non-Dairy Yogurt Market Revenue and Forecasts To 2030 (US$ Mn) – By Nature
Table 31. Germany Non-Dairy Yogurt Market Revenue and Forecasts To 2030 (US$ Mn) – By Distribution Channel
Table 32. France Non-Dairy Yogurt Market Revenue and Forecasts To 2030 (US$ Mn) – By Source
Table 33. France Non-Dairy Yogurt Market Revenue and Forecasts To 2030 (US$ Mn) – By Type
Table 34. France Non-Dairy Yogurt Market Revenue and Forecasts To 2030 (US$ Mn) – By Nature
Table 35. France Non-Dairy Yogurt Market Revenue and Forecasts To 2030 (US$ Mn) – By Distribution Channel
Table 36. Italy Non-Dairy Yogurt Market Revenue and Forecasts To 2030 (US$ Mn) – By Source
Table 37. Italy Non-Dairy Yogurt Market Revenue and Forecasts To 2030 (US$ Mn) – By Type
Table 38. Italy Non-Dairy Yogurt Market Revenue and Forecasts To 2030 (US$ Mn) – By Nature
Table 39. Italy Non-Dairy Yogurt Market Revenue and Forecasts To 2030 (US$ Mn) – By Distribution Channel
Table 40. UK Non-Dairy Yogurt Market Revenue and Forecasts To 2030 (US$ Mn) – By Source
Table 41. UK Non-Dairy Yogurt Market Revenue and Forecasts To 2030 (US$ Mn) – By Type
Table 42. UK Non-Dairy Yogurt Market Revenue and Forecasts To 2030 (US$ Mn) – By Nature
Table 43. UK Non-Dairy Yogurt Market Revenue and Forecasts To 2030 (US$ Mn) – By Distribution Channel
Table 44. Russia Non-Dairy Yogurt Market Revenue and Forecasts To 2030 (US$ Mn) – By Source
Table 45. Russia Non-Dairy Yogurt Market Revenue and Forecasts To 2030 (US$ Mn) – By Type
Table 46. Russia Non-Dairy Yogurt Market Revenue and Forecasts To 2030 (US$ Mn) – By Nature
Table 47. Russia Non-Dairy Yogurt Market Revenue and Forecasts To 2030 (US$ Mn) – By Distribution Channel
Table 48. Rest of Europe Non-Dairy Yogurt Market Revenue and Forecasts To 2030 (US$ Mn) – By Source
Table 49. Rest of Europe Non-Dairy Yogurt Market Revenue and Forecasts To 2030 (US$ Mn) – By Type
Table 50. Rest of Europe Non-Dairy Yogurt Market Revenue and Forecasts To 2030 (US$ Mn) – By Nature
Table 51. Rest of Europe Non-Dairy Yogurt Market Revenue and Forecasts To 2030 (US$ Mn) – By Distribution Channel
Table 52. Asia Pacific Non-Dairy Yogurt Market Revenue and Forecasts To 2030 (US$ Million) – Source
Table 53. Asia Pacific Non-Dairy Yogurt Market Revenue and Forecasts To 2030 (US$ Million) – Type
Table 54. Asia Pacific Non-Dairy Yogurt Market Revenue and Forecasts To 2030 (US$ Million) – Nature
Table 55. Asia Pacific Non-Dairy Yogurt Market Revenue and Forecasts To 2030 (US$ Million) – Distribution Channel
Table 56. Australia Non-Dairy Yogurt Market Revenue and Forecasts To 2030 (US$ Million) – Source
Table 57. Australia Non-Dairy Yogurt Market Revenue and Forecasts To 2030 (US$ Million) – Type
Table 58. Australia Non-Dairy Yogurt Market Revenue and Forecasts To 2030 (US$ Million) – Nature
Table 59. Australia Non-Dairy Yogurt Market Revenue and Forecasts To 2030 (US$ Million) – Distribution Channel
Table 60. China Non-Dairy Yogurt Market Revenue and Forecasts To 2030 (US$ Million) – Source
Table 61. China Non-Dairy Yogurt Market Revenue and Forecasts To 2030 (US$ Million) – Type
Table 62. China Non-Dairy Yogurt Market Revenue and Forecasts To 2030 (US$ Million) – Nature
Table 63. China Non-Dairy Yogurt Market Revenue and Forecasts To 2030 (US$ Million) – Distribution Channel
Table 64. India Non-Dairy Yogurt Market Revenue and Forecasts To 2030 (US$ Million) – Source
Table 65. India Non-Dairy Yogurt Market Revenue and Forecasts To 2030 (US$ Million) – Type
Table 66. India Non-Dairy Yogurt Market Revenue and Forecasts To 2030 (US$ Million) – Nature
Table 67. India Non-Dairy Yogurt Market Revenue and Forecasts To 2030 (US$ Million) – Distribution Channel
Table 68. Japan Non-Dairy Yogurt Market Revenue and Forecasts To 2030 (US$ Million) – Source
Table 69. Japan Non-Dairy Yogurt Market Revenue and Forecasts To 2030 (US$ Million) – Type
Table 70. Japan Non-Dairy Yogurt Market Revenue and Forecasts To 2030 (US$ Million) – Nature
Table 71. Japan Non-Dairy Yogurt Market Revenue and Forecasts To 2030 (US$ Million) – Distribution Channel
Table 72. South Korea Non-Dairy Yogurt Market Revenue and Forecasts To 2030 (US$ Million) – Source
Table 73. South Korea Non-Dairy Yogurt Market Revenue and Forecasts To 2030 (US$ Million) – Type
Table 74. South Korea Non-Dairy Yogurt Market Revenue and Forecasts To 2030 (US$ Million) – Nature
Table 75. South Korea Non-Dairy Yogurt Market Revenue and Forecasts To 2030 (US$ Million) – Distribution Channel
Table 76. Rest of Asia Pacific Non-Dairy Yogurt Market Revenue and Forecasts To 2030 (US$ Million) – Source
Table 77. Rest of Asia Pacific Non-Dairy Yogurt Market Revenue and Forecasts To 2030 (US$ Million) – Type
Table 78. Rest of Asia Pacific Non-Dairy Yogurt Market Revenue and Forecasts To 2030 (US$ Million) – Nature
Table 79. Rest of Asia Pacific Non-Dairy Yogurt Market Revenue and Forecasts To 2030 (US$ Million) – Distribution Channel
Table 80. Middle East & Africa Non-Dairy Yogurt Market Revenue and Forecasts To 2030 (US$ Million) – By Source
Table 81. Middle East & Africa Non-Dairy Yogurt Market Revenue and Forecasts To 2030 (US$ Million) – By Type
Table 82. Middle East & Africa Non-Dairy Yogurt Market Revenue and Forecasts To 2030 (US$ Million) – By Nature
Table 83. Middle East & Africa Non-Dairy Yogurt Market Revenue and Forecasts To 2030 (US$ Million) – By Distribution Channel
Table 84. South Africa Non-Dairy Yogurt Market Revenue and Forecasts To 2030 (US$ Million) – By Source
Table 85. South Africa Non-Dairy Yogurt Market Revenue and Forecasts To 2030 (US$ Million) – By Type
Table 86. South Africa Non-Dairy Yogurt Market Revenue and Forecasts To 2030 (US$ Million) – By Nature
Table 87. South Africa Non-Dairy Yogurt Market Revenue and Forecasts To 2030 (US$ Million) – By Distribution Channel
Table 88. Saudi Arabia Non-Dairy Yogurt Market Revenue and Forecasts To 2030 (US$ Million) – By Source
Table 89. Saudi Arabia Non-Dairy Yogurt Market Revenue and Forecasts To 2030 (US$ Million) – By Type
Table 90. Saudi Arabia Non-Dairy Yogurt Market Revenue and Forecasts To 2030 (US$ Million) – By Nature
Table 91. Saudi Arabia Non-Dairy Yogurt Market Revenue and Forecasts To 2030 (US$ Million) – By Distribution Channel
Table 92. UAE Non-Dairy Yogurt Market Revenue and Forecasts To 2030 (US$ Million) – By Source
Table 93. UAE Non-Dairy Yogurt Market Revenue and Forecasts To 2030 (US$ Million) – By Type
Table 94. UAE Non-Dairy Yogurt Market Revenue and Forecasts To 2030 (US$ Million) – By Nature
Table 95. UAE Non-Dairy Yogurt Market Revenue and Forecasts To 2030 (US$ Million) – By Distribution Channel
Table 96. Rest of Middle East & Africa Non-Dairy Yogurt Market Revenue and Forecasts To 2030 (US$ Million) – By Source
Table 97. Rest of Middle East & Africa Non-Dairy Yogurt Market Revenue and Forecasts To 2030 (US$ Million) – By Type
Table 98. Rest of Middle East & Africa Non-Dairy Yogurt Market Revenue and Forecasts To 2030 (US$ Million) – By Nature
Table 99. Rest of Middle East & Africa Non-Dairy Yogurt Market Revenue and Forecasts To 2030 (US$ Million) – By Distribution Channel
Table 100. South & Central America Non-Dairy Yogurt Market Revenue and Forecasts To 2030 (US$ Million) – By Source
Table 101. South & Central America Non-Dairy Yogurt Market Revenue and Forecasts To 2030 (US$ Million) – By Type
Table 102. South & Central America Non-Dairy Yogurt Market Revenue and Forecasts To 2030 (US$ Million) – By Nature
Table 103. South & Central America Non-Dairy Yogurt Market Revenue and Forecasts To 2030 (US$ Million) – By Distribution Channel
Table 104. Brazil Non-Dairy Yogurt Market Revenue and Forecasts To 2030 (US$ Million) – By Source
Table 105. Brazil Non-Dairy Yogurt Market Revenue and Forecasts To 2030 (US$ Million) – By Type
Table 106. Brazil Non-Dairy Yogurt Market Revenue and Forecasts To 2030 (US$ Million) – By Nature
Table 107. Brazil Non-Dairy Yogurt Market Revenue and Forecasts To 2030 (US$ Million) – By Distribution Channel
Table 108. Argentina Non-Dairy Yogurt Market Revenue and Forecasts To 2030 (US$ Million) – By Source
Table 109. Argentina Non-Dairy Yogurt Market Revenue and Forecasts To 2030 (US$ Million) – By Type
Table 110. Argentina Non-Dairy Yogurt Market Revenue and Forecasts To 2030 (US$ Million) – By Nature
Table 111. Argentina Non-Dairy Yogurt Market Revenue and Forecasts To 2030 (US$ Million) – By Distribution Channel
Table 112. Rest of South & Central America Non-Dairy Yogurt Market Revenue and Forecasts To 2030 (US$ Million) – By Source
Table 113. Rest of South & Central America Non-Dairy Yogurt Market Revenue and Forecasts To 2030 (US$ Million) – By Type
Table 114. Rest of South & Central America Non-Dairy Yogurt Market Revenue and Forecasts To 2030 (US$ Million) – By Nature
Table 115. Rest of South & Central America Non-Dairy Yogurt Market Revenue and Forecasts To 2030 (US$ Million) – By Distribution Channel
List of Figures
Figure 1. Non-Dairy Yogurt Market Segmentation, By Geography
Figure 2. Porter's Five Forces Analysis: Global Non-Dairy Yogurt Market
Figure 3. Ecosystem: Non-Dairy Yogurt Market
Figure 4. Non-Dairy Yogurt Market - Key Industry Dynamics
Figure 5. Registrations for Veganuary Campaign from 2016 to 2022
Figure 6. Annual Greenhouse Gas Emissions (GHG) Per Kilogram of Food Products
Figure 7. Non-Dairy Yogurt Market: Impact Analysis of Drivers and Restraints
Figure 8. Non-Dairy Yogurt Market Revenue (US$ Million), 2020 – 2030
Figure 9. Global Non-Dairy Yogurt Market Share (%) – Source, 2022 and 2030
Figure 10. Almond Market Revenue and Forecasts To 2030 (US$ Million)
Figure 11. Soy Market Revenue and Forecasts To 2030 (US$ Million)
Figure 12. Coconut Market Revenue and Forecasts To 2030 (US$ Million)
Figure 13. Oat Market Revenue and Forecasts To 2030 (US$ Million)
Figure 14. Others Market Revenue and Forecasts To 2030 (US$ Million)
Figure 15. Global Non-Dairy Yogurt Market Share (%) – Type, 2022 and 2030
Figure 16. Flavored Market Revenue and Forecasts To 2030 (US$ Million)
Figure 17. Plain Market Revenue and Forecasts To 2030 (US$ Million)
Figure 18. Global Non-Dairy Yogurt Market Share (%) –Nature, 2022 and 2030
Figure 19. Organic Market Revenue and Forecasts To 2030 (US$ Million)
Figure 20. Conventional Market Revenue and Forecasts To 2030 (US$ Million)
Figure 21. Global Non-Dairy Yogurt Market Share (%) –Distribution Channel, 2022 and 2030
Figure 22. Supermarkets and Hypermarkets Market Revenue and Forecasts To 2030 (US$ Million)
Figure 23. Convenience Stores Market Revenue and Forecasts To 2030 (US$ Million)
Figure 24. Online Retail Market Revenue and Forecasts To 2030 (US$ Million)
Figure 25. Others Market Revenue and Forecasts To 2030 (US$ Million)
Figure 26. Non-Dairy Yogurt Market Breakdown by Geography, 2022 and 2030 (%)
Figure 27. North America Non-Dairy Yogurt Market Revenue and Forecasts To 2030 (US$ Mn)
Figure 28. North America Non-Dairy Yogurt Market Breakdown by Source (2022 and 2030)
Figure 29. North America Non-Dairy Yogurt Market Breakdown by Type (2022 and 2030)
Figure 30. North America Non-Dairy Yogurt Market Breakdown by Nature (2022 and 2030)
Figure 31. North America Non-Dairy Yogurt Market Breakdown by Distribution Channel (2022 and 2030)
Figure 32. North America Non-Dairy Yogurt Market Breakdown by Key Countries, 2022 and 2030 (%)
Figure 33. US Non-Dairy Yogurt Market Revenue and Forecasts To 2030 (US$ Mn)
Figure 34. Canada Non-Dairy Yogurt Market Revenue and Forecasts To 2030 (US$ Mn)
Figure 35. Mexico Non-Dairy Yogurt Market Revenue and Forecasts To 2030 (US$ Mn)
Figure 36. Europe Non-Dairy Yogurt Market Revenue and Forecasts To 2030 (US$ Mn)
Figure 37. Europe Non-Dairy Yogurt Market Breakdown by Source (2022 and 2030)
Figure 38. Europe Non-Dairy Yogurt Market Breakdown by Type (2022 and 2030)
Figure 39. Europe Non-Dairy Yogurt Market Breakdown by Nature (2022 and 2030)
Figure 40. Europe Non-Dairy Yogurt Market Breakdown by Distribution Channel (2022 and 2030)
Figure 41. Europe Non-Dairy Yogurt Market Breakdown by Key Countries, 2022 and 2030 (%)
Figure 42. Germany Non-Dairy Yogurt Market Revenue and Forecasts To 2030 (US$ Mn)
Figure 43. France Non-Dairy Yogurt Market Revenue and Forecasts To 2030 (US$ Mn)
Figure 44. Italy Non-Dairy Yogurt Market Revenue and Forecasts To 2030 (US$ Mn)
Figure 45. UK Non-Dairy Yogurt Market Revenue and Forecasts To 2030 (US$ Mn)
Figure 46. Russia Non-Dairy Yogurt Market Revenue and Forecasts To 2030 (US$ Mn)
Figure 47. Rest of Europe Non-Dairy Yogurt Market Revenue and Forecasts To 2030 (US$ Mn)
Figure 48. Asia Pacific Non-Dairy Yogurt Market Revenue and Forecasts To 2030 (US$ Million)
Figure 49. Asia Pacific Non-Dairy Yogurt Market Breakdown by Source (2022 and 2023)
Figure 50. Asia Pacific Non-Dairy Yogurt Market Breakdown by Type (2022 and 2023)
Figure 51. Asia Pacific Non-Dairy Yogurt Market Breakdown by Nature (2022 and 2023)
Figure 52. Asia Pacific Non-Dairy Yogurt Market Breakdown by Distribution Channel (2022 and 2023)
Figure 53. Asia Pacific Non-Dairy Yogurt Market Breakdown By Key Countries, 2022 And 2030 (%)
Figure 54. Australia Non-Dairy Yogurt Market Revenue and Forecasts To 2030 (US$ Million)
Figure 55. China Non-Dairy Yogurt Market Revenue and Forecasts To 2030 (US$ Million)
Figure 56. India Non-Dairy Yogurt Market Revenue and Forecasts To 2030 (US$ Million)
Figure 57. Japan Non-Dairy Yogurt Market Revenue and Forecasts To 2030 (US$ Million)
Figure 58. South Korea Non-Dairy Yogurt Market Revenue and Forecasts To 2030 (US$ Million)
Figure 59. Rest of Asia Pacific Non-Dairy Yogurt Market Revenue and Forecasts To 2030 (US$ Million)
Figure 60. Middle East & Africa Non-Dairy Yogurt Market Revenue and Forecasts To 2030 (US$ Million)
Figure 61. Middle East & Africa Non-Dairy Yogurt Market Breakdown by Source (2022 and 2023)
Figure 62. Middle East & Africa Non-Dairy Yogurt Market Breakdown by Type (2022 and 2023)
Figure 63. Middle East & Africa Non-Dairy Yogurt Market Breakdown by Nature (2022 and 2023)
Figure 64. Middle East & Africa Non-Dairy Yogurt Market Breakdown by Distribution Channel (2022 and 2023)
Figure 65. Non-Dairy Yogurt Market Breakdown by Key Countries, 2022 and 2030 (%)
Figure 66. South Africa Non-Dairy Yogurt Market Revenue and Forecasts To 2030 (US$ Million)
Figure 67. Saudi Arabia Non-Dairy Yogurt Market Revenue and Forecasts To 2030 (US$ Million)
Figure 68. UAE Non-Dairy Yogurt Market Revenue and Forecasts To 2030 (US$ Million)
Figure 69. Rest of Middle East & Africa Non-Dairy Yogurt Market Revenue and Forecasts To 2030 (US$ Million)
Figure 70. South & Central America Non-Dairy Yogurt Market Revenue and Forecasts To 2030 (US$ Million)
Figure 71. South & Central America Non-Dairy Yogurt Market Breakdown by Source (2022 and 2023)
Figure 72. South & Central America Non-Dairy Yogurt Market Breakdown by Type (2022 and 2023)
Figure 73. South & Central America Non-Dairy Yogurt Market Breakdown by Nature (2022 and 2023)
Figure 74. South & Central America Non-Dairy Yogurt Market Breakdown by Distribution Channel (2022 and 2023)
Figure 75. South & Central America Non-Dairy Yogurt Market Breakdown by Key Countries, 2022 and 2030 (%)
Figure 76. Brazil Non-Dairy Yogurt Market Revenue and Forecasts To 2030 (US$ Million)
Figure 77. Argentina Non-Dairy Yogurt Market Revenue and Forecasts To 2030 (US$ Million)
Figure 78. Rest of South & Central America Non-Dairy Yogurt Market Revenue and Forecasts To 2030 (US$ Million)
Figure 79. Heat Map Analysis- By Key Players
Figure 80. Company Positioning & Concentration
The List of Companies - Non-Dairy Yogurt Market
- The Hain Celestial Group Inc
- Danone SA
- Springfield Creamery Inc
- Lyrical Foods Inc
- COYO Pty Ltd
- Valio Ltd
- Oatly Group AB
- Daiya Foods Inc
- Forager Project LLC
- Harmless Harvest Inc
The Insight Partners performs research in 4 major stages: Data Collection & Secondary Research, Primary Research, Data Analysis and Data Triangulation & Final Review.
- Data Collection and Secondary Research:
As a market research and consulting firm operating from a decade, we have published many reports and advised several clients across the globe. First step for any study will start with an assessment of currently available data and insights from existing reports. Further, historical and current market information is collected from Investor Presentations, Annual Reports, SEC Filings, etc., and other information related to company’s performance and market positioning are gathered from Paid Databases (Factiva, Hoovers, and Reuters) and various other publications available in public domain.
Several associations trade associates, technical forums, institutes, societies and organizations are accessed to gain technical as well as market related insights through their publications such as research papers, blogs and press releases related to the studies are referred to get cues about the market. Further, white papers, journals, magazines, and other news articles published in the last 3 years are scrutinized and analyzed to understand the current market trends.
- Primary Research:
The primarily interview analysis comprise of data obtained from industry participants interview and answers to survey questions gathered by in-house primary team.
For primary research, interviews are conducted with industry experts/CEOs/Marketing Managers/Sales Managers/VPs/Subject Matter Experts from both demand and supply side to get a 360-degree view of the market. The primary team conducts several interviews based on the complexity of the markets to understand the various market trends and dynamics which makes research more credible and precise.
A typical research interview fulfils the following functions:
- Provides first-hand information on the market size, market trends, growth trends, competitive landscape, and outlook
- Validates and strengthens in-house secondary research findings
- Develops the analysis team’s expertise and market understanding
Primary research involves email interactions and telephone interviews for each market, category, segment, and sub-segment across geographies. The participants who typically take part in such a process include, but are not limited to:
- Industry participants: VPs, business development managers, market intelligence managers and national sales managers
- Outside experts: Valuation experts, research analysts and key opinion leaders specializing in the electronics and semiconductor industry.
Below is the breakup of our primary respondents by company, designation, and region:

Once we receive the confirmation from primary research sources or primary respondents, we finalize the base year market estimation and forecast the data as per the macroeconomic and microeconomic factors assessed during data collection.
- Data Analysis:
Once data is validated through both secondary as well as primary respondents, we finalize the market estimations by hypothesis formulation and factor analysis at regional and country level.
- 3.1 Macro-Economic Factor Analysis:
We analyse macroeconomic indicators such the gross domestic product (GDP), increase in the demand for goods and services across industries, technological advancement, regional economic growth, governmental policies, the influence of COVID-19, PEST analysis, and other aspects. This analysis aids in setting benchmarks for various nations/regions and approximating market splits. Additionally, the general trend of the aforementioned components aid in determining the market's development possibilities.
- 3.2 Country Level Data:
Various factors that are especially aligned to the country are taken into account to determine the market size for a certain area and country, including the presence of vendors, such as headquarters and offices, the country's GDP, demand patterns, and industry growth. To comprehend the market dynamics for the nation, a number of growth variables, inhibitors, application areas, and current market trends are researched. The aforementioned elements aid in determining the country's overall market's growth potential.
- 3.3 Company Profile:
The “Table of Contents” is formulated by listing and analyzing more than 25 - 30 companies operating in the market ecosystem across geographies. However, we profile only 10 companies as a standard practice in our syndicate reports. These 10 companies comprise leading, emerging, and regional players. Nonetheless, our analysis is not restricted to the 10 listed companies, we also analyze other companies present in the market to develop a holistic view and understand the prevailing trends. The “Company Profiles” section in the report covers key facts, business description, products & services, financial information, SWOT analysis, and key developments. The financial information presented is extracted from the annual reports and official documents of the publicly listed companies. Upon collecting the information for the sections of respective companies, we verify them via various primary sources and then compile the data in respective company profiles. The company level information helps us in deriving the base number as well as in forecasting the market size.
- 3.4 Developing Base Number:
Aggregation of sales statistics (2020-2022) and macro-economic factor, and other secondary and primary research insights are utilized to arrive at base number and related market shares for 2022. The data gaps are identified in this step and relevant market data is analyzed, collected from paid primary interviews or databases. On finalizing the base year market size, forecasts are developed on the basis of macro-economic, industry and market growth factors and company level analysis.
- Data Triangulation and Final Review:
The market findings and base year market size calculations are validated from supply as well as demand side. Demand side validations are based on macro-economic factor analysis and benchmarks for respective regions and countries. In case of supply side validations, revenues of major companies are estimated (in case not available) based on industry benchmark, approximate number of employees, product portfolio, and primary interviews revenues are gathered. Further revenue from target product/service segment is assessed to avoid overshooting of market statistics. In case of heavy deviations between supply and demand side values, all thes steps are repeated to achieve synchronization.
We follow an iterative model, wherein we share our research findings with Subject Matter Experts (SME’s) and Key Opinion Leaders (KOLs) until consensus view of the market is not formulated – this model negates any drastic deviation in the opinions of experts. Only validated and universally acceptable research findings are quoted in our reports.
We have important check points that we use to validate our research findings – which we call – data triangulation, where we validate the information, we generate from secondary sources with primary interviews and then we re-validate with our internal data bases and Subject matter experts. This comprehensive model enables us to deliver high quality, reliable data in shortest possible time.
Trends and growth analysis reports related to Non-Dairy Yogurt Market

Sep 2023
Wheat Bran/Offal Market
Size and Forecast (2021 - 2031), Global and Regional Share, Trend, and Growth Opportunity Analysis Report Coverage: By Form (Flour/Meal, Flakes, and Pellets), Category (Organic and Conventional), Application (Animal Feed, Breakfast Cereals, Nutritional Bars, Beverages, Baked Goods, and Others), and Geography
Sep 2023
Blueberries Market
Size and Forecast (2021 - 2031), Global and Regional Share, Trend, and Growth Opportunity Analysis Report Coverage: By Form (Fresh, Frozen, and Dried), Category (Conventional and Organic), End Use (Food Service, Food Retail, and Food Processing), and Geography
Sep 2023
Resistant Starch Market
Size and Forecast (2021 - 2031), Global and Regional Share, Trend, and Growth Opportunity Analysis Report Coverage: By Form (Dry and Liquid), Type (Type1, Type2, Type3, and Type4), Application [Food and Beverages (Bakery and Confectionery, Dairy and Frozen Dessert, Beverages, Sweet and Savory Snacks, and Others), Dietary Supplements, and Animal Nutrition], and Geography
Sep 2023
Demineralized Whey Powder Market
Size and Forecast (2021 - 2031), Global and Regional Share, Trend, and Growth Opportunity Analysis Report Coverage: By Type (50% Demineralized Whey, 70% Demineralized Whey, 90% Demineralized Whey, and Others), Category (Conventional and Organic), Application (Bakery and Confectionery, Dairy and Frozen Desserts, Infant Nutrition, Beverages, and Others), and Geography
Sep 2023
Tallow Market
Size and Forecast (2021 - 2031), Global and Regional Share, Trend, and Growth Opportunity Analysis Report Coverage: By Source (Beef, Sheep, and Others), End-Use Industry (Food & Beverages, Personal Care & Cosmetics, Lubricants, Biofuel, Animal Nutrition, and Others), and Geography
Sep 2023
Frozen Belgian Waffles Market
Size and Forecast (2021 - 2031), Global and Regional Share, Trend, and Growth Opportunity Analysis Report Coverage: By Product Type (Brussels Waffles and Liege Waffles/Belgian Sugar Waffles), Nature (Flavored and Plain), Category (Conventional and Gluten-Free), End User (Foodservice and Food Retail), and Geography
Sep 2023
Frozen Bakery Products Market
Size and Forecast (2021 - 2031), Global and Regional Share, Trend, and Growth Opportunity Analysis Report Coverage: By Product Type (Bread and Rolls, Cakes and Pastries, Biscuits and Cookies, and Others), Category (Gluten-Free and Conventional), Distribution Channel (Supermarkets and Hypermarkets, Convenience Stores, Online Retail, and Others), and Geography
 Get Free Sample For