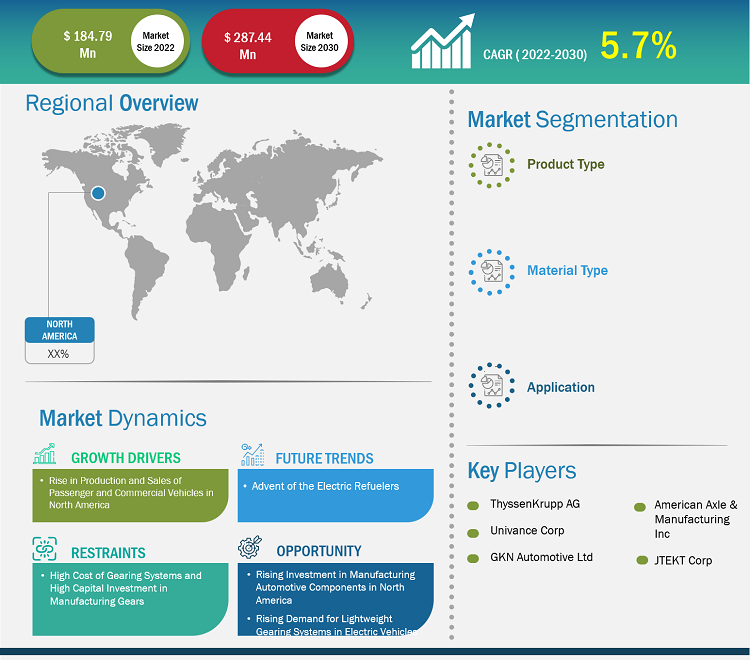
The North America automotive gears market accounted for US$ 7,593.71 million in 2022 and is expected to grow at a CAGR of 4.0% from 2022 to 2030 to reach US$ 10,378.52 million by 2030.
Analyst Perspective:
In North America, the US significantly contributes to the automobile industry. According to the Alliance for Automotive Innovation Report in 2021, the automotive industry's ecosystem, from automotive component manufacturers to the original vehicle manufacturers, generates over US$ 1 trillion annually for the US economy. The automotive sector in the US contributed 4.9% of its overall GDP, with manufacturing of vehicles and their parts representing 6% of the overall manufacturing in the country. Motor vehicles and parts, including gears, seating systems, doors, and transmission systems, are heavily exported from the US. Automotive vehicles and their components were the second-largest exporting goods in 2021, valued at ~US$ 105 billion. The rising demand for automotive components by the original vehicle manufacturers worldwide is anticipated to create ample opportunity for the automotive gears market. The original vehicle manufacturers widely use automotive gears to produce good-quality vehicles. The US-based ports have achieved over US$ 400 billion in trade volume in vehicles and components. This yearly sale of cars in the US has created a massive demand for automotive gears market for manufacturing cars.
Market Overview:
The North American automotive industry is a major driving component of its economic growth. According to the Centre for Automotive Research Organization, the automotive industry's total size in the global economy was ~US$ 2.8 trillion in 2022, accounting for 3% of the global economic GDP. The automotive industry in North America generates more than US$ 500 billion in annual sales of vehicles. It employs more than 1.7 million people in the US, as per the National Automobile Dealers Association (NADA) report 2022. As per the same source, the automotive ecosystem (including direct, indirect, and induced value added) annually generates more than US$ 1 trillion in the US, i.e., 4.9% of the US GDP. Thus, the well-established automotive industry is bolstering the automotive gears market growth.
Automotive gears help regulate rotational speed and power by transferring the energy produced by the engine to the wheels safely and efficiently. Typically, gears have several teeth that are in contact with other gears. In various transmission systems, several arrangements of gear of varying sizes are involved to transmit power. Some of the major types of gear used in automotive are spur gear, bevel gear, helical gear, and hypoid gear. Automotive gears are meshed together and deliver appropriate power and torque that help control the vehicle's speed. The rising vehicle production with the surge in disposable income is driving the automotive gears market share in North America. As per the International Organization of Motor Vehicle Manufacturers (OICA), in 2022, global automotive car production increased to 61.5 million (an ~8.0% increase) compared to the previous year. Also, overall car sales in the US market reached 1.75 million units in 2022, which increased by ~12% compared to the previous year. This yearly sale of cars in the US has created a massive demand for automotive gears market for manufacturing cars.
Customize Research To Suit Your Requirement
We can optimize and tailor the analysis and scope which is unmet through our standard offerings. This flexibility will help you gain the exact information needed for your business planning and decision making.
North America Automotive Gears Market: Strategic Insights
Market Size Value in US$ 7,593.71 million in 2022 Market Size Value by US$ 10,378.52 million by 2030 Growth rate CAGR of 4.0% from 2022 to 2030 Forecast Period 2022-2030 Base Year 2022

Naveen
Have a question?
Naveen will walk you through a 15-minute call to present the report’s content and answer all queries if you have any.
 Speak to Analyst
Customize Research To Suit Your Requirement
We can optimize and tailor the analysis and scope which is unmet through our standard offerings. This flexibility will help you gain the exact information needed for your business planning and decision making.
North America Automotive Gears Market: Strategic Insights
| Market Size Value in | US$ 7,593.71 million in 2022 |
| Market Size Value by | US$ 10,378.52 million by 2030 |
| Growth rate | CAGR of 4.0% from 2022 to 2030 |
| Forecast Period | 2022-2030 |
| Base Year | 2022 |
Naveen
Have a question?
Naveen will walk you through a 15-minute call to present the report’s content and answer all queries if you have any.
Speak to Analyst
Market Driver:
Favorable Policies for Manufacturing Vehicle Components Across North America Boosting the Automotive Gears Market Growth
North America has the presence of several leading automotive brand manufacturers, including General Motors Co., Ford Motor Co., PACCAR Inc., Tesla Inc., Navistar International Corp, Rivian Automotive Inc., and BMW AG. These leading players require several automotive components to manufacture commercial and passenger vehicles. In North America, the governments support increasing the local production of automobiles and their parts. The United States government has imposed several favorable policies for manufacturing automotive components. For instance, per the United States-Mexico-Canada Agreement (USMCA), motor vehicles produced in North America must contain ~75% of automotive parts made of steel and aluminum originating from this region. As per the USMCA, the regional value content (RVC) requirements are ~75% for the vehicles produced in North America under the new rule by the North American Free Trade Agreement (NAFTA). Such favorable government policies are increasing automotive gears market growth.
According to Mexico's National Auto Parts Industry (INA) Report, auto parts production reached ~US$ 107 billion in 2022, an increase of 13% compared to the previous year. Favorable trade and manufacturing policies by governments to promote the automotive industry are driving the automotive gears market.
- Sample PDF showcases the content structure and the nature of the information with qualitative and quantitative analysis.
- Request discounts available for Start-Ups & Universities
Segmental Analysis:
Based on product type, the North America automotive gears market is segmented into planetary gears, spur gears, bevel gears, helical gears, worm gears, rack & pinion gears, hypoid gears, and others.
Spur gears transmit power to the shafts that are parallel to each other. The spur gear's teeth are parallel to the shaft's axis. This causes radial movement of the gears on the shaft. These gears are slightly noisier than helical gears, operating through a single contact line between the teeth. Several key automotive component manufacturers across North American countries are developing advanced spur gear designs that enhance transmission efficiency and power. Key automotive gears market players are investing a considerable amount to develop innovative designs of the spur gears. In September 2020, Associated Electrics, Inc. launched an innovative design of octalock spur gears. These gears were designed in an octagon shape with a locking system that engages the spur gear for maximum longevity and security. Spur gears are primarily used in heavy commercial vehicles for torque and power. Spur gears connect the parallel shaft gear group and are cylindrical gears with a tooth line straight and parallel to the shaft. The rising sales and production of heavy commercial vehicles in North American countries is the major driving factor for the automotive gears market. Volvo, a manufacturer of heavy commercial vehicles, reached a sale of 0.32 million truck units in North America and Europe. Also, according to the International Organization of Motor Vehicle Manufacturers (OICA) report, in 2021, heavy truck sales in North America reached 0.62 million units, an increase of 30% compared to 2020. Such an increase in the sale of heavy commercial vehicles created a steady growth for automotive gears market share in North America.

- Sample PDF showcases the content structure and the nature of the information with qualitative and quantitative analysis.
- Request discounts available for Start-Ups & Universities
Regional Analysis:
According to Mexico's National Auto Parts Industry (INA) Report, auto parts production reached ~US$ 107 billion in 2022, an increase of 13% compared to the previous year. Favorable trade and manufacturing policies by governments to promote the automotive industry are driving the automotive gears market. For instance, between 2021 and 2022, Canadian subsidiaries of US automotive manufacturers have made substantial investments in Canada. In 2021, General Motors invested more than US$ 785 million, Ford Motors invested US$ 1.5 billion, and Stellantis invested US$ 1.14 billion to expand their production facilities of electric and IC engine vehicles. In 2021, Canadian original vehicle manufacturers imported US$ 13.1 billion of automotive components in the country. Thus, the growing investment in automotive industry may contribute to the growth of automotive gears market share in Canada.
Key Player Analysis:
ThyssenKrupp AG, American Axle & Manufacturing Inc, JTEKT Corp, Univance Corp, and GKN Automotive Ltd are the prominent market participants in the North America automotive gears market.
Recent Developments:
Inorganic and organic strategies such as mergers and acquisitions are highly adopted by companies in the North America automotive gears market. The market initiative is a strategy adopted by automotive gears market players to expand their footprint across the world and to meet the growing customer demand. The market players present in the North America automotive gears market are mainly focusing on product and service enhancements by integrating advanced features and technologies into their offerings. A few recent developments by the key North America automotive gears market players are listed below:
Year | News |
2022 | American Axle & Manufacturing committed US$ 15 million to Autotech Ventures in a partnership that provided access to new opportunities that complement AAM's mission to develop and produce efficient and powerful electric drivelines. |
2023 | Gear Motions had announced that Auto Gear Inc joined the Gear Motion's family. Auto Gear, located in Syracuse, New York, specializes in efficient and economical low-volume gearbox production, from design to delivery. |

Report Coverage
Revenue forecast, Company Analysis, Industry landscape, Growth factors, and Trends

Segment Covered
Product Type, Material Type, and Application

Regional Scope
North America, Europe, Asia Pacific, Middle East & Africa, South & Central America

Country Scope
This text is related
to country scope.
Frequently Asked Questions
Electric vehicles consist of lightweight gears for the transmission. The rising adoption of lightweight electric vehicles among North American countries has created significant opportunities for the lightweight automotive gears market. The electric vehicle manufacturers use single-ratio gearbox made with lightweight materials.
In North America, the US significantly contributes to the automobile industry. According to the Alliance for Automotive Innovation Report in 2021, the automotive industry's ecosystem, beginning with automotive component manufacturers to the original vehicle manufacturers, generates over US$ 1 trillion annually for the US economy. The automotive sector in the US contributed 4.9% of its overall GDP, with manufacturing of vehicles and their parts representing 6% of the overall manufacturing in the country.
There is an increase in production and sales of passenger and commercial vehicles in North America. According to the International Organization of Motor Vehicle Manufacturers (OICA), light commercial vehicle production in North America reached ~11.56 million in 2022, an increase from 10.4 million the previous year. Also, as per the same source, passenger car production in North America reached 2.69 million units in 2022, which increased 5.5% compared to 2021.
The adoption of advanced technologies and the formation of associations for automotive industry growth are expected to create significant opportunities for the automotive gears market. For example, forming North America's Business Association for Autonomous Vehicle Clusters to create value and develop autonomous vehicle-related programs created significant market opportunities. Increasing investments by the key players and rising automotive industry associations are expected to create ample opportunities for market growth.
ThyssenKrupp AG, American Axle & Manufacturing Inc, JTEKT Corp, Univance Corp, and GKN Automotive Ltd are the top key market players operating in the North America automotive gears market.
1. Introduction
1.1 The Insight Partners Research Report Guidance
1.2 Market Segmentation
2. Executive Summary
2.1 Key Insights
2.2 Market Attractiveness
3. Research Methodology
3.1 Coverage
3.2 Secondary Research
3.3 Primary Research
4. Automotive Gears Market Landscape
4.1 Overview
4.2 PEST Analysis
4.3 Ecosystem Analysis
4.3.1 List of Vendors in the Value Chain
5. Automotive Gears Market - Key Industry Dynamics
5.1 Key Market Drivers:
5.1.1 Rise in Production and Sales of Passenger and Commercial Vehicles in North America
5.1.2 Favorable Policies for Manufacturing Vehicle Components Across North America
5.1.3 Rise in Demand for Energy-Efficient Automatic Transmission Systems
5.2 Restraints:
5.2.1 High Cost of Gearing Systems and High Capital Investment in Manufacturing Gears
5.3 Opportunities:
5.3.1 Rising Investment in Manufacturing Automotive Components in North America
5.4 Trends:
5.4.1 Rising Demand for Lightweight Gearing Systems in Electric Vehicles
5.5 Impact of Drivers And Restraints:
6. Automotive Gears Market – Regional Market Analysis
6.1 Automotive Gears Market Revenue (US$ Mn), 2020 – 2030
6.2 Automotive Gears Market Forecast And Analysis
7. Automotive Gears Market Analysis – Product type
7.1 Overview
7.2 North America Automotive Gears Market, by Product type (2022 and 2030)
7.3 Product type Market Forecasts And Analysis
7.4 Spur gears
7.4.1 Overview
7.4.2 Spur gears: North America Automotive Gears Market Revenue and Forecast to 2030 (US$ Million)
7.5 Bevel gears
7.5.1 Overview
7.5.2 Bevel gears: North America Automotive Gears Market Revenue and Forecast to 2030 (US$ Million)
7.6 Helical Gears
7.6.1 Overview
7.6.2 Helical gears: North America Automotive Gears Market Revenue and Forecast to 2030 (US$ Million)
7.7 Worm Gears
7.7.1 Overview
7.7.2 Worm Gears: North America Automotive Gears Market Revenue and Forecast to 2030 (US$ Million)
7.8 Planetary Gears
7.8.1 Overview
7.8.2 Planetary Gears Market Volume, Revenue and Forecast to 2030 (US$ Mn)
7.9 Rack & Pinion Gears
7.9.1 Overview
7.9.2 Rack & Pinion Gears Market Volume, Revenue and Forecast to 2030 (US$ Mn)
7.10 Hypoid Gears
7.10.1 Overview
7.10.2 Hypoid Gears Market Volume, Revenue and Forecast to 2030 (US$ Mn)
7.11 Others
7.11.1 Overview
7.11.2 Others Market Volume, Revenue and Forecast to 2030 (US$ Mn)
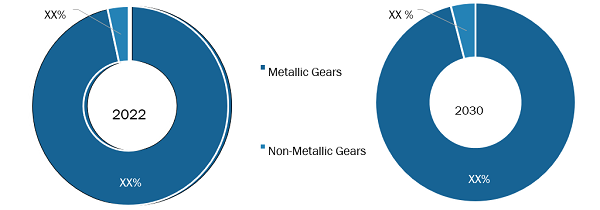
8. North America Automotive Gears Market Revenue Analysis - by Material Type
8.1 Overview
8.2 North America Automotive Gears Market, by Application (2022 and 2030)
8.3 Metallic Gears
8.3.1 Overview
8.3.2 Metallic Gears: North America Automotive Gears Market Revenue and Forecast to 2030 (US$ Million)
8.4 Non-metallic Gears
8.4.1 Overview
8.4.2 Non-metallic Gears: North America Automotive Gears Market Revenue and Forecast to 2030 (US$ Million)
9. North America Automotive Gears Market Revenue Analysis - by Application
9.1 Overview
9.2 North America Automotive Gears Market, by Application (2022 and 2030)
9.3 Transmission System
9.3.1 Overview
9.3.2 Transmission System: North America Automotive Gears Market Revenue and Forecast to 2030 (US$ Million)
9.4 Steering System
9.4.1 Overview
9.4.2 Steering System: North America Automotive Gears Market Revenue and Forecast to 2030 (US$ Million)
9.5 Differential System
9.5.1 Overview
9.5.2 Differential System: North America Automotive Gears Market Revenue and Forecast to 2030 (US$ Million)
9.6 Others
9.6.1 Overview
9.6.2 Others: North America Automotive Gears Market Revenue and Forecast to 2030 (US$ Million)
10. North America Automotive Gears Market – Regional Analysis
10.1 Overview
10.2 North America Automotive Gears Market Revenue and Forecasts To 2030 (US$ Mn)
10.2.1 North America Automotive Gears Market Breakdown by Product type
10.2.2 North America Automotive Gears Market Breakdown by Material Type
10.2.3 North America: Automotive Gears Market, by Application
10.2.4 North America Automotive Gears Market Breakdown by Country
10.2.4.1 United States Automotive Gears Market Revenue and Forecasts To 2030 (US$ Mn)
10.2.4.1.1 United States Automotive Gears Market Breakdown by Product type
10.2.4.1.2 United States Automotive Gears Market Breakdown by Material type
10.2.4.1.3 United States Automotive Gears Market Breakdown by Application
10.2.4.2 Canada Automotive Gears Market Revenue and Forecasts To 2030 (US$ Mn)
10.2.4.2.1 Canada Automotive Gears Market Breakdown by Product type
10.2.4.2.2 Canada Automotive Gears Market Breakdown by Material type
10.2.4.2.3 Canada Automotive Gears Market Breakdown by Application
10.2.4.3 Mexico Automotive Gears Market Revenue and Forecasts To 2030 (US$ Mn)
10.2.4.3.1 Mexico Automotive Gears Market Breakdown by Product type
10.2.4.3.2 Mexico Automotive Gears Market Breakdown by Material type
10.2.4.3.3 Mexico Automotive Gears Market Breakdown by Application
11. Covid-19 Impact Analysis
12. Competitive Landscape
12.1 Company Positioning & Concentration
13. Industry Landscape
13.1 Overview
13.2 Market Initiative
13.3 Product Development
13.4 Mergers & Acquisitions
14. Company Profiles
14.1 SymmcoInc
14.1.1 Key Facts
14.1.2 Business Description
14.1.3 Products and Services
14.1.4 Financial Overview
14.1.5 SWOT Analysis
14.1.6 Key Developments
14.2 JTEKT Corp
14.2.1 Key Facts
14.2.2 Business Description
14.2.3 Products and Services
14.2.4 Financial Overview
14.2.5 SWOT Analysis
14.2.6 Key Developments
14.3 American Axle & Manufacturing Inc
14.3.1 Key Facts
14.3.2 Business Description
14.3.3 Products and Services
14.3.4 Financial Overview
14.3.5 SWOT Analysis
14.3.6 Key Developments
14.4 ThyssenKrupp AG
14.4.1 Key Facts
14.4.2 Business Description
14.4.3 Products and Services
14.4.4 Financial Overview
14.4.5 SWOT Analysis
14.4.6 Key Developments
14.5 Dana Inc
14.5.1 Key Facts
14.5.2 Business Description
14.5.3 Products and Services
14.5.4 Financial Overview
14.5.5 SWOT Analysis
14.5.6 Key Developments
14.6 Gear Motions Inc
14.6.1 Key Facts
14.6.2 Business Description
14.6.3 Products and Services
14.6.4 Financial Overview
14.6.5 SWOT Analysis
14.6.6 Key Developments
14.7 GKN Automotive Ltd
14.7.1 Key Facts
14.7.2 Business Description
14.7.3 Products and Services
14.7.4 Financial Overview
14.7.5 SWOT Analysis
14.7.6 Key Developments
14.8 AmTech International Inc
14.8.1 Key Facts
14.8.2 Business Description
14.8.3 Products and Services
14.8.4 Financial Overview
14.8.5 SWOT Analysis
14.8.6 Key Developments
14.9 Univance Corp
14.9.1 Key Facts
14.9.2 Business Description
14.9.3 Products and Services
14.9.4 Financial Overview
14.9.5 SWOT Analysis
14.9.6 Key Developments
14.10 The Adams Co
14.10.1 Key Facts
14.10.2 Business Description
14.10.3 Products and Services
14.10.4 Financial Overview
14.10.5 SWOT Analysis
14.10.6 Key Developments
15. Appendix
15.1 About US
15.2 Glossary of Terms
List of Tables
Table 1. Automotive Gears Market Segmentation
Table 2. Steel and Aluminium Suppliers in North America
Table 3. List of Vendors
Table 4. Automotive Gears Market Revenue And Forecasts To 2030 (US$ Mn)
Table 5. North America Automotive Gears Market Revenue And Forecasts To 2030 (US$ Mn) – Product type
Table 6. North America Automotive Gears Market Revenue And Forecasts To 2030 (US$ Mn) – Material Type
Table 7. North America: Automotive Gears Market, by Application Revenue and Forecast to 2030 (US$ Million)
Table 8. North America Automotive Gears Market Revenue And Forecasts To 2030 (US$ Mn) – Country
Table 9. United States Automotive Gears Market Revenue And Forecasts To 2030 (US$ Mn) – Product type
Table 10. United States Automotive Gears Market Revenue And Forecasts To 2030 (US$ Mn) – Material type
Table 11. United States Automotive Gears Market Revenue And Forecasts To 2030 (US$ Mn) – Application
Table 12. Canada Automotive Gears Market Revenue And Forecasts To 2030 (US$ Mn) – Product type
Table 13. Canada Automotive Gears Market Revenue And Forecasts To 2030 (US$ Mn) – Material type
Table 14. Canada Automotive Gears Market Revenue And Forecasts To 2030 (US$ Mn) – Application
Table 15. Mexico Automotive Gears Market Revenue And Forecasts To 2030 (US$ Mn) – Product type
Table 16. Mexico Automotive Gears Market Revenue And Forecasts To 2030 (US$ Mn) – Material type
Table 17. Mexico Automotive Gears Market Revenue And Forecasts To 2030 (US$ Mn) – Application
Table 18. Glossary of Terms, Automotive Gears Market
List of Figures
Figure 1. Automotive Gears Market Segmentation, by Region
Figure 2. Automotive Gears Market - PEST Analysis
Figure 3. Automotive Gears Market - Key Industry Dynamics
Figure 4. Impact Analysis of Drivers And Restraints
Figure 5. Automotive Gears Market Revenue (US$ Mn), 2020 – 2030
Figure 6. Automotive Gears Market Share (%) – Product type, (2022 and 2030)
Figure 7. Spur gears: North America Automotive Gears Market Revenue and Forecast to 2030 (US$ Million)
Figure 8. Bevel gears: North America Automotive Gears Market Revenue and Forecast to 2030 (US$ Million)
Figure 9. Helical gears: North America Automotive Gears Market Revenue and Forecast to 2030 (US$ Million)
Figure 10. Worm Gears: North America Automotive Gears Market Revenue and Forecast to 2030 (US$ Million)
Figure 11. Planetary Gears Market Revenue And Forecasts To 2030 (US$ Mn)
Figure 12. Rack & Pinion Gears Market Revenue And Forecasts To 2030 (US$ Mn)
Figure 13. Hypoid Gears Market Revenue And Forecasts To 2030 (US$ Mn)
Figure 14. Others Market Revenue And Forecasts To 2030 (US$ Mn)
Figure 15. North America Automotive Gears Market Revenue Share, by Application (2022 and 2030)
Figure 16. Metallic Gears: North America Automotive Gears Market Revenue and Forecast to 2030 (US$ Million)
Figure 17. Non-metallic Gears: North America Automotive Gears Market Revenue and Forecast to 2030 (US$ Million)
Figure 18. North America Automotive Gears Market Revenue Share, by Application (2022 and 2030)
Figure 19. Transmission System: North America Automotive Gears Market Revenue and Forecast to 2030 (US$ Million)
Figure 20. Steering System: North America Automotive Gears Market Revenue and Forecast to 2030 (US$ Million)
Figure 21. Differential System: North America Automotive Gears Market Revenue and Forecast to 2030 (US$ Million)
Figure 22. Others: North America Automotive Gears Market Revenue and Forecast to 2030 (US$ Million)
Figure 23. Automotive Gears Market Breakdown by Regional Analysis, 2022 And 2030 (%)
Figure 24. North America Automotive Gears Market Revenue And Forecasts To 2030 (US$ Mn)
Figure 25. North America Automotive Gears Market Revenue Share, by Product type (2022 and 2030)
Figure 26. North America Automotive Gears Market Revenue Share, by Material Type (2022 and 2030)
Figure 27. North America Automotive Gears Market Revenue Share, by Application (2022 and 2030)
Figure 28. North America Automotive Gears Market Breakdown by Key Countries, 2022 And 2030 (%)
Figure 29. United States Automotive Gears Market Revenue And Forecasts To 2030 (US$ Mn)
Figure 30. Canada Automotive Gears Market Revenue And Forecasts To 2030 (US$ Mn)
Figure 31. Mexico Automotive Gears Market Revenue And Forecasts To 2030 (US$ Mn)
Figure 32. Company Positioning & Concentration
The List of Companies - North America Automotive Gears Market
- Symmco Inc
- JTEKT Corp
- American Axle & Manufacturing Inc
- ThyssenKrupp AG
- Dana Inc
- Gear Motions Inc
- GKN Automotive Ltd
- AmTech International Inc
- Univance Corp
- The Adams Co
The Insight Partners performs research in 4 major stages: Data Collection & Secondary Research, Primary Research, Data Analysis and Data Triangulation & Final Review.
- Data Collection and Secondary Research:
As a market research and consulting firm operating from a decade, we have published many reports and advised several clients across the globe. First step for any study will start with an assessment of currently available data and insights from existing reports. Further, historical and current market information is collected from Investor Presentations, Annual Reports, SEC Filings, etc., and other information related to company’s performance and market positioning are gathered from Paid Databases (Factiva, Hoovers, and Reuters) and various other publications available in public domain.
Several associations trade associates, technical forums, institutes, societies and organizations are accessed to gain technical as well as market related insights through their publications such as research papers, blogs and press releases related to the studies are referred to get cues about the market. Further, white papers, journals, magazines, and other news articles published in the last 3 years are scrutinized and analyzed to understand the current market trends.
- Primary Research:
The primarily interview analysis comprise of data obtained from industry participants interview and answers to survey questions gathered by in-house primary team.
For primary research, interviews are conducted with industry experts/CEOs/Marketing Managers/Sales Managers/VPs/Subject Matter Experts from both demand and supply side to get a 360-degree view of the market. The primary team conducts several interviews based on the complexity of the markets to understand the various market trends and dynamics which makes research more credible and precise.
A typical research interview fulfils the following functions:
- Provides first-hand information on the market size, market trends, growth trends, competitive landscape, and outlook
- Validates and strengthens in-house secondary research findings
- Develops the analysis team’s expertise and market understanding
Primary research involves email interactions and telephone interviews for each market, category, segment, and sub-segment across geographies. The participants who typically take part in such a process include, but are not limited to:
- Industry participants: VPs, business development managers, market intelligence managers and national sales managers
- Outside experts: Valuation experts, research analysts and key opinion leaders specializing in the electronics and semiconductor industry.
Below is the breakup of our primary respondents by company, designation, and region:

Once we receive the confirmation from primary research sources or primary respondents, we finalize the base year market estimation and forecast the data as per the macroeconomic and microeconomic factors assessed during data collection.
- Data Analysis:
Once data is validated through both secondary as well as primary respondents, we finalize the market estimations by hypothesis formulation and factor analysis at regional and country level.
- 3.1 Macro-Economic Factor Analysis:
We analyse macroeconomic indicators such the gross domestic product (GDP), increase in the demand for goods and services across industries, technological advancement, regional economic growth, governmental policies, the influence of COVID-19, PEST analysis, and other aspects. This analysis aids in setting benchmarks for various nations/regions and approximating market splits. Additionally, the general trend of the aforementioned components aid in determining the market's development possibilities.
- 3.2 Country Level Data:
Various factors that are especially aligned to the country are taken into account to determine the market size for a certain area and country, including the presence of vendors, such as headquarters and offices, the country's GDP, demand patterns, and industry growth. To comprehend the market dynamics for the nation, a number of growth variables, inhibitors, application areas, and current market trends are researched. The aforementioned elements aid in determining the country's overall market's growth potential.
- 3.3 Company Profile:
The “Table of Contents” is formulated by listing and analyzing more than 25 - 30 companies operating in the market ecosystem across geographies. However, we profile only 10 companies as a standard practice in our syndicate reports. These 10 companies comprise leading, emerging, and regional players. Nonetheless, our analysis is not restricted to the 10 listed companies, we also analyze other companies present in the market to develop a holistic view and understand the prevailing trends. The “Company Profiles” section in the report covers key facts, business description, products & services, financial information, SWOT analysis, and key developments. The financial information presented is extracted from the annual reports and official documents of the publicly listed companies. Upon collecting the information for the sections of respective companies, we verify them via various primary sources and then compile the data in respective company profiles. The company level information helps us in deriving the base number as well as in forecasting the market size.
- 3.4 Developing Base Number:
Aggregation of sales statistics (2020-2022) and macro-economic factor, and other secondary and primary research insights are utilized to arrive at base number and related market shares for 2022. The data gaps are identified in this step and relevant market data is analyzed, collected from paid primary interviews or databases. On finalizing the base year market size, forecasts are developed on the basis of macro-economic, industry and market growth factors and company level analysis.
- Data Triangulation and Final Review:
The market findings and base year market size calculations are validated from supply as well as demand side. Demand side validations are based on macro-economic factor analysis and benchmarks for respective regions and countries. In case of supply side validations, revenues of major companies are estimated (in case not available) based on industry benchmark, approximate number of employees, product portfolio, and primary interviews revenues are gathered. Further revenue from target product/service segment is assessed to avoid overshooting of market statistics. In case of heavy deviations between supply and demand side values, all thes steps are repeated to achieve synchronization.
We follow an iterative model, wherein we share our research findings with Subject Matter Experts (SME’s) and Key Opinion Leaders (KOLs) until consensus view of the market is not formulated – this model negates any drastic deviation in the opinions of experts. Only validated and universally acceptable research findings are quoted in our reports.
We have important check points that we use to validate our research findings – which we call – data triangulation, where we validate the information, we generate from secondary sources with primary interviews and then we re-validate with our internal data bases and Subject matter experts. This comprehensive model enables us to deliver high quality, reliable data in shortest possible time.
Trends and growth analysis reports related to North America Automotive Gears Market

Oct 2023
Heavy Commercial Vehicle Air Brake Systems Market
Size and Forecast (2021 - 2031), Global and Regional Share, Trend, and Growth Opportunity Analysis Report Coverage: By Component (Compressor, Reservoir, Foot Valve, Brake Lining and Drum or Rotors, Brake Shoes, and Others), Type (Air Disc Brake and Air Drum Brake), Technology (Conventional Air Brake System, Electronically Controlled Air Braking System, and Antilock Braking System), Distribution Channel (OEMs and Aftermarket), Vehicle Type (Bus, Truck, Construction Equipment, and Tractor), and Geography
Oct 2023
Heavy Commercial Vehicle Clutch Market
Size and Forecast (2021 - 2031), Global and Regional Share, Trend, and Growth Opportunity Analysis Report Coverage: By Distribution Channel (OEM and Aftermarket), Product (Single Plate Clutches, Multi-Plate Clutches, Diaphragm Spring Clutches, Centrifugal Clutches, and Hydraulic Clutches), Vehicle Type (Bus, Truck, Construction Equipment, and Tractors), and Geography
Oct 2023
Electric Vehicle Heat Pump Systems Market
Size and Forecast (2021 - 2031), Global and Regional Share, Trend, and Growth Opportunity Analysis Report Coverage: By Propulsion Type (BEV, HEV, PHEV), Component (Evaporator, Condenser, Compressors, Others), Vehicle Type (Passenger Vehicle, Commercial Vehicle), and Geography
Oct 2023
Hydrogen Fuel Cell Train Market
Size and Forecast (2020–2030), Global and Regional Share, Trend, and Growth Opportunity Analysis Report Coverage: By Technology (Proton Exchange Membrane Fuel Cell, Phosphoric Acid Fuel Cell, and Others), Component (Hydrogen Fuel Cell Pack, Batteries, Electric Traction Motors, and Others), Rail Type (Passenger Rail, Commuter Rail, Light Rail, Trams, Freight, and Others) and Geography
Oct 2023
Automotive Seat Market
Size and Forecast (2020–2030), Global and Regional Share, Trend, and Growth Opportunity Analysis Report Coverage: By Technology (Heated, Heated-Ventilated, Ventilated, With Massage Functions, and Others), Adjustment Type (Electrically Adjusted and Manual), Vehicle Type (Passenger Vehicle, Light Commercial Vehicle, and Heavy Commercial Vehicle), and Seat Type (Front Row, Second Row, and Third Row) and Geography
Oct 2023
Connected Vehicle Market
Size and Forecasts (2020 - 2030), Global and Regional Share, Trends, and Growth Opportunity Analysis By Technology (5G, 4G/LTE, 3G & 2G), Connectivity (Integrated, Tethered, Embedded), Application (Telematics, Infotainment, Driving assistance, Others) and Geography
Oct 2023
Automotive High Voltage Cable Market
Forecast to 2030 - Global Analysis by Vehicle Type [Battery Electric Vehicles (BEV), Plugin Hybrid Electric Vehicles (PHEV), and Plugin Hybrid Vehicles (PHV)], Conductor Type (Copper and Aluminum), and Core Type (Multi Core and Single Core)
 Get Free Sample For