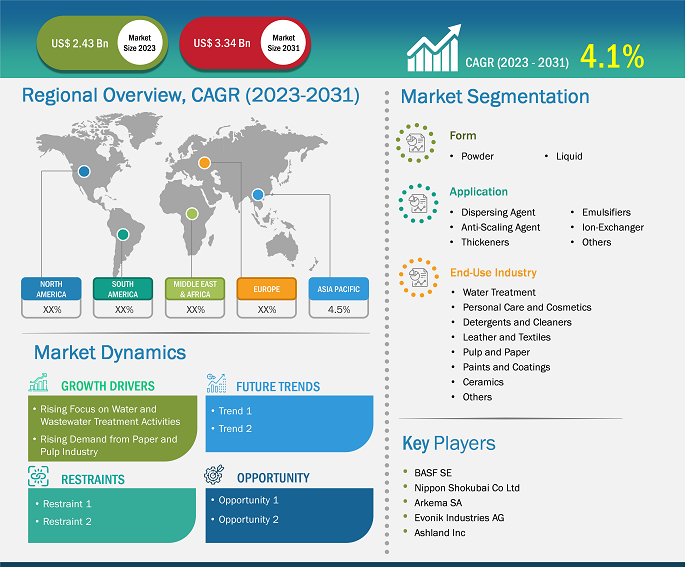
The polyacrylic acid market was valued at US$ 2.43 billion in 2023 and is expected to reach US$ 3.34 billion by 2031; it is estimated to register a CAGR of 4.1% from 2023 to 2031.
Market Insights and Analyst View:
Polyacrylic acid is a synthetic, high-molecular-weight, and water-soluble polyelectrolyte. Polyacrylic acid is made by polymerizing acrylic acid. The polymerization is carried out in a solvent, such as water or mixtures of water and isopropanol. Market players offer polyacrylic acid in powder and liquid forms. The global polyacrylic acid market is highly competitive. Polyacrylic acid is used in various end-use industries such as water treatment, personal care & cosmetics, detergents & cleaners, leather & textiles, pulp & paper, paints & coatings, and ceramics. It is a versatile synthetic polymer with various industrial applications, including water treatment, personal care products, textiles, adhesives, paints and coatings, and pulp and paper. Further, the adoption of polyacrylic acids in the detergents & cleaners industry is expected to offer lucrative opportunities for the polyacrylic acid market growth during the forecast period.
Growth Drivers and Challenges:
The rising focus on water and wastewater treatment activities and upsurging demand from the pulp & paper industry contribute to the growing polyacrylic acid market size. Many European countries are progressing toward wastewater treatment targets and the protection of sensitive water systems. Data published by the European Environment Agency (EEA) in 2021 shows that ~90% of urban wastewater is collected and treated in accordance with the EU Waste Water Treatment Directive across the EU. Country analysis based on the implementation of EU rules on wastewater treatment shows that the EU member states are significantly applying the rules, and the compliance rate slightly increased between 2016 and 2018. The global paper & pulp industry is growing due to factors such as the expanding e-commerce sector, increasing demand for paper packaging products, and rising demand for eco-friendly packaging products. Countries in Europe, Asia, and North America such as the US, China, Germany, Japan, Finland, and Canada are major pulp and paper producers across the world. In Europe, paper production is concentrated in the northern European countries, including Finland, Russia, and Sweden. The expansion of the water treatment and pulp & paper industries drives the polyacrylic acid market growth.
The volatility in raw material prices can act as a deterrent for the polyacrylic acid market. Supply and demand gaps, natural disasters, political instability, currency fluctuations, and other factors can fluctuate raw materials’ prices. The volatility in raw material prices makes it difficult for manufacturers to plan and budget for their operations. Polyacrylic acid is of fossil origin. Acrylic acid is a major raw material in the production of polyacrylic acid. One of the major reasons impacting propylene prices is the global economic landscape. The propylene market is closely tied to the oil & gas industry, as propylene is mainly derived from the refining of crude oil or the cracking of natural gas liquids. Price hikes in petroleum products and other raw materials can restrain the profit margins on the products, posing a challenge to the market growth.
Customize Research To Suit Your Requirement
We can optimize and tailor the analysis and scope which is unmet through our standard offerings. This flexibility will help you gain the exact information needed for your business planning and decision making.
Polyacrylic Acid Market: Strategic Insights
Market Size Value in US$ 2.43 billion in 2023 Market Size Value by US$ 3.34 billion by 2031 Growth rate CAGR of 4.1% from 2023 to 2031 Forecast Period 2023-2031 Base Year 2023

Shejal
Have a question?
Shejal will walk you through a 15-minute call to present the report’s content and answer all queries if you have any.
 Speak to Analyst
Customize Research To Suit Your Requirement
We can optimize and tailor the analysis and scope which is unmet through our standard offerings. This flexibility will help you gain the exact information needed for your business planning and decision making.
Polyacrylic Acid Market: Strategic Insights
| Market Size Value in | US$ 2.43 billion in 2023 |
| Market Size Value by | US$ 3.34 billion by 2031 |
| Growth rate | CAGR of 4.1% from 2023 to 2031 |
| Forecast Period | 2023-2031 |
| Base Year | 2023 |
Shejal
Have a question?
Shejal will walk you through a 15-minute call to present the report’s content and answer all queries if you have any.
Speak to Analyst
Report Segmentation and Scope:
The "Global Polyacrylic Acid Market Analysis and Forecast to 2031" is a specialized and in-depth study with a significant focus on global market trends and growth opportunities. The report aims to provide an overview of the market with detailed market segmentation by form, application, and end-use industry. The market has witnessed high growth in the recent past and is expected to continue this trend during the forecast period. The report provides key statistics on the consumption of polyacrylic acids globally. In addition, the global polyacrylic acid market report provides a qualitative assessment of various factors affecting the market performance globally. The report also includes a comprehensive analysis of the leading players in the market and their key strategic developments. Several analyses were conducted to identify the key driving factors, polyacrylic acid market trends, and lucrative opportunities that would, in turn, aid in identifying the major revenue pockets.
The polyacrylic acid market forecast is estimated on the basis of various secondary and primary research findings, such as key company publications, association data, and databases. Further, the ecosystem analysis and Porter's five forces analysis provide a 360-degree view of the market, which helps understand the entire supply chain and various factors affecting the market performance.
Segmental Analysis:
The global polyacrylic acid market is segmented on the basis of form, application, and end-use industry. Based on form, the market is bifurcated into powder and liquid. The liquid segment accounted for a significant polyacrylic acid market share in 2023. Handling liquid PAA solutions reduces the risk of dust exposure compared to powdered counterparts. Liquid readily mixes with water and other solvents, allowing quick and efficient solution preparation with precise concentration. Liquid solution is less prone to agglomeration or clumping than powder form, ensuring consistent product performance. However, powder is easier to handle and transport compared to liquid solutions. It has a long shelf life and is less prone to spillage or leakage during storage and transportation. PAA powder can be easily dissolved in water to form solutions with desired concentrations, offering versatility in applications across various industries such as water treatment, personal care, and textiles.
Based on application, the market is segmented into dispersing agents, anti-scaling agents, thickeners, emulsifiers, ion-exchanger, and others. The anti-scaling agent segment held a substantial polyacrylic acid market share in 2023. PAA inhibits the deposition of insoluble mineral salts onto a surface, thereby making it a significant chemical in water treatment, preventing deposit formation in various oil and gas applications and industrial cleaning. PAA is widely used in water treatment to prevent scale formation in water cooling systems, boilers, and reverse osmosis membranes. It is a cost-effective, environment-friendly solution to prevent and mitigate mineral scale formation.
Based on end-use industry, the polyacrylic acid market is segmented into water treatment, personal care and cosmetics, detergents and cleaners, leather and textiles, pulp and paper, paints and coatings, ceramics, and others. The water treatment segment accounted for a significant market share in 2023. PAA finds application as a clarifying agent, dispersing agent, and anti-scaling agent in membrane-based water treatment processes such as reverse osmosis and ultra-filtration. It aids in preventing membrane fouling and scaling by inhibiting the precipitation of sparingly soluble salts on membrane surfaces. In the past few years, several efforts have been made to study the utilization of PAA to eliminate undesirable compounds from water.
Regional Analysis:
The report provides a detailed overview of the market with respect to five major regions—North America, Europe, Asia Pacific (APAC), the Middle East & Africa (MEA), and South & Central America. In terms of revenue, Asia Pacific dominated the polyacrylic acid market and was valued at more than US$ 850 million in 2023. The Asia Pacific market, by country, is segmented into Australia, China, India, Japan, South Korea, and the Rest of Asia Pacific. The demand for polyacrylic acid has been steadily increasing in the region as it is one of the most rapidly growing markets driven by significant industrialization and urbanization trends. The rise in demand can be attributed to its versatile applications across various industries, including personal care, paints & coatings, textile processing, and water treatment. All these factors boost the polyacrylic acid market in Asia Pacific.
The Europe polyacrylic acid market is expected to reach ~US$ 750 million by 2031. According to a report published by the Confederation of European Paper Industries in February 2024, the total production of pulp generated a total output of ~33 million tons, of which chemical pulp accounted for 79% of total pulp production in 2023. Polyacrylic acid copolymers are used as additives for surface sizing of linerboard and paper boards. Further, acrylic acid polymers and copolymers are used as hydrosoluble agents for dispersing agents, thickeners, flocculating agents, and copolymer emulsions for paints and papers.
Polyacrylic Acid Market Report Scope
Industry Developments and Future Opportunities:
Following are a few recent developments by major companies in the polyacrylic acid market, as per company press releases:
- In 2023, BASF SE announced the opening of the production complex at its Verbund site in Zhanjiang, China. The complex includes the production facility for butyl acrylate (BA), glacial acrylic acid (GAA), and 2-ethylhexyl acrylate (2-EHA). The company revealed its plan to stream by 2025, and the complex will have an annual production capacity of ∼400,000 metric tons of BA and 100,000 metric tons of 2-EHA.
In 2023, Nippon Shokubai Co Ltd inaugurated the acrylic acid facility with a production capacity of 100,000 MT/year in Cilegon, Banten, Indonesia. The total investment of the project is reported to be ∼US$ 200 million.
Competitive Landscape and Key Companies:
Arkema SA, Ashland Inc, BASF SE, Evonik Industries AG, Nippon Shokubai Co Ltd, Sumitomo Seika Chemicals Co Ltd, The Dow Chemical Co, The Lubrizol Corp, Shandong ThFine Chemical Co Ltd, and Glentham Life Sciences Limited are among the key players profiled in the polyacrylic acid market report. The global market players focus on providing high-quality products to fulfill customer demand.

Report Coverage
Revenue forecast, Company Analysis, Industry landscape, Growth factors, and Trends

Segment Covered
Form, Application, and End-Use Industry

Regional Scope
North America, Europe, Asia Pacific, Middle East & Africa, South & Central America

Country Scope
This text is related
to country scope.
Frequently Asked Questions
Arkema SA, Ashland Inc, BASF SE, Evonik Industries AG, Nippon Shokubai Co Ltd, Sumitomo Seika Chemicals Co Ltd, The Dow Chemical Co, The Lubrizol Corp, Shandong ThFine Chemical Co Ltd, and Glentham Life Sciences Limited are among the key players profiled in the polyacrylic acid market report.
In 2023, Asia Pacific held the largest share of the global polyacrylic acid market. The demand for polyacrylic acid has been steadily increasing in Asia Pacific as it is one of the most rapidly growing markets driven by significant industrialization and urbanization trends.
The liquid segment held the largest share in the global polyacrylic acid market in 2023. Liquid PAA solutions are homogeneous, ensuring consistent performance and application across different batches and conditions.
The polyacrylic acid market growth is attributed to the rising focus on water and wastewater treatment activities and the rising demand from the paper & pulp industry.
Asia Pacific is estimated to register the fastest CAGR in the global polyacrylic acid market over the forecast period. The increasing emphasis on environmental protection and stringent regulations concerning wastewater treatment has led to a rise in demand for polyacrylic acid-based flocculants and coagulants in the water treatment sector in Asia Pacific.
The anti-scaling agent segment held the largest share of the global polyacrylic acid market in 2023. PAA is widely used in water treatment to prevent scale formation in water cooling systems, boilers, and reverse osmosis membranes.
1. Introduction
1.1 The Insight Partners Research Report Guidance
1.2 Market Segmentation
2. Executive Summary
2.1 Key Insights
2.2 Market Attractiveness
3. Research Methodology
3.1 Coverage
3.2 Secondary Research
3.2.1 Hypothesis Formulation:
3.2.2 Macro-Economic Factor Analysis:
3.2.3 Developing Base Number:
3.2.4 Data Triangulation:
3.2.5 Country Level Data:
3.3 Primary Research
4. Polyacrylic Acid Market Landscape
4.1 Overview
4.2 Porters Five Forces Analysis
4.2.1 Bargaining Power of Suppliers
4.2.2 Bargaining Power of Buyers
4.2.3 Threat of New Entrants
4.2.4 Intensity of Competitive Rivalry
4.2.5 Threat of Substitutes
4.3 Ecosystem Analysis
4.3.1 List of Vendors in the Value Chain
5. Global Polyacrylic Acid Market – Key Market Dynamics
5.1 Global Polyacrylic Acid Market – Key Market Dynamics
5.2 Market Drivers
5.2.1 Rising Focus on Water and Wastewater Treatment Activities
5.2.2 Rising Demand from Paper & Pulp Industry
5.3 Market Restraints
5.3.1 Fluctuation in Prices of Raw Materials
5.4 Market Opportunities
5.4.1 Increasing Demand for Polyacrylic Acid from Detergent and Cleaner Applications
5.5 Future Trends
5.5.1 Development of Bio-Based and Sustainable Products
5.6 Impact of Drivers and Restraints:
6. Global Polyacrylic Acid Market – Global Market Analysis
6.1 Global Polyacrylic Acid Market Volume (Kilo Tons), 2023–2031
6.2 Global Polyacrylic Acid Market Volume Forecast and Analysis (Kilo Tons)
6.3 Global Polyacrylic Acid Market Revenue (US$ Million), 2023–2031
6.4 Global Polyacrylic Acid Market Forecast and Analysis
7. Global Polyacrylic Acid Market Volume and Revenue Analysis – by Form
7.1 Powder
7.1.1 Overview
7.1.2 Powder: Polyacrylic Acid Market – Volume and Forecast to 2031 (Kilo Tons)
7.1.3 Powder: Polyacrylic Acid Market – Revenue and Forecast to 2031 (US$ Million)
7.2 Liquid
7.2.1 Overview
7.2.2 Liquid: Polyacrylic Acid Market – Volume and Forecast to 2031 (Kilo Tons)
7.2.3 Liquid: Polyacrylic Acid Market – Revenue and Forecast to 2031 (US$ Million)
8. Global Polyacrylic Acid Market Revenue Analysis – by Application
8.1 Dispersing Agent
8.1.1 Overview
8.1.2 Dispersing Agent: Polyacrylic Acid Market – Revenue and Forecast to 2031 (US$ Million)
8.2 Anti-Scaling Agent
8.2.1 Overview
8.2.2 Anti-Scaling Agent: Polyacrylic Acid Market – Revenue and Forecast to 2031 (US$ Million)
8.3 Thickeners
8.3.1 Overview
8.3.2 Thickeners: Polyacrylic Acid Market – Revenue and Forecast to 2031 (US$ Million)
8.4 Emulsifiers
8.4.1 Overview
8.4.2 Emulsifiers: Polyacrylic Acid Market – Revenue and Forecast to 2031 (US$ Million)
8.5 Ion-Exchanger
8.5.1 Overview
8.5.2 Ion-Exchanger: Polyacrylic Acid Market – Revenue and Forecast to 2031 (US$ Million)
8.6 Others
8.6.1 Overview
8.6.2 Others: Polyacrylic Acid Market – Revenue and Forecast to 2031 (US$ Million)
9. Global Polyacrylic Acid Market Revenue Analysis – by End-Use Industry
9.1 Water Treatment
9.1.1 Overview
9.1.2 Water Treatment: Polyacrylic Acid Market – Revenue and Forecast to 2031 (US$ Million)
9.2 Personal Care and Cosmetics
9.2.1 Overview
9.2.2 Personal Care and Cosmetics: Polyacrylic Acid Market – Revenue and Forecast to 2031 (US$ Million)
9.3 Detergents and Cleaners
9.3.1 Overview
9.3.2 Detergents and Cleaners: Polyacrylic Acid Market – Revenue and Forecast to 2031 (US$ Million)
9.4 Leather and Textiles
9.4.1 Overview
9.4.2 Leather and Textiles: Polyacrylic Acid Market – Revenue and Forecast to 2031 (US$ Million)
9.5 Pulp and Paper
9.5.1 Overview
9.5.2 Pulp and Paper: Polyacrylic Acid Market – Revenue and Forecast to 2031 (US$ Million)
9.6 Paints and Coatings
9.6.1 Overview
9.6.2 Paints and Coatings: Polyacrylic Acid Market – Revenue and Forecast to 2031 (US$ Million)
9.7 Ceramics
9.7.1 Overview
9.7.2 Ceramics: Polyacrylic Acid Market – Revenue and Forecast to 2031 (US$ Million)
9.8 Others
9.8.1 Overview
9.8.2 Others: Polyacrylic Acid Market – Revenue and Forecast to 2031 (US$ Million)
10. Global Polyacrylic Acid Market – Geographical Analysis
10.1 Overview
10.2 North America
10.2.1 North America Polyacrylic Acid Market Overview
10.2.2 North America Polyacrylic Acid Market – Revenue and Forecast to 2031 (US$ Million)
10.2.3 North America Polyacrylic Acid Market Breakdown by Form
10.2.3.1 North America Polyacrylic Acid Market Volume and Forecast and Analysis – by Form
10.2.3.2 North America Polyacrylic Acid Market Revenue and Forecast and Analysis –by Form
10.2.4 North America Polyacrylic Acid Market Breakdown by Application
10.2.4.1 North America Polyacrylic Acid Market Revenue and Forecast and Analysis –by Application
10.2.5 North America Polyacrylic Acid Market Breakdown by End-Use Industry
10.2.5.1 North America Polyacrylic Acid Market Revenue and Forecast and Analysis –by End-Use Industry
10.2.6 North America Polyacrylic Acid Market Revenue and Forecast and Analysis – by Country
10.2.6.1 North America Polyacrylic Acid Market Volume and Forecast and Analysis – by Country
10.2.6.2 North America Polyacrylic Acid Market Revenue and Forecast and Analysis –by Country
10.2.6.3 United States Polyacrylic Acid Market – Revenue and Forecast to 2031 (US$ Million)
10.2.6.3.1 United States Polyacrylic Acid Market Breakdown by Form
10.2.6.3.2 United States Polyacrylic Acid Market Breakdown by Application
10.2.6.3.3 United States Polyacrylic Acid Market Breakdown by End-Use Industry
10.2.6.4 Canada Polyacrylic Acid Market – Revenue and Forecast to 2031 (US$ Million)
10.2.6.4.1 Canada Polyacrylic Acid Market Breakdown by Form
10.2.6.4.2 Canada Polyacrylic Acid Market Breakdown by Application
10.2.6.4.3 Canada Polyacrylic Acid Market Breakdown by End-Use Industry
10.2.6.5 Mexico Polyacrylic Acid Market – Revenue and Forecast to 2031 (US$ Million)
10.2.6.5.1 Mexico Polyacrylic Acid Market Breakdown by Form
10.2.6.5.2 Mexico Polyacrylic Acid Market Breakdown by Application
10.2.6.5.3 Mexico Polyacrylic Acid Market Breakdown by End-Use Industry
10.3 Europe
10.3.1 Europe Polyacrylic Acid Market Overview
10.3.2 Europe Polyacrylic Acid Market – Revenue and Forecast to 2031 (US$ Million)
10.3.3 Europe Polyacrylic Acid Market Breakdown by Form
10.3.3.1 Europe Polyacrylic Acid Market Volume and Forecast and Analysis – by Form
10.3.3.2 Europe Polyacrylic Acid Market Revenue and Forecast and Analysis –by Form
10.3.4 Europe Polyacrylic Acid Market Breakdown by Application
10.3.4.1 Europe Polyacrylic Acid Market Revenue and Forecast and Analysis –by Application
10.3.5 Europe Polyacrylic Acid Market Breakdown by End-Use Industry
10.3.5.1 Europe Polyacrylic Acid Market Revenue and Forecast and Analysis –by End-Use Industry
10.3.6 Europe Polyacrylic Acid Market Revenue and Forecast and Analysis – by Country
10.3.6.1 Europe Polyacrylic Acid Market Volume and Forecast and Analysis – by Country
10.3.6.2 Europe Polyacrylic Acid Market Revenue and Forecast and Analysis –by Country
10.3.6.3 Germany Polyacrylic Acid Market – Revenue and Forecast to 2031 (US$ Million)
10.3.6.3.1 Germany Polyacrylic Acid Market Breakdown by Form
10.3.6.3.2 Germany Polyacrylic Acid Market Breakdown by Application
10.3.6.3.3 Germany Polyacrylic Acid Market Breakdown by End-Use Industry
10.3.6.4 France Polyacrylic Acid Market – Revenue and Forecast to 2031 (US$ Million)
10.3.6.4.1 France Polyacrylic Acid Market Breakdown by Form
10.3.6.4.2 France Polyacrylic Acid Market Breakdown by Application
10.3.6.4.3 France Polyacrylic Acid Market Breakdown by End-Use Industry
10.3.6.5 Italy Polyacrylic Acid Market – Revenue and Forecast to 2031 (US$ Million)
10.3.6.5.1 Italy Polyacrylic Acid Market Breakdown by Form
10.3.6.5.2 Italy Polyacrylic Acid Market Breakdown by Application
10.3.6.5.3 Italy Polyacrylic Acid Market Breakdown by End-Use Industry
10.3.6.6 United Kingdom Polyacrylic Acid Market – Revenue and Forecast to 2031 (US$ Million)
10.3.6.6.1 United Kingdom Polyacrylic Acid Market Breakdown by Form
10.3.6.6.2 United Kingdom Polyacrylic Acid Market Breakdown by Application
10.3.6.6.3 United Kingdom Polyacrylic Acid Market Breakdown by End-Use Industry
10.3.6.7 Russia Polyacrylic Acid Market – Revenue and Forecast to 2031 (US$ Million)
10.3.6.7.1 Russia Polyacrylic Acid Market Breakdown by Form
10.3.6.7.2 Russia Polyacrylic Acid Market Breakdown by Application
10.3.6.7.3 Russia Polyacrylic Acid Market Breakdown by End-Use Industry
10.3.6.8 Rest of Europe Polyacrylic Acid Market – Revenue and Forecast to 2031 (US$ Million)
10.3.6.8.1 Rest of Europe Polyacrylic Acid Market Breakdown by Form
10.3.6.8.2 Rest of Europe Polyacrylic Acid Market Breakdown by Application
10.3.6.8.3 Rest of Europe Polyacrylic Acid Market Breakdown by End-Use Industry
10.4 Asia Pacific
10.4.1 Asia Pacific Polyacrylic Acid Market Overview
10.4.2 Asia Pacific Polyacrylic Acid Market – Revenue and Forecast to 2031 (US$ Million)
10.4.3 Asia Pacific Polyacrylic Acid Market Breakdown by Form
10.4.3.1 Asia Pacific Polyacrylic Acid Market Volume and Forecast and Analysis – by Form
10.4.3.2 Asia Pacific Polyacrylic Acid Market Revenue and Forecast and Analysis –by Form
10.4.4 Asia Pacific Polyacrylic Acid Market Breakdown by Application
10.4.4.1 Asia Pacific Polyacrylic Acid Market Revenue and Forecast and Analysis –by Application
10.4.5 Asia Pacific Polyacrylic Acid Market Breakdown by End-Use Industry
10.4.5.1 Asia Pacific Polyacrylic Acid Market Revenue and Forecast and Analysis –by End-Use Industry
10.4.6 Asia Pacific Polyacrylic Acid Market Revenue and Forecast and Analysis – by Country
10.4.6.1 Asia Pacific Polyacrylic Acid Market Volume and Forecast and Analysis – by Country
10.4.6.2 Asia Pacific Polyacrylic Acid Market Revenue and Forecast and Analysis –by Country
10.4.6.3 Australia Polyacrylic Acid Market – Revenue and Forecast to 2031 (US$ Million)
10.4.6.3.1 Australia Polyacrylic Acid Market Breakdown by Form
10.4.6.3.2 Australia Polyacrylic Acid Market Breakdown by Application
10.4.6.3.3 Australia Polyacrylic Acid Market Breakdown by End-Use Industry
10.4.6.4 China Polyacrylic Acid Market – Revenue and Forecast to 2031 (US$ Million)
10.4.6.4.1 China Polyacrylic Acid Market Breakdown by Form
10.4.6.4.2 China Polyacrylic Acid Market Breakdown by Application
10.4.6.4.3 China Polyacrylic Acid Market Breakdown by End-Use Industry
10.4.6.5 India Polyacrylic Acid Market – Revenue and Forecast to 2031 (US$ Million)
10.4.6.5.1 India Polyacrylic Acid Market Breakdown by Form
10.4.6.5.2 India Polyacrylic Acid Market Breakdown by Application
10.4.6.5.3 India Polyacrylic Acid Market Breakdown by End-Use Industry
10.4.6.6 Japan Polyacrylic Acid Market – Revenue and Forecast to 2031 (US$ Million)
10.4.6.6.1 Japan Polyacrylic Acid Market Breakdown by Form
10.4.6.6.2 Japan Polyacrylic Acid Market Breakdown by Application
10.4.6.6.3 Japan Polyacrylic Acid Market Breakdown by End-Use Industry
10.4.6.7 South Korea Polyacrylic Acid Market – Revenue and Forecast to 2031 (US$ Million)
10.4.6.7.1 South Korea Polyacrylic Acid Market Breakdown by Form
10.4.6.7.2 South Korea Polyacrylic Acid Market Breakdown by Application
10.4.6.7.3 South Korea Polyacrylic Acid Market Breakdown by End-Use Industry
10.4.6.8 Rest of APAC Polyacrylic Acid Market – Revenue and Forecast to 2031 (US$ Million)
10.4.6.8.1 Rest of APAC Polyacrylic Acid Market Breakdown by Form
10.4.6.8.2 Rest of APAC Polyacrylic Acid Market Breakdown by Application
10.4.6.8.3 Rest of APAC Polyacrylic Acid Market Breakdown by End-Use Industry
10.5 Middle East and Africa
10.5.1 Middle East and Africa Polyacrylic Acid Market Overview
10.5.2 Middle East and Africa Polyacrylic Acid Market – Revenue and Forecast to 2031 (US$ Million)
10.5.3 Middle East and Africa Polyacrylic Acid Market Breakdown by Form
10.5.3.1 Middle East and Africa Polyacrylic Acid Market Volume and Forecast and Analysis – by Form
10.5.3.2 Middle East and Africa Polyacrylic Acid Market Revenue and Forecast and Analysis –by Form
10.5.4 Middle East and Africa Polyacrylic Acid Market Breakdown by Application
10.5.4.1 Middle East and Africa Polyacrylic Acid Market Revenue and Forecast and Analysis –by Application
10.5.5 Middle East and Africa Polyacrylic Acid Market Breakdown by End-Use Industry
10.5.5.1 Middle East and Africa Polyacrylic Acid Market Revenue and Forecast and Analysis –by End-Use Industry
10.5.6 Middle East and Africa Polyacrylic Acid Market Revenue and Forecast and Analysis – by Country
10.5.6.1 Middle East and Africa Polyacrylic Acid Market Volume and Forecast and Analysis – by Country
10.5.6.2 Middle East and Africa Polyacrylic Acid Market Revenue and Forecast and Analysis –by Country
10.5.6.3 South Africa Polyacrylic Acid Market – Revenue and Forecast to 2031 (US$ Million)
10.5.6.3.1 South Africa Polyacrylic Acid Market Breakdown by Form
10.5.6.3.2 South Africa Polyacrylic Acid Market Breakdown by Application
10.5.6.3.3 South Africa Polyacrylic Acid Market Breakdown by End-Use Industry
10.5.6.4 Saudi Arabia Polyacrylic Acid Market – Revenue and Forecast to 2031 (US$ Million)
10.5.6.4.1 Saudi Arabia Polyacrylic Acid Market Breakdown by Form
10.5.6.4.2 Saudi Arabia Polyacrylic Acid Market Breakdown by Application
10.5.6.4.3 Saudi Arabia Polyacrylic Acid Market Breakdown by End-Use Industry
10.5.6.5 United Arab Emirates Polyacrylic Acid Market – Revenue and Forecast to 2031 (US$ Million)
10.5.6.5.1 United Arab Emirates Polyacrylic Acid Market Breakdown by Form
10.5.6.5.2 United Arab Emirates Polyacrylic Acid Market Breakdown by Application
10.5.6.5.3 United Arab Emirates Polyacrylic Acid Market Breakdown by End-Use Industry
10.5.6.6 Rest of Middle East and Africa Polyacrylic Acid Market – Revenue and Forecast to 2031 (US$ Million)
10.5.6.6.1 Rest of Middle East and Africa Polyacrylic Acid Market Breakdown by Form
10.5.6.6.2 Rest of Middle East and Africa Polyacrylic Acid Market Breakdown by Application
10.5.6.6.3 Rest of Middle East and Africa Polyacrylic Acid Market Breakdown by End-Use Industry
10.6 South and Central America
10.6.1 South and Central America Polyacrylic Acid Market Overview
10.6.2 South and Central America Polyacrylic Acid Market – Revenue and Forecast to 2031 (US$ Million)
10.6.3 South and Central America Polyacrylic Acid Market Breakdown by Form
10.6.3.1 South and Central America Polyacrylic Acid Market Volume and Forecast and Analysis – by Form
10.6.3.2 South and Central America Polyacrylic Acid Market Revenue and Forecast and Analysis –by Form
10.6.4 South and Central America Polyacrylic Acid Market Breakdown by Application
10.6.4.1 South and Central America Polyacrylic Acid Market Revenue and Forecast and Analysis –by Application
10.6.5 South and Central America Polyacrylic Acid Market Breakdown by End-Use Industry
10.6.5.1 South and Central America Polyacrylic Acid Market Revenue and Forecast and Analysis –by End-Use Industry
10.6.6 South and Central America Polyacrylic Acid Market Revenue and Forecast and Analysis – by Country
10.6.6.1 South and Central America Polyacrylic Acid Market Volume and Forecast and Analysis – by Country
10.6.6.2 South and Central America Polyacrylic Acid Market Revenue and Forecast and Analysis –by Country
10.6.6.3 Brazil Polyacrylic Acid Market – Revenue and Forecast to 2031 (US$ Million)
10.6.6.3.1 Brazil Polyacrylic Acid Market Breakdown by Form
10.6.6.3.2 Brazil Polyacrylic Acid Market Breakdown by Application
10.6.6.3.3 Brazil Polyacrylic Acid Market Breakdown by End-Use Industry
10.6.6.4 Argentina Polyacrylic Acid Market – Revenue and Forecast to 2031 (US$ Million)
10.6.6.4.1 Argentina Polyacrylic Acid Market Breakdown by Form
10.6.6.4.2 Argentina Polyacrylic Acid Market Breakdown by Application
10.6.6.4.3 Argentina Polyacrylic Acid Market Breakdown by End-Use Industry
10.6.6.5 Rest of South and Central America Polyacrylic Acid Market – Revenue and Forecast to 2031 (US$ Million)
10.6.6.5.1 Rest of South and Central America Polyacrylic Acid Market Breakdown by Form
10.6.6.5.2 Rest of South and Central America Polyacrylic Acid Market Breakdown by Application
10.6.6.5.3 Rest of South and Central America Polyacrylic Acid Market Breakdown by End-Use Industry
11. Competitive Landscape
11.1 Heat Map Analysis by Key Players
11.2 Company Positioning & Concentration
12. Industry Landscape
12.1 Overview
12.2 Product Launch
12.3 Expansion
13. Company Profiles
13.1 Arkema SA
13.1.1 Key Facts
13.1.2 Business Description
13.1.3 Products and Services
13.1.4 Financial Overview
13.1.5 SWOT Analysis
13.1.6 Key Developments
13.2 Ashland Inc
13.2.1 Key Facts
13.2.2 Business Description
13.2.3 Products and Services
13.2.4 Financial Overview
13.2.5 SWOT Analysis
13.2.6 Key Developments
13.3 BASF SE
13.3.1 Key Facts
13.3.2 Business Description
13.3.3 Products and Services
13.3.4 Financial Overview
13.3.5 SWOT Analysis
13.3.6 Key Developments
13.4 Evonik Industries AG
13.4.1 Key Facts
13.4.2 Business Description
13.4.3 Products and Services
13.4.4 Financial Overview
13.4.5 SWOT Analysis
13.4.6 Key Developments
13.5 Nippon Shokubai Co Ltd
13.5.1 Key Facts
13.5.2 Business Description
13.5.3 Products and Services
13.5.4 Financial Overview
13.5.5 SWOT Analysis
13.5.6 Key Developments
13.6 Sumitomo Seika Chemicals Co Ltd
13.6.1 Key Facts
13.6.2 Business Description
13.6.3 Products and Services
13.6.4 Financial Overview
13.6.5 SWOT Analysis
13.6.6 Key Developments
13.7 The Dow Chemical Co
13.7.1 Key Facts
13.7.2 Business Description
13.7.3 Products and Services
13.7.4 Financial Overview
13.7.5 SWOT Analysis
13.7.6 Key Developments
13.8 The Lubrizol Corp
13.8.1 Key Facts
13.8.2 Business Description
13.8.3 Products and Services
13.8.4 Financial Overview
13.8.5 SWOT Analysis
13.8.6 Key Developments
13.9 Shandong ThFine Chemical Co., Ltd
13.9.1 Key Facts
13.9.2 Business Description
13.9.3 Products and Services
13.9.4 Financial Overview
13.9.5 SWOT Analysis
13.9.6 Key Developments
13.10 Glentham Life Sciences Limited
13.10.1 Key Facts
13.10.2 Business Description
13.10.3 Products and Services
13.10.4 Financial Overview
13.10.5 SWOT Analysis
13.10.6 Key Developments
14. Appendix
14.1 About The Insight Partners
List of Tables
Table 1. Polyacrylic Acid Market Segmentation
Table 2. List of Vendors
Table 3. Global Polyacrylic Acid Market – Volume and Forecast to 2031 (Kilo Tons)
Table 4. Global Polyacrylic Acid Market – Revenue and Forecast to 2031 (US$ Million)
Table 5. Global Polyacrylic Acid Market – Volume and Forecast to 2031 (Kilo Tons) – by Form
Table 6. Global Polyacrylic Acid Market – Revenue and Forecast to 2031 (US$ Million) – by Form
Table 7. Global Polyacrylic Acid Market – Revenue and Forecast to 2031 (US$ Million) – by Application
Table 8. Global Polyacrylic Acid Market – Revenue and Forecast to 2031 (US$ Million) – by End-Use Industry
Table 9. North America Polyacrylic Acid Market – Volume and Forecast to 2031 (Kilo Tons) – by Form
Table 10. North America Polyacrylic Acid Market – Revenue and Forecast to 2031 (US$ Million) – by Form
Table 11. North America Polyacrylic Acid Market – Revenue and Forecast to 2031 (US$ Million) – by Application
Table 12. North America Polyacrylic Acid Market – Revenue and Forecast to 2031 (US$ Million) – by End-Use Industry
Table 13. North America Polyacrylic Acid Market – Volume and Forecast to 2031 (Kilo Tons) – by Country
Table 14. North America Polyacrylic Acid Market – Revenue and Forecast to 2031 (US$ Million) – by Country
Table 15. United States Polyacrylic Acid Market –Volume and Forecast to 2031 (Kilo Tons) – by Form
Table 16. United States Polyacrylic Acid Market – Revenue and Forecast to 2031 (US$ Million) – by Form
Table 17. United States Polyacrylic Acid Market – Revenue and Forecast to 2031 (US$ Million) – by Application
Table 18. United States Polyacrylic Acid Market – Revenue and Forecast to 2031 (US$ Million) – by End-Use Industry
Table 19. Canada Polyacrylic Acid Market –Volume and Forecast to 2031 (Kilo Tons) – by Form
Table 20. Canada Polyacrylic Acid Market – Revenue and Forecast to 2031 (US$ Million) – by Form
Table 21. Canada Polyacrylic Acid Market – Revenue and Forecast to 2031 (US$ Million) – by Application
Table 22. Canada Polyacrylic Acid Market – Revenue and Forecast to 2031 (US$ Million) – by End-Use Industry
Table 23. Mexico Polyacrylic Acid Market –Volume and Forecast to 2031 (Kilo Tons) – by Form
Table 24. Mexico Polyacrylic Acid Market – Revenue and Forecast to 2031 (US$ Million) – by Form
Table 25. Mexico Polyacrylic Acid Market – Revenue and Forecast to 2031 (US$ Million) – by Application
Table 26. Mexico Polyacrylic Acid Market – Revenue and Forecast to 2031 (US$ Million) – by End-Use Industry
Table 27. Europe Polyacrylic Acid Market – Volume and Forecast to 2031 (Kilo Tons) – by Form
Table 28. Europe Polyacrylic Acid Market – Revenue and Forecast to 2031 (US$ Million) – by Form
Table 29. Europe Polyacrylic Acid Market – Revenue and Forecast to 2031 (US$ Million) – by Application
Table 30. Europe Polyacrylic Acid Market – Revenue and Forecast to 2031 (US$ Million) – by End-Use Industry
Table 31. Europe Polyacrylic Acid Market – Volume and Forecast to 2031 (Kilo Tons) – by Country
Table 32. Europe Polyacrylic Acid Market – Revenue and Forecast to 2031 (US$ Million) – by Country
Table 33. Germany Polyacrylic Acid Market –Volume and Forecast to 2031 (Kilo Tons) – by Form
Table 34. Germany Polyacrylic Acid Market – Revenue and Forecast to 2031 (US$ Million) – by Form
Table 35. Germany Polyacrylic Acid Market – Revenue and Forecast to 2031 (US$ Million) – by Application
Table 36. Germany Polyacrylic Acid Market – Revenue and Forecast to 2031 (US$ Million) – by End-Use Industry
Table 37. France Polyacrylic Acid Market –Volume and Forecast to 2031 (Kilo Tons) – by Form
Table 38. France Polyacrylic Acid Market – Revenue and Forecast to 2031 (US$ Million) – by Form
Table 39. France Polyacrylic Acid Market – Revenue and Forecast to 2031 (US$ Million) – by Application
Table 40. France Polyacrylic Acid Market – Revenue and Forecast to 2031 (US$ Million) – by End-Use Industry
Table 41. Italy Polyacrylic Acid Market –Volume and Forecast to 2031 (Kilo Tons) – by Form
Table 42. Italy Polyacrylic Acid Market – Revenue and Forecast to 2031 (US$ Million) – by Form
Table 43. Italy Polyacrylic Acid Market – Revenue and Forecast to 2031 (US$ Million) – by Application
Table 44. Italy Polyacrylic Acid Market – Revenue and Forecast to 2031 (US$ Million) – by End-Use Industry
Table 45. United Kingdom Polyacrylic Acid Market –Volume and Forecast to 2031 (Kilo Tons) – by Form
Table 46. United Kingdom Polyacrylic Acid Market – Revenue and Forecast to 2031 (US$ Million) – by Form
Table 47. United Kingdom Polyacrylic Acid Market – Revenue and Forecast to 2031 (US$ Million) – by Application
Table 48. United Kingdom Polyacrylic Acid Market – Revenue and Forecast to 2031 (US$ Million) – by End-Use Industry
Table 49. Russia Polyacrylic Acid Market –Volume and Forecast to 2031 (Kilo Tons) – by Form
Table 50. Russia Polyacrylic Acid Market – Revenue and Forecast to 2031 (US$ Million) – by Form
Table 51. Russia Polyacrylic Acid Market – Revenue and Forecast to 2031 (US$ Million) – by Application
Table 52. Russia Polyacrylic Acid Market – Revenue and Forecast to 2031 (US$ Million) – by End-Use Industry
Table 53. Rest of Europe Polyacrylic Acid Market –Volume and Forecast to 2031 (Kilo Tons) – by Form
Table 54. Rest of Europe Polyacrylic Acid Market – Revenue and Forecast to 2031 (US$ Million) – by Form
Table 55. Rest of Europe Polyacrylic Acid Market – Revenue and Forecast to 2031 (US$ Million) – by Application
Table 56. Rest of Europe Polyacrylic Acid Market – Revenue and Forecast to 2031 (US$ Million) – by End-Use Industry
Table 57. Asia Pacific Polyacrylic Acid Market – Volume and Forecast to 2031 (Kilo Tons) – by Form
Table 58. Asia Pacific Polyacrylic Acid Market – Revenue and Forecast to 2031 (US$ Million) – by Form
Table 59. Asia Pacific Polyacrylic Acid Market – Revenue and Forecast to 2031 (US$ Million) – by Application
Table 60. Asia Pacific Polyacrylic Acid Market – Revenue and Forecast to 2031 (US$ Million) – by End-Use Industry
Table 61. Asia Pacific Polyacrylic Acid Market – Volume and Forecast to 2031 (Kilo Tons) – by Country
Table 62. Asia Pacific Polyacrylic Acid Market – Revenue and Forecast to 2031 (US$ Million) – by Country
Table 63. Australia Polyacrylic Acid Market –Volume and Forecast to 2031 (Kilo Tons) – by Form
Table 64. Australia Polyacrylic Acid Market – Revenue and Forecast to 2031 (US$ Million) – by Form
Table 65. Australia Polyacrylic Acid Market – Revenue and Forecast to 2031 (US$ Million) – by Application
Table 66. Australia Polyacrylic Acid Market – Revenue and Forecast to 2031 (US$ Million) – by End-Use Industry
Table 67. China Polyacrylic Acid Market –Volume and Forecast to 2031 (Kilo Tons) – by Form
Table 68. China Polyacrylic Acid Market – Revenue and Forecast to 2031 (US$ Million) – by Form
Table 69. China Polyacrylic Acid Market – Revenue and Forecast to 2031 (US$ Million) – by Application
Table 70. China Polyacrylic Acid Market – Revenue and Forecast to 2031 (US$ Million) – by End-Use Industry
Table 71. India Polyacrylic Acid Market –Volume and Forecast to 2031 (Kilo Tons) – by Form
Table 72. India Polyacrylic Acid Market – Revenue and Forecast to 2031 (US$ Million) – by Form
Table 73. India Polyacrylic Acid Market – Revenue and Forecast to 2031 (US$ Million) – by Application
Table 74. India Polyacrylic Acid Market – Revenue and Forecast to 2031 (US$ Million) – by End-Use Industry
Table 75. Japan Polyacrylic Acid Market –Volume and Forecast to 2031 (Kilo Tons) – by Form
Table 76. Japan Polyacrylic Acid Market – Revenue and Forecast to 2031 (US$ Million) – by Form
Table 77. Japan Polyacrylic Acid Market – Revenue and Forecast to 2031 (US$ Million) – by Application
Table 78. Japan Polyacrylic Acid Market – Revenue and Forecast to 2031 (US$ Million) – by End-Use Industry
Table 79. South Korea Polyacrylic Acid Market –Volume and Forecast to 2031 (Kilo Tons) – by Form
Table 80. South Korea Polyacrylic Acid Market – Revenue and Forecast to 2031 (US$ Million) – by Form
Table 81. South Korea Polyacrylic Acid Market – Revenue and Forecast to 2031 (US$ Million) – by Application
Table 82. South Korea Polyacrylic Acid Market – Revenue and Forecast to 2031 (US$ Million) – by End-Use Industry
Table 83. Rest of APAC Polyacrylic Acid Market –Volume and Forecast to 2031 (Kilo Tons) – by Form
Table 84. Rest of APAC Polyacrylic Acid Market – Revenue and Forecast to 2031 (US$ Million) – by Form
Table 85. Rest of APAC Polyacrylic Acid Market – Revenue and Forecast to 2031 (US$ Million) – by Application
Table 86. Rest of APAC Polyacrylic Acid Market – Revenue and Forecast to 2031 (US$ Million) – by End-Use Industry
Table 87. Middle East and Africa Polyacrylic Acid Market – Volume and Forecast to 2031 (Kilo Tons) – by Form
Table 88. Middle East and Africa Polyacrylic Acid Market – Revenue and Forecast to 2031 (US$ Million) – by Form
Table 89. Middle East and Africa Polyacrylic Acid Market – Revenue and Forecast to 2031 (US$ Million) – by Application
Table 90. Middle East and Africa Polyacrylic Acid Market – Revenue and Forecast to 2031 (US$ Million) – by End-Use Industry
Table 91. Middle East and Africa Polyacrylic Acid Market – Volume and Forecast to 2031 (Kilo Tons) – by Country
Table 92. Middle East and Africa Polyacrylic Acid Market – Revenue and Forecast to 2031 (US$ Million) – by Country
Table 93. South Africa Polyacrylic Acid Market –Volume and Forecast to 2031 (Kilo Tons) – by Form
Table 94. South Africa Polyacrylic Acid Market – Revenue and Forecast to 2031 (US$ Million) – by Form
Table 95. South Africa Polyacrylic Acid Market – Revenue and Forecast to 2031 (US$ Million) – by Application
Table 96. South Africa Polyacrylic Acid Market – Revenue and Forecast to 2031 (US$ Million) – by End-Use Industry
Table 97. Saudi Arabia Polyacrylic Acid Market –Volume and Forecast to 2031 (Kilo Tons) – by Form
Table 98. Saudi Arabia Polyacrylic Acid Market – Revenue and Forecast to 2031 (US$ Million) – by Form
Table 99. Saudi Arabia Polyacrylic Acid Market – Revenue and Forecast to 2031 (US$ Million) – by Application
Table 100. Saudi Arabia Polyacrylic Acid Market – Revenue and Forecast to 2031 (US$ Million) – by End-Use Industry
Table 101. United Arab Emirates Polyacrylic Acid Market –Volume and Forecast to 2031 (Kilo Tons) – by Form
Table 102. United Arab Emirates Polyacrylic Acid Market – Revenue and Forecast to 2031 (US$ Million) – by Form
Table 103. United Arab Emirates Polyacrylic Acid Market – Revenue and Forecast to 2031 (US$ Million) – by Application
Table 104. United Arab Emirates Polyacrylic Acid Market – Revenue and Forecast to 2031 (US$ Million) – by End-Use Industry
Table 105. Rest of Middle East and Africa Polyacrylic Acid Market –Volume and Forecast to 2031 (Kilo Tons) – by Form
Table 106. Rest of Middle East and Africa Polyacrylic Acid Market – Revenue and Forecast to 2031 (US$ Million) – by Form
Table 107. Rest of Middle East and Africa Polyacrylic Acid Market – Revenue and Forecast to 2031 (US$ Million) – by Application
Table 108. Rest of Middle East and Africa Polyacrylic Acid Market – Revenue and Forecast to 2031 (US$ Million) – by End-Use Industry
Table 109. South and Central America Polyacrylic Acid Market – Volume and Forecast to 2031 (Kilo Tons) – by Form
Table 110. South and Central America Polyacrylic Acid Market – Revenue and Forecast to 2031 (US$ Million) – by Form
Table 111. South and Central America Polyacrylic Acid Market – Revenue and Forecast to 2031 (US$ Million) – by Application
Table 112. South and Central America Polyacrylic Acid Market – Revenue and Forecast to 2031 (US$ Million) – by End-Use Industry
Table 113. South and Central America Polyacrylic Acid Market – Volume and Forecast to 2031 (Kilo Tons) – by Country
Table 114. South and Central America Polyacrylic Acid Market – Revenue and Forecast to 2031 (US$ Million) – by Country
Table 115. Brazil Polyacrylic Acid Market –Volume and Forecast to 2031 (Kilo Tons) – by Form
Table 116. Brazil Polyacrylic Acid Market – Revenue and Forecast to 2031 (US$ Million) – by Form
Table 117. Brazil Polyacrylic Acid Market – Revenue and Forecast to 2031 (US$ Million) – by Application
Table 118. Brazil Polyacrylic Acid Market – Revenue and Forecast to 2031 (US$ Million) – by End-Use Industry
Table 119. Argentina Polyacrylic Acid Market –Volume and Forecast to 2031 (Kilo Tons) – by Form
Table 120. Argentina Polyacrylic Acid Market – Revenue and Forecast to 2031 (US$ Million) – by Form
Table 121. Argentina Polyacrylic Acid Market – Revenue and Forecast to 2031 (US$ Million) – by Application
Table 122. Argentina Polyacrylic Acid Market – Revenue and Forecast to 2031 (US$ Million) – by End-Use Industry
Table 123. Rest of South and Central America Polyacrylic Acid Market –Volume and Forecast to 2031 (Kilo Tons) – by Form
Table 124. Rest of South and Central America Polyacrylic Acid Market – Revenue and Forecast to 2031 (US$ Million) – by Form
Table 125. Rest of South and Central America Polyacrylic Acid Market – Revenue and Forecast to 2031 (US$ Million) – by Application
Table 126. Rest of South and Central America Polyacrylic Acid Market – Revenue and Forecast to 2031 (US$ Million) – by End-Use Industry
List of Figures
Figure 1. Polyacrylic Acid Market Segmentation, by Geography
Figure 2. Global Polyacrylic Acid Market – Porter’s Five Forces Analysis
Figure 3. Ecosystem Analysis: Polyacrylic Acid Market
Figure 4. Impact Analysis of Drivers and Restraints
Figure 5. Global Polyacrylic Acid Market Volume (Kilo Tons), 2023–2031
Figure 6. Global Polyacrylic Acid Market Revenue (US$ Million), 2023–2031
Figure 7. Global Polyacrylic Acid Market Share (%) – Form, 2023 and 2031
Figure 8. Powder: Polyacrylic Acid Market – Volume and Forecast to 2031 (Kilo Tons)
Figure 9. Powder: Polyacrylic Acid Market – Revenue and Forecast to 2031 (US$ Million)
Figure 10. Liquid: Polyacrylic Acid Market – Volume and Forecast to 2031 (Kilo Tons)
Figure 11. Liquid: Polyacrylic Acid Market – Revenue and Forecast to 2031 (US$ Million)
Figure 12. Global Polyacrylic Acid Market Share (%) – Application, 2023 and 2031
Figure 13. Dispersing Agent: Polyacrylic Acid Market – Revenue and Forecast to 2031 (US$ Million)
Figure 14. Anti-Scaling Agent: Polyacrylic Acid Market – Revenue and Forecast to 2031 (US$ Million)
Figure 15. Thickeners: Polyacrylic Acid Market – Revenue and Forecast to 2031 (US$ Million)
Figure 16. Emulsifiers: Polyacrylic Acid Market – Revenue and Forecast to 2031 (US$ Million)
Figure 17. Ion-Exchanger: Polyacrylic Acid Market – Revenue and Forecast to 2031 (US$ Million)
Figure 18. Others: Polyacrylic Acid Market – Revenue and Forecast to 2031 (US$ Million)
Figure 19. Global Polyacrylic Acid Market Share (%) – End-Use Industry, 2023 and 2031
Figure 20. Water Treatment: Polyacrylic Acid Market – Revenue and Forecast to 2031 (US$ Million)
Figure 21. Personal Care and Cosmetics: Polyacrylic Acid Market – Revenue and Forecast to 2031 (US$ Million)
Figure 22. Detergents and Cleaners: Polyacrylic Acid Market – Revenue and Forecast to 2031 (US$ Million)
Figure 23. Leather and Textiles: Polyacrylic Acid Market – Revenue and Forecast to 2031 (US$ Million)
Figure 24. Pulp and Paper: Polyacrylic Acid Market – Revenue and Forecast to 2031 (US$ Million)
Figure 25. Paints and Coatings: Polyacrylic Acid Market – Revenue and Forecast to 2031 (US$ Million)
Figure 26. Ceramics: Polyacrylic Acid Market – Revenue and Forecast to 2031 (US$ Million)
Figure 27. Others: Polyacrylic Acid Market – Revenue and Forecast to 2031 (US$ Million)
Figure 28. Global Polyacrylic Acid Market Breakdown by Region, 2023 and 2031 (%)
Figure 29. North America Polyacrylic Acid Market – Revenue and Forecast to 2031 (US$ Million)
Figure 30. North America Polyacrylic Acid Market Breakdown by Form (2023 and 2031)
Figure 31. North America Polyacrylic Acid Market Breakdown by Application (2023 and 2031)
Figure 32. North America Polyacrylic Acid Market Breakdown by End-Use Industry (2023 and 2031)
Figure 33. North America Polyacrylic Acid Market Breakdown by Key Countries, 2023 and 2031 (%)
Figure 34. United States Polyacrylic Acid Market – Revenue and Forecast to 2031 (US$ Million)
Figure 35. Canada Polyacrylic Acid Market – Revenue and Forecast to 2031 (US$ Million)
Figure 36. Mexico Polyacrylic Acid Market – Revenue and Forecast to 2031 (US$ Million)
Figure 37. Europe Polyacrylic Acid Market – Revenue and Forecast to 2031 (US$ Million)
Figure 38. Europe Polyacrylic Acid Market Breakdown by Form (2023 and 2031)
Figure 39. Europe Polyacrylic Acid Market Breakdown by Application (2023 and 2031)
Figure 40. Europe Polyacrylic Acid Market Breakdown by End-Use Industry (2023 and 2031)
Figure 41. Europe Polyacrylic Acid Market Breakdown by Key Countries, 2023 and 2031 (%)
Figure 42. Germany Polyacrylic Acid Market – Revenue and Forecast to 2031 (US$ Million)
Figure 43. France Polyacrylic Acid Market – Revenue and Forecast to 2031 (US$ Million)
Figure 44. Italy Polyacrylic Acid Market – Revenue and Forecast to 2031 (US$ Million)
Figure 45. United Kingdom Polyacrylic Acid Market – Revenue and Forecast to 2031 (US$ Million)
Figure 46. Russia Polyacrylic Acid Market – Revenue and Forecast to 2031 (US$ Million)
Figure 47. Rest of Europe Polyacrylic Acid Market – Revenue and Forecast to 2031 (US$ Million)
Figure 48. Asia Pacific Polyacrylic Acid Market – Revenue and Forecast to 2031 (US$ Million)
Figure 49. Asia Pacific Polyacrylic Acid Market Breakdown by Form (2023 and 2031)
Figure 50. Asia Pacific Polyacrylic Acid Market Breakdown by Application (2023 and 2031)
Figure 51. Asia Pacific Polyacrylic Acid Market Breakdown by End-Use Industry (2023 and 2031)
Figure 52. Asia Pacific Polyacrylic Acid Market Breakdown by Key Countries, 2023 and 2031 (%)
Figure 53. Australia Polyacrylic Acid Market – Revenue and Forecast to 2031 (US$ Million)
Figure 54. China Polyacrylic Acid Market – Revenue and Forecast to 2031 (US$ Million)
Figure 55. India Polyacrylic Acid Market – Revenue and Forecast to 2031 (US$ Million)
Figure 56. Japan Polyacrylic Acid Market – Revenue and Forecast to 2031 (US$ Million)
Figure 57. South Korea Polyacrylic Acid Market – Revenue and Forecast to 2031 (US$ Million)
Figure 58. Rest of APAC Polyacrylic Acid Market – Revenue and Forecast to 2031 (US$ Million)
Figure 59. Middle East and Africa Polyacrylic Acid Market – Revenue and Forecast to 2031 (US$ Million)
Figure 60. Middle East and Africa Polyacrylic Acid Market Breakdown by Form (2023 and 2031)
Figure 61. Middle East and Africa Polyacrylic Acid Market Breakdown by Application (2023 and 2031)
Figure 62. Middle East and Africa Polyacrylic Acid Market Breakdown by End-Use Industry (2023 and 2031)
Figure 63. Middle East and Africa Polyacrylic Acid Market Breakdown by Key Countries, 2023 and 2031 (%)
Figure 64. South Africa Polyacrylic Acid Market – Revenue and Forecast to 2031 (US$ Million)
Figure 65. Saudi Arabia Polyacrylic Acid Market – Revenue and Forecast to 2031 (US$ Million)
Figure 66. United Arab Emirates Polyacrylic Acid Market – Revenue and Forecast to 2031 (US$ Million)
Figure 67. Rest of Middle East and Africa Polyacrylic Acid Market – Revenue and Forecast to 2031 (US$ Million)
Figure 68. South and Central America Polyacrylic Acid Market – Revenue and Forecast to 2031 (US$ Million)
Figure 69. South and Central America Polyacrylic Acid Market Breakdown by Form (2023 and 2031)
Figure 70. South and Central America Polyacrylic Acid Market Breakdown by Application (2023 and 2031)
Figure 71. South and Central America Polyacrylic Acid Market Breakdown by End-Use Industry (2023 and 2031)
Figure 72. South and Central America Polyacrylic Acid Market Breakdown by Key Countries, 2023 and 2031 (%)
Figure 73. Brazil Polyacrylic Acid Market – Revenue and Forecast to 2031 (US$ Million)
Figure 74. Argentina Polyacrylic Acid Market – Revenue and Forecast to 2031 (US$ Million)
Figure 75. Rest of South and Central America Polyacrylic Acid Market – Revenue and Forecast to 2031 (US$ Million)
Figure 76. Heat Map Analysis by Key Players
Figure 77. Company Positioning & Concentration
The List of Companies - Polyacrylic Acid Market
- Arkema SA
- Ashland Inc
- BASF SE
- Evonik Industries AG
- Nippon Shokubai Co Ltd
- Sumitomo Seika Chemicals Co Ltd
- The Dow Chemical Co
- The Lubrizol Corp
- Shandong ThFine Chemical Co Ltd
- Glentham Life Sciences Limited
The Insight Partners performs research in 4 major stages: Data Collection & Secondary Research, Primary Research, Data Analysis and Data Triangulation & Final Review.
- Data Collection and Secondary Research:
As a market research and consulting firm operating from a decade, we have published many reports and advised several clients across the globe. First step for any study will start with an assessment of currently available data and insights from existing reports. Further, historical and current market information is collected from Investor Presentations, Annual Reports, SEC Filings, etc., and other information related to company’s performance and market positioning are gathered from Paid Databases (Factiva, Hoovers, and Reuters) and various other publications available in public domain.
Several associations trade associates, technical forums, institutes, societies and organizations are accessed to gain technical as well as market related insights through their publications such as research papers, blogs and press releases related to the studies are referred to get cues about the market. Further, white papers, journals, magazines, and other news articles published in the last 3 years are scrutinized and analyzed to understand the current market trends.
- Primary Research:
The primarily interview analysis comprise of data obtained from industry participants interview and answers to survey questions gathered by in-house primary team.
For primary research, interviews are conducted with industry experts/CEOs/Marketing Managers/Sales Managers/VPs/Subject Matter Experts from both demand and supply side to get a 360-degree view of the market. The primary team conducts several interviews based on the complexity of the markets to understand the various market trends and dynamics which makes research more credible and precise.
A typical research interview fulfils the following functions:
- Provides first-hand information on the market size, market trends, growth trends, competitive landscape, and outlook
- Validates and strengthens in-house secondary research findings
- Develops the analysis team’s expertise and market understanding
Primary research involves email interactions and telephone interviews for each market, category, segment, and sub-segment across geographies. The participants who typically take part in such a process include, but are not limited to:
- Industry participants: VPs, business development managers, market intelligence managers and national sales managers
- Outside experts: Valuation experts, research analysts and key opinion leaders specializing in the electronics and semiconductor industry.
Below is the breakup of our primary respondents by company, designation, and region:

Once we receive the confirmation from primary research sources or primary respondents, we finalize the base year market estimation and forecast the data as per the macroeconomic and microeconomic factors assessed during data collection.
- Data Analysis:
Once data is validated through both secondary as well as primary respondents, we finalize the market estimations by hypothesis formulation and factor analysis at regional and country level.
- 3.1 Macro-Economic Factor Analysis:
We analyse macroeconomic indicators such the gross domestic product (GDP), increase in the demand for goods and services across industries, technological advancement, regional economic growth, governmental policies, the influence of COVID-19, PEST analysis, and other aspects. This analysis aids in setting benchmarks for various nations/regions and approximating market splits. Additionally, the general trend of the aforementioned components aid in determining the market's development possibilities.
- 3.2 Country Level Data:
Various factors that are especially aligned to the country are taken into account to determine the market size for a certain area and country, including the presence of vendors, such as headquarters and offices, the country's GDP, demand patterns, and industry growth. To comprehend the market dynamics for the nation, a number of growth variables, inhibitors, application areas, and current market trends are researched. The aforementioned elements aid in determining the country's overall market's growth potential.
- 3.3 Company Profile:
The “Table of Contents” is formulated by listing and analyzing more than 25 - 30 companies operating in the market ecosystem across geographies. However, we profile only 10 companies as a standard practice in our syndicate reports. These 10 companies comprise leading, emerging, and regional players. Nonetheless, our analysis is not restricted to the 10 listed companies, we also analyze other companies present in the market to develop a holistic view and understand the prevailing trends. The “Company Profiles” section in the report covers key facts, business description, products & services, financial information, SWOT analysis, and key developments. The financial information presented is extracted from the annual reports and official documents of the publicly listed companies. Upon collecting the information for the sections of respective companies, we verify them via various primary sources and then compile the data in respective company profiles. The company level information helps us in deriving the base number as well as in forecasting the market size.
- 3.4 Developing Base Number:
Aggregation of sales statistics (2020-2022) and macro-economic factor, and other secondary and primary research insights are utilized to arrive at base number and related market shares for 2022. The data gaps are identified in this step and relevant market data is analyzed, collected from paid primary interviews or databases. On finalizing the base year market size, forecasts are developed on the basis of macro-economic, industry and market growth factors and company level analysis.
- Data Triangulation and Final Review:
The market findings and base year market size calculations are validated from supply as well as demand side. Demand side validations are based on macro-economic factor analysis and benchmarks for respective regions and countries. In case of supply side validations, revenues of major companies are estimated (in case not available) based on industry benchmark, approximate number of employees, product portfolio, and primary interviews revenues are gathered. Further revenue from target product/service segment is assessed to avoid overshooting of market statistics. In case of heavy deviations between supply and demand side values, all thes steps are repeated to achieve synchronization.
We follow an iterative model, wherein we share our research findings with Subject Matter Experts (SME’s) and Key Opinion Leaders (KOLs) until consensus view of the market is not formulated – this model negates any drastic deviation in the opinions of experts. Only validated and universally acceptable research findings are quoted in our reports.
We have important check points that we use to validate our research findings – which we call – data triangulation, where we validate the information, we generate from secondary sources with primary interviews and then we re-validate with our internal data bases and Subject matter experts. This comprehensive model enables us to deliver high quality, reliable data in shortest possible time.
Trends and growth analysis reports related to Polyacrylic Acid Market

Apr 2024
Re-Refined Paraffinic Base Oil Market
Size and Forecast (2021 - 2031), Global and Regional Share, Trend, and Growth Opportunity Analysis Report Coverage: By Process (Acid Treatment, Clay Treatment, Solvent Extraction, and Hydrotreating), Application (Engine Oil, Hydraulic Oil, Metalworking Fluid, Compressor Oil, Grease, Turbine Oil, and Others), End Use (Automotive, Construction, Mining and Metallurgy, Marine, Energy and Power, Oil and Gas, and Others), and Geography
Apr 2024
Cosmetic Polymer Ingredients Market
Size and Forecast (2021 - 2031), Global and Regional Share, Trend, and Growth Opportunity Analysis Report Coverage: By Type (Polyethylene Glycol, Acrylic Acid-Based, Vinyl Acetate, Silicone, Cellulose, Collagen, Pectin, Xanthan Gum, Chitosan, and Others), Category (Natural, Synthetic, and Semi-Synthetic), Function (Rheology Modifier, Stabilizers, Emulsifiers, Film Formers, Conditioning, and Others), Application (Skincare, Hair Care, Makeup, and Others), and Geography
Apr 2024
Plastic Pipes Market
Size and Forecast (2021 - 2031), Global and Regional Share, Trend, and Growth Opportunity Analysis Report Coverage: By Type [Corrugated (Single-Wall and Multi-Wall) and Smoothwall], Material Type (Polyvinyl Chloride, High-Density Polyethylene, Polypropylene, and Others), Application (Water Supply, Sewage and Drainage, Irrigation, Gas Distribution, and Others), End-Use Industry (Construction and Infrastructure, Water and Wastewater Management, Oil and Gas, and Others), and Geography
Apr 2024
Nonwovens for Energy Applications Market
Size and Forecast (2021 - 2031), Global and Regional Share, Trend, and Growth Opportunity Analysis Report Coverage: By Type (Carbon Fiber, Titanium Fiber, and Others), Application [Battery, Fuel Cell Gas Diffusion Layer (GDL), PTL, and Wind Energy], and Geography
Apr 2024
Antimicrobial Coating Market
Size and Forecast (2021 - 2031), Global and Regional Share, Trend, and Growth Opportunity Analysis Report Coverage: By Material (Silver, Copper, Titanium Dioxide, and Others), Application (Healthcare, HVAC, Mold Remediation, Building and Construction, Food and Beverages, and Others), and Geography
Apr 2024
Hot Melt Adhesives Market
Size and Forecast (2020–2030), Global and Regional Share, Trend, and Growth Opportunity Analysis Report Coverage: By Product Type (Glue Sticks, Glue Slugs, and Others), Type (Ethylene Vinyl Acetate, Polyolefins, Polyamides, Polyurethanes, Styrene Block Copolymers, and Others), Application (Packaging, Construction, Automotive, Furniture, Footwear, Electronics, and Others), and Geography
Apr 2024
Lubricants Market
Size and Forecast (2021 - 2031), Global and Regional Share, Trend, and Growth Opportunity Analysis Report Coverage: By Base Oil (Mineral Oil, Synthetic Oil, and Bio-based Oil), Type (Hydraulic Fluid, Engine Oil, Driveline Lubricants, Metalworking Fluids, Grease, Process Oils, Coolants, and Others), End-Use Industry [Automotive (Passenger Cars, Light Commercial Vehicles, Heavy Commercial Vehicles, and Others), Building and Construction, Power Generation, Mining and Metallurgy, Food Processing, Oil and Gas, Marine, Aviation, and Others], and Geography
Apr 2024
Cosmetic Preservatives Market
Size and Forecast (2021 - 2031), Global and Regional Share, Trend, and Growth Opportunity Analysis Report Coverage: By Source (Natural and Synthetic), Product Type (Parabens, Formaldehyde Releasers, Organic Acids, Quaternary Compounds, Phenol Derivatives, Alcohols, and Others), Application (Hair Care, Skin Care, Makeup Products, Toiletries, Perfumes and Deodorants, and Others), and Geography
 Get Free Sample For