The power and control cable market size is projected to reach US$ 226.32 billion by 2030 from US$ 126.78 billion in 2022. The market is expected to register a CAGR of 7.5% during 2022–2030. Advancement in wires and cables is likely to remain a key trend in the market.
Power and Control Cable Market Analysis
Growing adoption of power and control cables in electric vehicles and increasing demand for reliable electricity are driving the market. The market is anticipated to grow during the forecast period due to the development of the transmission and distribution sector. Moreover, government investment in energy grid projects and the rising demand for data centers and cloud computing are creating lucrative opportunities for the market.
Power and Control Cable Marke Overview
Power cables transmit energy from a source to equipment. Control cables transmit signals that control the operation of devices. Power and control cables are the most popular kind of electrical cables used in residential, commercial, and industrial applications to supply power and transmit signals. Application demands for power and control cables differ in terms of voltage levels, shielding alternatives, flexibility requirements, oil resistance, and insulation types to survive environmental and operational circumstances.
Customize Research To Suit Your Requirement
We can optimize and tailor the analysis and scope which is unmet through our standard offerings. This flexibility will help you gain the exact information needed for your business planning and decision making.
Power and Control Cable Market: Strategic Insights
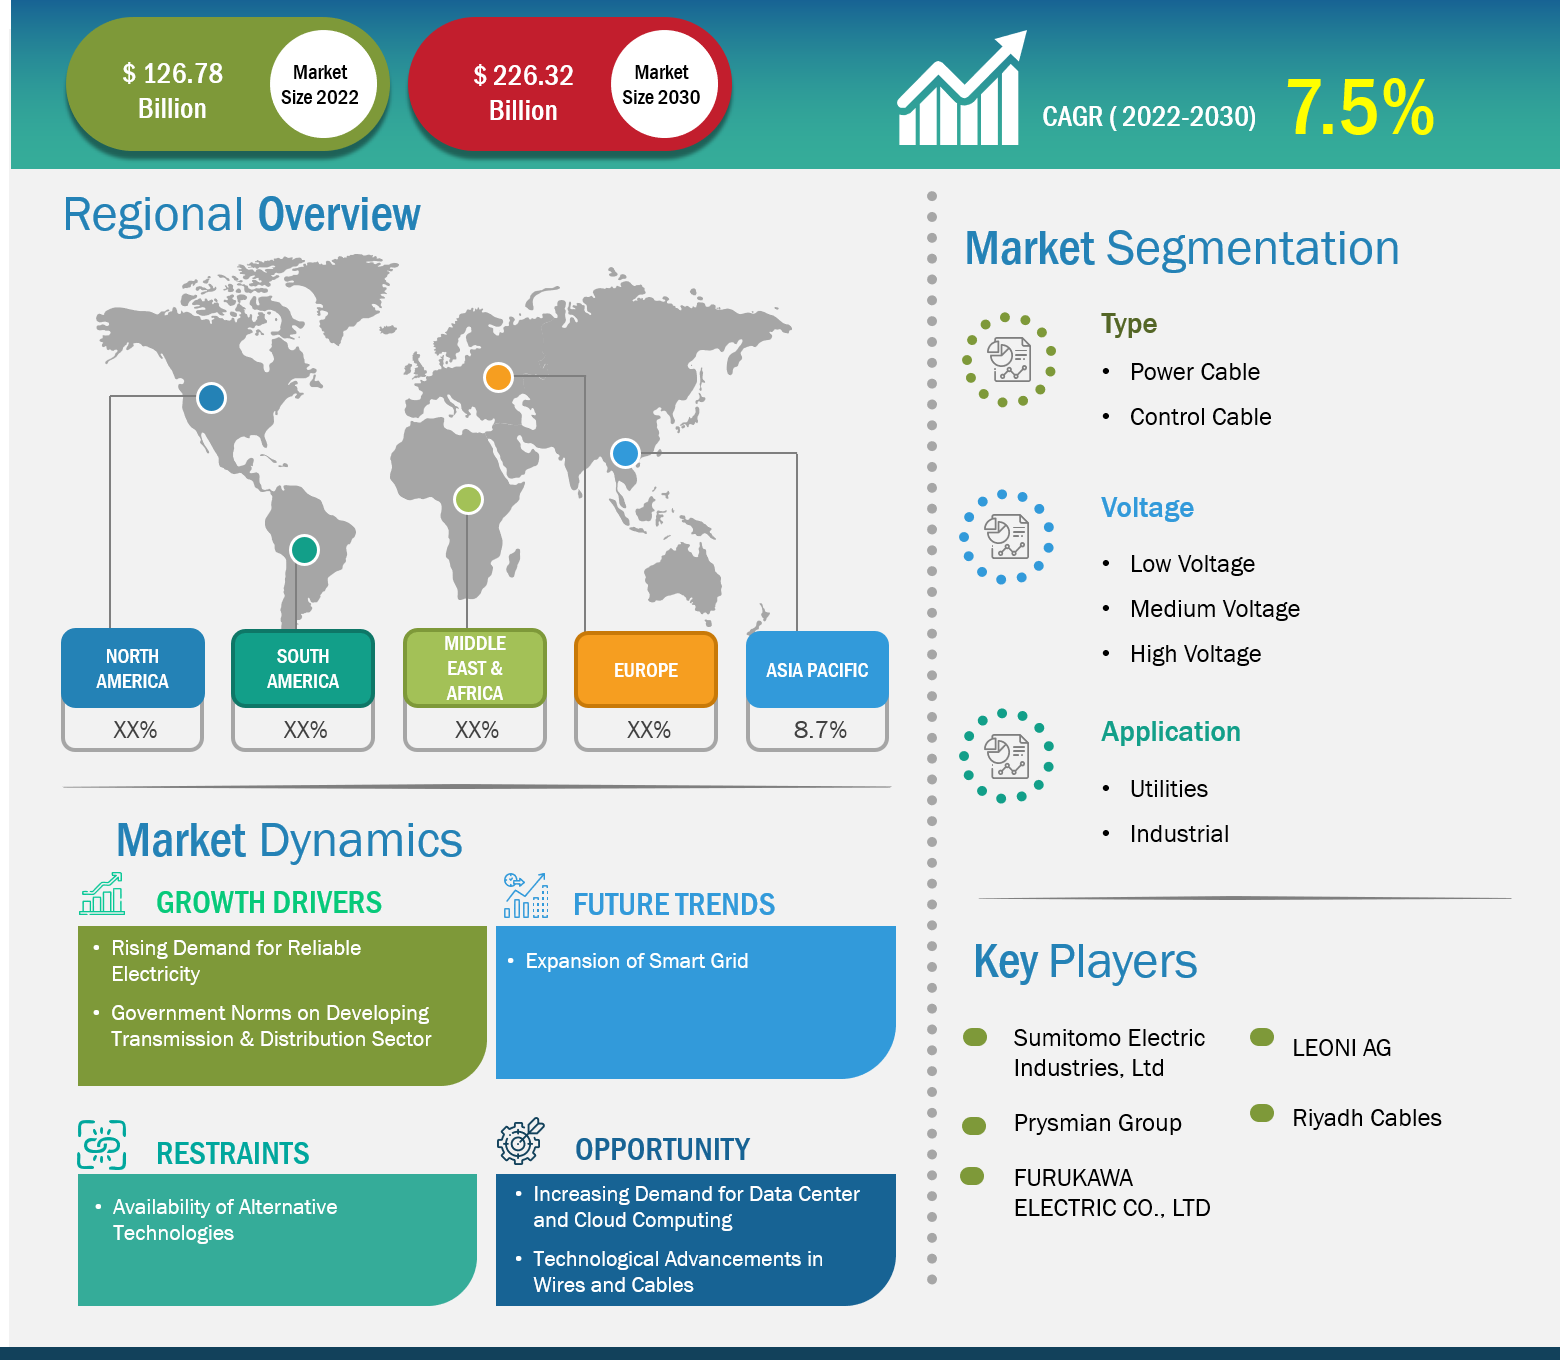
Market Size Value in US$ 126.78 billion in 2022 Market Size Value by US$ 226.32 billion by 2030 Growth rate CAGR of 7.5% from 2022 to 2030 Forecast Period 2022-2030 Base Year 2022

Naveen
Have a question?
Naveen will walk you through a 15-minute call to present the report’s content and answer all queries if you have any.
 Speak to Analyst
Customize Research To Suit Your Requirement
We can optimize and tailor the analysis and scope which is unmet through our standard offerings. This flexibility will help you gain the exact information needed for your business planning and decision making.
Power and Control Cable Market: Strategic Insights
| Market Size Value in | US$ 126.78 billion in 2022 |
| Market Size Value by | US$ 226.32 billion by 2030 |
| Growth rate | CAGR of 7.5% from 2022 to 2030 |
| Forecast Period | 2022-2030 |
| Base Year | 2022 |
Naveen
Have a question?
Naveen will walk you through a 15-minute call to present the report’s content and answer all queries if you have any.
Speak to Analyst
Power and Control Cable Market Drivers and Opportunities
Growing Adoption of Power and Control Cable in Electric Vehicles to Favor the Market
in August 2022, the Ministry of Economy, Trade and Industry of Japan estimated the necessity for an investment of over US$ 24 billion for developing a competitive manufacturing base for batteries used in electric vehicles (EVs) and energy storage systems. Increasing demand for EVs and government support towards the adoption of EVs is driving the market. In February 2023, the government of South Korea announced its plan to raise the number of subsidized EVs by 34%, from 160,000 units in 2022 to 215,000 cars in 2023. The growing demand for EVs is surging the need for charging infrastructure, thus promoting the need for power cables.
Government Investment in Energy Grid Projects
The growing number of industrial activities surges the demand for energy among industries and increases the adoption of power and control cables for appropriate energy transmission. The demand for energy encourages the government to take corrective steps in effective energy transmission. Following are several government investments to expand energy grid projects-
- In June 2023, the World Bank approved a US$ 268.4 million loan for the Tunisia-Italy interconnector (ELMED) project aimed at linking the energy grid of Tunisia with the European electricity network through a 600-megawatt undersea cable to Italy. The European Bank for Reconstruction and Development (EBRD), the European Investment Bank (EIB), and German state-owned bank—KfW will finance a portion of the US$ 1.08 billion project, and the Italian TSO Terna will finance the rest.
- In March 2023, Italian TSO Terna announced plans to invest more than US$ 22.2 billion in developing Italy’s energy grid over the next ten years. The investment announcement was part of Terna’s 2023 development plan for the national grid.
Moreover, increasing government investment in energy grid projects is creating opportunities in the market during the forecast period.
Power and Control Cable Market Report Segmentation Analysis
Key segments that contributed to the derivation of the power and control cable market analysis are type, voltage, and application.
- Based on type, the power and control cable market is divided into power cable and control cable. The power cable segment held a larger market share in 2022.
- By voltage, the market is segmented into high voltage, medium voltage, and low voltage. The low voltage segment held a larger market share in 2022.
- On the basis of application, the market is divided into utilities and industrial. The utilities segment held a larger market share in 2022.
Power and Control Cable Market Share Analysis by Geography
The geographic scope of the power and control cable market report is mainly divided into five regions: North America, Asia Pacific, Europe, Middle East & Africa, and South & Central America.
The market in Asia Pacific is projected to expand during the forecast period. In April 2023, the Government of India announced plans to expand from 4,25,500 circuit kilometers (ckm) (existing as of May 31, 2020) to 4,54,200 ckm by 2024–2025, resulting in an addition of ~28,700 ckm under the Gati Shakti Master Plan. The addition was proposed in the Interstate Transmission System (ISTS) network and for 220kV and above voltage levels. Similarly, in February 2023, state-owned Power Grid Corporation was awarded five interstate electricity transmission projects through a tariff-based competitive bidding route, which will be completed on the build, own, operate, and transfer (BOOT) basis. Hence, government initiatives for improving electricity transmission are boosting the market in the region.
Power and Control Cable Market Report Scope
Power and Control Cable Market News and Recent Developments
The power and control cable market is evaluated by gathering qualitative and quantitative data post primary and secondary research, which includes important corporate publications, association data, and databases. A few of the developments in the power and control cable market are listed below:
- Sumitomo Electric Industries, Ltd. announced a plan to establish a power cable factory in Scotland, UK. (Source: Sumitomo Electric Industries Ltd, Company Website, March 2023)
Power and Control Cable Market Report Coverage and Deliverables
The “Power and Control Cable Market Size and Forecast (2020–2030)” report provides a detailed analysis of the market covering below areas:
- Power and control cable market size and forecast at global, regional, and country levels for all the key market segments covered under the scope
- Power and control cable market trends as well as market dynamics such as drivers, restraints, and key opportunities
- Detailed PEST/Porter’s Five Forces and SWOT analysis
- Power and control cable market analysis covering key market trends, global and regional framework, major players, regulations, and recent market developments
- Industry landscape and competition analysis covering market concentration, heat map analysis, prominent players, and recent developments for the power and control cable market
- Detailed company profiles

Report Coverage
Revenue forecast, Company Analysis, Industry landscape, Growth factors, and Trends

Segment Covered
Type, Voltage, and Application

Regional Scope
North America, Europe, Asia Pacific, Middle East & Africa, South & Central America

Country Scope
This text is related
to country scope.
Frequently Asked Questions
The global power and control cable market is estimated to register a CAGR of 7.5% during the forecast period 2022–2030.
The key players holding majority shares in the global power and control cable market are Belden Inc, Encore Wire Corp, Furukawa Electric Co Ltd, HENGTONG GROUP CO., LTD, LEONI AG, Nexans SA, Prysmian SpA, Riyadh Cables Group Co, Southwire Company LLC, Sumitomo Electric Industries Ltd.
The global power and control cable market is expected to reach US$ 226.32 billion by 2030.
Asia Pacific dominated the power and control cable market in 2022.
The growing adoption of video analytics powered by computer vision and the rising adoption of the Industry 4.0 Concept are the major factors that propel the global power and control cable market.
Advancements in wires and cable to play a significant role in the global power and control cable market in the coming years.
1. Introduction
1.1 The Insight Partners Research Report Guidance
1.2 Market Segmentation
2. Executive Summary
2.1 Key Insights
2.2 Market Attractiveness
3. Research Methodology
3.1 Coverage
3.2 Secondary Research
3.3 Primary Research
4. Power and Control Cable Market Landscape
4.1 Overview
4.2 PEST Analysis
4.3 Ecosystem Analysis
4.3.1 Raw Material Providers:
4.3.2 Power and Control Cable Manufacturers:
4.3.3 Distributors:
4.3.4 End-Users:
4.3.5 Regulatory Bodies:
4.3.6 List of Vendors in the Value Chain:
5. Power and Control Cable Market - Key Industry Dynamics
5.1 Power and Control Cable Market - Key Industry Dynamics
5.2 Market Drivers
5.2.1 Rising Demand for Reliable Electricity
5.2.2 Government Norms on Developing Transmission & Distribution Sector
5.3 Market Restraints
5.3.1 Availability of Alternative Technologies
5.4 Market Opportunities
5.4.1 Increasing Demand for Data Center and Cloud Computing
5.4.2 Technological Advancements in Wires and Cables
5.5 Future Trends
5.5.1 Expansion of Smart Grid
5.6 Impact of Drivers and Restraints:
6. Power and Control Cable Market - Global Market Analysis
6.1 Power and Control Cable Market Revenue (US$ Million), 2022 – 2030
6.2 Power and Control Cable Market Forecast and Analysis
7. Power and Control Cable Market Analysis - Type
7.1 Power Cable
7.1.1 Overview
7.1.2 Power Cable Market Revenue, and Forecast to 2030 (US$ Million)
7.2 Control Cable
7.2.1 Overview
7.2.2 Control Cable Market Revenue, and Forecast to 2030 (US$ Million)
8. Power and Control Cable Market Analysis - Voltage
8.1 Low Voltage
8.1.1 Overview
8.1.2 Low Voltage Market Revenue, and Forecast to 2030 (US$ Million)
8.2 Medium Voltage
8.2.1 Overview
8.2.2 Medium Voltage Market Revenue, and Forecast to 2030 (US$ Million)
8.3 High Voltage
8.3.1 Overview
8.3.2 High Voltage Market Revenue, and Forecast to 2030 (US$ Million)
9. Power and Control Cable Market Analysis - Application
9.1 Utilities
9.1.1 Overview
9.1.2 Utilities Market Revenue, and Forecast to 2030 (US$ Million)
9.2 Industrial
9.2.1 Overview
9.2.2 Industrial Market Revenue, and Forecast to 2030 (US$ Million)
10. Power and Control Cable Market - Geographical Analysis
10.1 Overview
10.2 North America: Power and Control Cable Market
10.2.1 North America: Revenue, and Forecast to 2030 (US$ Million)
10.2.2 North America: Power and Control Cable Market, by Type
10.2.3 North America: Power and Control Cable Market, by Voltage
10.2.4 North America: Power and Control Cable Market, by Application
10.2.5 North America: Power and Control Cable Market, by Key Country
10.2.5.1 US: Power and Control Cable Market – Revenue, and Forecast to 2030 (US$ Million)
10.2.5.1.1 US: Power and Control Cable Market, by Type
10.2.5.1.2 US: Power and Control Cable Market, by Voltage
10.2.5.1.3 US: Power and Control Cable Market, by Application
10.2.5.2 Canada: Power and Control Cable Market – Revenue, and Forecast to 2030 (US$ Million)
10.2.5.2.1 Canada: Power and Control Cable Market, by Type
10.2.5.2.2 Canada: Power and Control Cable Market, by Voltage
10.2.5.2.3 Canada: Power and Control Cable Market, by Application
10.2.5.3 Mexico: Power and Control Cable Market – Revenue, and Forecast to 2030 (US$ Million)
10.2.5.3.1 Mexico: Power and Control Cable Market, by Type
10.2.5.3.2 Mexico: Power and Control Cable Market, by Voltage
10.2.5.3.3 Mexico: Power and Control Cable Market, by Application
10.3 Europe: Power and Control Cable Market
10.3.1 Europe: Revenue, and Forecast to 2030 (US$ Million)
10.3.2 Europe: Power and Control Cable Market, by Type
10.3.3 Europe: Power and Control Cable Market, by Voltage
10.3.4 Europe: Power and Control Cable Market, by Application
10.3.5 Europe: Power and Control Cable Market, by Key Country
10.3.5.1 Germany: Power and Control Cable Market – Revenue, and Forecast to 2030 (US$ Million)
10.3.5.1.1 Germany: Power and Control Cable Market, by Type
10.3.5.1.2 Germany: Power and Control Cable Market, by Voltage
10.3.5.1.3 Germany: Power and Control Cable Market, by Application
10.3.5.2 France: Power and Control Cable Market – Revenue, and Forecast to 2030 (US$ Million)
10.3.5.2.1 France: Power and Control Cable Market, by Type
10.3.5.2.2 France: Power and Control Cable Market, by Voltage
10.3.5.2.3 France: Power and Control Cable Market, by Application
10.3.5.3 Italy: Power and Control Cable Market – Revenue, and Forecast to 2030 (US$ Million)
10.3.5.3.1 Italy: Power and Control Cable Market, by Type
10.3.5.3.2 Italy: Power and Control Cable Market, by Voltage
10.3.5.3.3 Italy: Power and Control Cable Market, by Application
10.3.5.4 UK: Power and Control Cable Market – Revenue, and Forecast to 2030 (US$ Million)
10.3.5.4.1 UK: Power and Control Cable Market, by Type
10.3.5.4.2 UK: Power and Control Cable Market, by Voltage
10.3.5.4.3 UK: Power and Control Cable Market, by Application
10.3.5.5 Russia: Power and Control Cable Market – Revenue, and Forecast to 2030 (US$ Million)
10.3.5.5.1 Russia: Power and Control Cable Market, by Type
10.3.5.5.2 Russia: Power and Control Cable Market, by Voltage
10.3.5.5.3 Russia: Power and Control Cable Market, by Application
10.3.5.6 Rest of Europe: Power and Control Cable Market – Revenue, and Forecast to 2030 (US$ Million)
10.3.5.6.1 Rest of Europe: Power and Control Cable Market, by Type
10.3.5.6.2 Rest of Europe: Power and Control Cable Market, by Voltage
10.3.5.6.3 Rest of Europe: Power and Control Cable Market, by Application
10.4 Asia Pacific: Power and Control Cable Market
10.4.1 Asia Pacific: Revenue, and Forecast to 2030 (US$ Million)
10.4.2 Asia Pacific: Power and Control Cable Market, by Type
10.4.3 Asia Pacific: Power and Control Cable Market, by Voltage
10.4.4 Asia Pacific: Power and Control Cable Market, by Application
10.4.5 Asia Pacific: Power and Control Cable Market, by Key Country
10.4.5.1 Australia: Power and Control Cable Market – Revenue, and Forecast to 2030 (US$ Million)
10.4.5.1.1 Australia: Power and Control Cable Market, by Type
10.4.5.1.2 Australia: Power and Control Cable Market, by Voltage
10.4.5.1.3 Australia: Power and Control Cable Market, by Application
10.4.5.2 China: Power and Control Cable Market – Revenue, and Forecast to 2030 (US$ Million)
10.4.5.2.1 China: Power and Control Cable Market, by Type
10.4.5.2.2 China: Power and Control Cable Market, by Voltage
10.4.5.2.3 China: Power and Control Cable Market, by Application
10.4.5.3 India: Power and Control Cable Market – Revenue, and Forecast to 2030 (US$ Million)
10.4.5.3.1 India: Power and Control Cable Market, by Type
10.4.5.3.2 India: Power and Control Cable Market, by Voltage
10.4.5.3.3 India: Power and Control Cable Market, by Application
10.4.5.4 Japan: Power and Control Cable Market – Revenue, and Forecast to 2030 (US$ Million)
10.4.5.4.1 Japan: Power and Control Cable Market, by Type
10.4.5.4.2 Japan: Power and Control Cable Market, by Voltage
10.4.5.4.3 Japan: Power and Control Cable Market, by Application
10.4.5.5 South Korea: Power and Control Cable Market – Revenue, and Forecast to 2030 (US$ Million)
10.4.5.5.1 South Korea: Power and Control Cable Market, by Type
10.4.5.5.2 South Korea: Power and Control Cable Market, by Voltage
10.4.5.5.3 South Korea: Power and Control Cable Market, by Application
10.4.5.6 Rest of Asia Pacific: Power and Control Cable Market – Revenue, and Forecast to 2030 (US$ Million)
10.4.5.6.1 Rest of Asia Pacific: Power and Control Cable Market, by Type
10.4.5.6.2 Rest of Asia Pacific: Power and Control Cable Market, by Voltage
10.4.5.6.3 Rest of Asia Pacific: Power and Control Cable Market, by Application
10.5 MEA: Power and Control Cable Market
10.5.1 MEA: Revenue, and Forecast to 2030 (US$ Million)
10.5.2 MEA: Power and Control Cable Market, by Type
10.5.3 MEA: Power and Control Cable Market, by Voltage
10.5.4 MEA: Power and Control Cable Market, by Application
10.5.5 MEA: Power and Control Cable Market, by Key Country
10.5.5.1 South Africa: Power and Control Cable Market – Revenue, and Forecast to 2030 (US$ Million)
10.5.5.1.1 South Africa: Power and Control Cable Market, by Type
10.5.5.1.2 South Africa: Power and Control Cable Market, by Voltage
10.5.5.1.3 South Africa: Power and Control Cable Market, by Application
10.5.5.2 Saudi Arabia: Power and Control Cable Market – Revenue, and Forecast to 2030 (US$ Million)
10.5.5.2.1 Saudi Arabia: Power and Control Cable Market, by Type
10.5.5.2.2 Saudi Arabia: Power and Control Cable Market, by Voltage
10.5.5.2.3 Saudi Arabia: Power and Control Cable Market, by Application
10.5.5.3 UAE: Power and Control Cable Market – Revenue, and Forecast to 2030 (US$ Million)
10.5.5.3.1 UAE: Power and Control Cable Market, by Type
10.5.5.3.2 UAE: Power and Control Cable Market, by Voltage
10.5.5.3.3 UAE: Power and Control Cable Market, by Application
10.5.5.4 Rest of MEA: Power and Control Cable Market – Revenue, and Forecast to 2030 (US$ Million)
10.5.5.4.1 Rest of MEA: Power and Control Cable Market, by Type
10.5.5.4.2 Rest of MEA: Power and Control Cable Market, by Voltage
10.5.5.4.3 Rest of MEA: Power and Control Cable Market, by Application
10.6 SAM: Power and Control Cable Market
10.6.1 SAM: Revenue, and Forecast to 2030 (US$ Million)
10.6.2 SAM: Power and Control Cable Market, by Type
10.6.3 SAM: Power and Control Cable Market, by Voltage
10.6.4 SAM: Power and Control Cable Market, by Application
10.6.5 SAM: Power and Control Cable Market, by Key Country
10.6.5.1 Brazil: Power and Control Cable Market – Revenue, and Forecast to 2030 (US$ Million)
10.6.5.1.1 Brazil: Power and Control Cable Market, by Type
10.6.5.1.2 Brazil: Power and Control Cable Market, by Voltage
10.6.5.1.3 Brazil: Power and Control Cable Market, by Application
10.6.5.2 Argentina: Power and Control Cable Market – Revenue, and Forecast to 2030 (US$ Million)
10.6.5.2.1 Argentina: Power and Control Cable Market, by Type
10.6.5.2.2 Argentina: Power and Control Cable Market, by Voltage
10.6.5.2.3 Argentina: Power and Control Cable Market, by Application
10.6.5.3 Rest of SAM: Power and Control Cable Market – Revenue, and Forecast to 2030 (US$ Million)
10.6.5.3.1 Rest of SAM: Power and Control Cable Market, by Type
10.6.5.3.2 Rest of SAM: Power and Control Cable Market, by Voltage
10.6.5.3.3 Rest of SAM: Power and Control Cable Market, by Application
11. Power and Control Cable Market – Impact of COVID-19 Pandemic
11.1 Pre & Post Covid-19 Impact
12. Competitive Landscape
12.1 Heat Map Analysis By Key Players
12.2 Company Positioning & Concentration
13. Industry Landscape
13.1 Overview
13.2 Market Initiative
14. Company Profiles
14.1 Belden Inc
14.1.1 Key Facts
14.1.2 Business Description
14.1.3 Products and Services
14.1.4 Financial Overview
14.1.5 SWOT Analysis
14.1.6 Key Developments
14.2 Encore Wire Corp
14.2.1 Key Facts
14.2.2 Business Description
14.2.3 Products and Services
14.2.4 Financial Overview
14.2.5 SWOT Analysis
14.2.6 Key Developments
14.3 Furukawa Electric Co Ltd
14.3.1 Key Facts
14.3.2 Business Description
14.3.3 Products and Services
14.3.4 Financial Overview
14.3.5 SWOT Analysis
14.3.6 Key Developments
14.4 HENGTONG GROUP CO.,LTD.
14.4.1 Key Facts
14.4.2 Business Description
14.4.3 Products and Services
14.4.4 Financial Overview
14.4.5 SWOT Analysis
14.4.6 Key Developments
14.5 LEONI AG
14.5.1 Key Facts
14.5.2 Business Description
14.5.3 Products and Services
14.5.4 Financial Overview
14.5.5 SWOT Analysis
14.5.6 Key Developments
14.6 Nexans SA
14.6.1 Key Facts
14.6.2 Business Description
14.6.3 Products and Services
14.6.4 Financial Overview
14.6.5 SWOT Analysis
14.6.6 Key Developments
14.7 Prysmian SpA
14.7.1 Key Facts
14.7.2 Business Description
14.7.3 Products and Services
14.7.4 Financial Overview
14.7.5 SWOT Analysis
14.7.6 Key Developments
14.8 Riyadh Cables Group Co
14.8.1 Key Facts
14.8.2 Business Description
14.8.3 Products and Services
14.8.4 Financial Overview
14.8.5 SWOT Analysis
14.8.6 Key Developments
14.9 Southwire Company LLC
14.9.1 Key Facts
14.9.2 Business Description
14.9.3 Products and Services
14.9.4 Financial Overview
14.9.5 SWOT Analysis
14.9.6 Key Developments
14.10 Sumitomo Electric Industries Ltd
14.10.1 Key Facts
14.10.2 Business Description
14.10.3 Products and Services
14.10.4 Financial Overview
14.10.5 SWOT Analysis
14.10.6 Key Developments
15. Appendix
15.1 About The Insight Partners
15.2 Word Index
List of Tables
Table 1. Power and Control Cable Market Segmentation
Table 2. Power and Control Cable Market Revenue and Forecasts To 2030 (US$ Million)
Table 3. Power and Control Cable Market Revenue and Forecasts To 2030 (US$ Million) –Type
Table 4. Power and Control Cable Market Revenue and Forecasts To 2030 (US$ Million) – Voltage
Table 5. Power and Control Cable Market Revenue and Forecasts To 2030 (US$ Million) – Application
Table 6. North America: Power and Control Cable Market, by Type – Revenue and Forecast to 2030 (US$ Million)
Table 7. North America: Power and Control Cable Market, by Voltage – Revenue and Forecast to 2030 (US$ Million)
Table 8. North America: Power and Control Cable Market, by Application – Revenue and Forecast to 2030 (US$ Million)
Table 9. US: Power and Control Cable Market, by Type –Revenue and Forecast to 2030 (US$ Million)
Table 10. US: Power and Control Cable Market, by Voltage –Revenue and Forecast to 2030 (US$ Million)
Table 11. US: Power and Control Cable Market, by Application –Revenue and Forecast to 2030 (US$ Million)
Table 12. Canada: Power and Control Cable Market, by Type –Revenue and Forecast to 2030 (US$ Million)
Table 13. Canada: Power and Control Cable Market, by Voltage –Revenue and Forecast to 2030 (US$ Million)
Table 14. Canada: Power and Control Cable Market, by Application –Revenue and Forecast to 2030 (US$ Million)
Table 15. Mexico: Power and Control Cable Market, by Type –Revenue and Forecast to 2030 (US$ Million)
Table 16. Mexico: Power and Control Cable Market, by Voltage –Revenue and Forecast to 2030 (US$ Million)
Table 17. Mexico: Power and Control Cable Market, by Application –Revenue and Forecast to 2030 (US$ Million)
Table 18. Europe: Power and Control Cable Market, by Type – Revenue and Forecast to 2030 (US$ Million)
Table 19. Europe: Power and Control Cable Market, by Voltage – Revenue and Forecast to 2030 (US$ Million)
Table 20. Europe: Power and Control Cable Market, by Application – Revenue and Forecast to 2030 (US$ Million)
Table 21. Germany: Power and Control Cable Market, by Type –Revenue and Forecast to 2030 (US$ Million)
Table 22. Germany: Power and Control Cable Market, by Voltage –Revenue and Forecast to 2030 (US$ Million)
Table 23. Germany: Power and Control Cable Market, by Application –Revenue and Forecast to 2030 (US$ Million)
Table 24. France: Power and Control Cable Market, by Type –Revenue and Forecast to 2030 (US$ Million)
Table 25. France: Power and Control Cable Market, by Voltage –Revenue and Forecast to 2030 (US$ Million)
Table 26. France: Power and Control Cable Market, by Application –Revenue and Forecast to 2030 (US$ Million)
Table 27. Italy: Power and Control Cable Market, by Type –Revenue and Forecast to 2030 (US$ Million)
Table 28. Italy: Power and Control Cable Market, by Voltage –Revenue and Forecast to 2030 (US$ Million)
Table 29. Italy: Power and Control Cable Market, by Application –Revenue and Forecast to 2030 (US$ Million)
Table 30. UK: Power and Control Cable Market, by Type –Revenue and Forecast to 2030 (US$ Million)
Table 31. UK: Power and Control Cable Market, by Voltage –Revenue and Forecast to 2030 (US$ Million)
Table 32. UK: Power and Control Cable Market, by Application –Revenue and Forecast to 2030 (US$ Million)
Table 33. Russia: Power and Control Cable Market, by Type –Revenue and Forecast to 2030 (US$ Million)
Table 34. Russia: Power and Control Cable Market, by Voltage –Revenue and Forecast to 2030 (US$ Million)
Table 35. Russia: Power and Control Cable Market, by Application –Revenue and Forecast to 2030 (US$ Million)
Table 36. Rest of Europe: Power and Control Cable Market, by Type –Revenue and Forecast to 2030 (US$ Million)
Table 37. Rest of Europe: Power and Control Cable Market, by Voltage –Revenue and Forecast to 2030 (US$ Million)
Table 38. Rest of Europe: Power and Control Cable Market, by Application –Revenue and Forecast to 2030 (US$ Million)
Table 39. Asia Pacific: Power and Control Cable Market, by Type – Revenue and Forecast to 2030 (US$ Million)
Table 40. Asia Pacific: Power and Control Cable Market, by Voltage – Revenue and Forecast to 2030 (US$ Million)
Table 41. Asia Pacific: Power and Control Cable Market, by Application – Revenue and Forecast to 2030 (US$ Million)
Table 42. Australia: Power and Control Cable Market, by Type –Revenue and Forecast to 2030 (US$ Million)
Table 43. Australia: Power and Control Cable Market, by Voltage –Revenue and Forecast to 2030 (US$ Million)
Table 44. Australia: Power and Control Cable Market, by Application –Revenue and Forecast to 2030 (US$ Million)
Table 45. China: Power and Control Cable Market, by Type –Revenue and Forecast to 2030 (US$ Million)
Table 46. China: Power and Control Cable Market, by Voltage –Revenue and Forecast to 2030 (US$ Million)
Table 47. China: Power and Control Cable Market, by Application –Revenue and Forecast to 2030 (US$ Million)
Table 48. India: Power and Control Cable Market, by Type –Revenue and Forecast to 2030 (US$ Million)
Table 49. India: Power and Control Cable Market, by Voltage –Revenue and Forecast to 2030 (US$ Million)
Table 50. India: Power and Control Cable Market, by Application –Revenue and Forecast to 2030 (US$ Million)
Table 51. Japan: Power and Control Cable Market, by Type –Revenue and Forecast to 2030 (US$ Million)
Table 52. Japan: Power and Control Cable Market, by Voltage –Revenue and Forecast to 2030 (US$ Million)
Table 53. Japan: Power and Control Cable Market, by Application –Revenue and Forecast to 2030 (US$ Million)
Table 54. South Korea: Power and Control Cable Market, by Type –Revenue and Forecast to 2030 (US$ Million)
Table 55. South Korea: Power and Control Cable Market, by Voltage –Revenue and Forecast to 2030 (US$ Million)
Table 56. South Korea: Power and Control Cable Market, by Application –Revenue and Forecast to 2030 (US$ Million)
Table 57. Rest of Asia Pacific: Power and Control Cable Market, by Type –Revenue and Forecast to 2030 (US$ Million)
Table 58. Rest of Asia Pacific: Power and Control Cable Market, by Voltage –Revenue and Forecast to 2030 (US$ Million)
Table 59. Rest of Asia Pacific: Power and Control Cable Market, by Application –Revenue and Forecast to 2030 (US$ Million)
Table 60. MEA: Power and Control Cable Market, by Type – Revenue and Forecast to 2030 (US$ Million)
Table 61. MEA: Power and Control Cable Market, by Voltage – Revenue and Forecast to 2030 (US$ Million)
Table 62. MEA: Power and Control Cable Market, by Application – Revenue and Forecast to 2030 (US$ Million)
Table 63. South Africa: Power and Control Cable Market, by Type –Revenue and Forecast to 2030 (US$ Million)
Table 64. South Africa: Power and Control Cable Market, by Voltage –Revenue and Forecast to 2030 (US$ Million)
Table 65. South Africa: Power and Control Cable Market, by Application –Revenue and Forecast to 2030 (US$ Million)
Table 66. Saudi Arabia: Power and Control Cable Market, by Type –Revenue and Forecast to 2030 (US$ Million)
Table 67. Saudi Arabia: Power and Control Cable Market, by Voltage –Revenue and Forecast to 2030 (US$ Million)
Table 68. Saudi Arabia: Power and Control Cable Market, by Application –Revenue and Forecast to 2030 (US$ Million)
Table 69. UAE: Power and Control Cable Market, by Type –Revenue and Forecast to 2030 (US$ Million)
Table 70. UAE: Power and Control Cable Market, by Voltage –Revenue and Forecast to 2030 (US$ Million)
Table 71. UAE: Power and Control Cable Market, by Application –Revenue and Forecast to 2030 (US$ Million)
Table 72. Rest of MEA: Power and Control Cable Market, by Type –Revenue and Forecast to 2030 (US$ Million)
Table 73. Rest of MEA: Power and Control Cable Market, by Voltage –Revenue and Forecast to 2030 (US$ Million)
Table 74. Rest of MEA: Power and Control Cable Market, by Application –Revenue and Forecast to 2030 (US$ Million)
Table 75. SAM: Power and Control Cable Market, by Type – Revenue and Forecast to 2030 (US$ Million)
Table 76. SAM: Power and Control Cable Market, by Voltage – Revenue and Forecast to 2030 (US$ Million)
Table 77. SAM: Power and Control Cable Market, by Application – Revenue and Forecast to 2030 (US$ Million)
Table 78. Brazil: Power and Control Cable Market, by Type –Revenue and Forecast to 2030 (US$ Million)
Table 79. Brazil: Power and Control Cable Market, by Voltage –Revenue and Forecast to 2030 (US$ Million)
Table 80. Brazil: Power and Control Cable Market, by Application –Revenue and Forecast to 2030 (US$ Million)
Table 81. Argentina: Power and Control Cable Market, by Type –Revenue and Forecast to 2030 (US$ Million)
Table 82. Argentina: Power and Control Cable Market, by Voltage –Revenue and Forecast to 2030 (US$ Million)
Table 83. Argentina: Power and Control Cable Market, by Application –Revenue and Forecast to 2030 (US$ Million)
Table 84. Rest of SAM: Power and Control Cable Market, by Type –Revenue and Forecast to 2030 (US$ Million)
Table 85. Rest of SAM: Power and Control Cable Market, by Voltage –Revenue and Forecast to 2030 (US$ Million)
Table 86. Rest of SAM: Power and Control Cable Market, by Application –Revenue and Forecast to 2030 (US$ Million)
Table 87. Heat Map Analysis By Key Players
Table 88. List of Abbreviation
List of Figures
Figure 1. Power and Control Cable Market Segmentation, By Geography
Figure 2. PEST Analysis
Figure 3. Ecosystem: Power and Control Cable Market
Figure 4. Impact Analysis of Drivers and Restraints
Figure 5. Power and Control Cable Market Breakdown by Geography, 2022 and 2030 (%)
Figure 6. Power and Control Cable Market Revenue (US$ Million), 2022 – 2030
Figure 7. Power and Control Cable Market Share (%) –Type, 2022 and 2030
Figure 8. Power Cable Market Revenue and Forecasts To 2030 (US$ Million)
Figure 9. Control Cable Market Revenue and Forecasts To 2030 (US$ Million)
Figure 10. Power and Control Cable Market Share (%) – Voltage, 2022 and 2030
Figure 11. Low Voltage Market Revenue and Forecasts To 2030 (US$ Million)
Figure 12. Medium Voltage Market Revenue and Forecasts To 2030 (US$ Million)
Figure 13. High Voltage Market Revenue and Forecasts To 2030 (US$ Million)
Figure 14. Power and Control Cable Market Share (%) – Application, 2022 and 2030
Figure 15. Utilities Market Revenue and Forecasts To 2030 (US$ Million)
Figure 16. Industrial Market Revenue and Forecasts To 2030 (US$ Million)
Figure 17. Power and Control Cable Market Breakdown by Region, 2022 and 2030 (%)
Figure 18. North America: Power and Control Cable Market – Revenue and Forecast to 2030 (US$ Million)
Figure 19. North America: Power and Control Cable Market Revenue Share, by Type (2022 and 2030)
Figure 20. North America: Power and Control Cable Market Revenue Share, by Voltage (2022 and 2030)
Figure 21. North America: Power and Control Cable Market Revenue Share, by Application (2022 and 2030)
Figure 22. North America: Power and Control Cable Market Revenue Share, by Key Country (2022 and 2030)
Figure 23. US: Power and Control Cable Market – Revenue, and Forecast to 2030 (US$ Million)
Figure 24. Canada: Power and Control Cable Market – Revenue, and Forecast to 2030 (US$ Million)
Figure 25. Mexico: Power and Control Cable Market – Revenue, and Forecast to 2030 (US$ Million)
Figure 26. Europe: Power and Control Cable Market – Revenue and Forecast to 2030 (US$ Million)
Figure 27. Europe: Power and Control Cable Market Revenue Share, by Type (2022 and 2030)
Figure 28. Europe: Power and Control Cable Market Revenue Share, by Voltage (2022 and 2030)
Figure 29. Europe: Power and Control Cable Market Revenue Share, by Application (2022 and 2030)
Figure 30. Europe: Power and Control Cable Market Revenue Share, by Key Country (2022 and 2030)
Figure 31. Germany: Power and Control Cable Market – Revenue, and Forecast to 2030 (US$ Million)
Figure 32. France: Power and Control Cable Market – Revenue, and Forecast to 2030 (US$ Million)
Figure 33. Italy: Power and Control Cable Market – Revenue, and Forecast to 2030 (US$ Million)
Figure 34. UK: Power and Control Cable Market – Revenue, and Forecast to 2030 (US$ Million)
Figure 35. Russia: Power and Control Cable Market – Revenue, and Forecast to 2030 (US$ Million)
Figure 36. Rest of Europe: Power and Control Cable Market – Revenue, and Forecast to 2030 (US$ Million)
Figure 37. Asia Pacific: Power and Control Cable Market – Revenue and Forecast to 2030 (US$ Million)
Figure 38. Asia Pacific: Power and Control Cable Market Revenue Share, by Type (2022 and 2030)
Figure 39. Asia Pacific: Power and Control Cable Market Revenue Share, by Voltage (2022 and 2030)
Figure 40. Asia Pacific: Power and Control Cable Market Revenue Share, by Application (2022 and 2030)
Figure 41. Asia Pacific: Power and Control Cable Market Revenue Share, by Key Country (2022 and 2030)
Figure 42. ustralia: Power and Control Cable Market – Revenue, and Forecast to 2030 (US$ Million)
Figure 43. China: Power and Control Cable Market – Revenue, and Forecast to 2030 (US$ Million)
Figure 44. India: Power and Control Cable Market – Revenue, and Forecast to 2030 (US$ Million)
Figure 45. Japan: Power and Control Cable Market – Revenue, and Forecast to 2030 (US$ Million)
Figure 46. South Korea: Power and Control Cable Market – Revenue, and Forecast to 2030 (US$ Million)
Figure 47. Rest of Asia Pacific: Power and Control Cable Market – Revenue, and Forecast to 2030 (US$ Million)
Figure 48. MEA: Power and Control Cable Market – Revenue and Forecast to 2030 (US$ Million)
Figure 49. MEA: Power and Control Cable Market Revenue Share, by Type (2022 and 2030)
Figure 50. MEA: Power and Control Cable Market Revenue Share, by Voltage (2022 and 2030)
Figure 51. MEA: Power and Control Cable Market Revenue Share, by Application (2022 and 2030)
Figure 52. MEA: Power and Control Cable Market Revenue Share, by Key Country (2022 and 2030)
Figure 53. South Africa: Power and Control Cable Market – Revenue, and Forecast to 2030 (US$ Million)
Figure 54. Saudi Arabia: Power and Control Cable Market – Revenue, and Forecast to 2030 (US$ Million)
Figure 55. UAE: Power and Control Cable Market – Revenue, and Forecast to 2030 (US$ Million)
Figure 56. Rest of MEA: Power and Control Cable Market – Revenue, and Forecast to 2030 (US$ Million)
Figure 57. SAM: Power and Control Cable Market – Revenue and Forecast to 2030 (US$ Million)
Figure 58. SAM: Power and Control Cable Market Revenue Share, by Type (2022 and 2030)
Figure 59. SAM: Power and Control Cable Market Revenue Share, by Voltage (2022 and 2030)
Figure 60. SAM: Power and Control Cable Market Revenue Share, by Application (2022 and 2030)
Figure 61. SAM: Power and Control Cable Market Revenue Share, by Key Country (2022 and 2030)
Figure 62. Brazil: Power and Control Cable Market – Revenue, and Forecast to 2030 (US$ Million)
Figure 63. Argentina: Power and Control Cable Market – Revenue, and Forecast to 2030 (US$ Million)
Figure 64. Rest of SAM: Power and Control Cable Market – Revenue, and Forecast to 2030 (US$ Million)
Figure 65. Company Positioning & Concentration
The List of Companies - Power and Control Cable Market
- Belden Inc
- Encore Wire Corp
- Furukawa Electric Co Ltd
- HENGTONG GROUP CO., LTD
- LEONI AG
- Nexans SA
- Prysmian SpA
- Riyadh Cables Group
- Southwire Company LLC
- Sumitomo Electric Industries Ltd
The Insight Partners performs research in 4 major stages: Data Collection & Secondary Research, Primary Research, Data Analysis and Data Triangulation & Final Review.
- Data Collection and Secondary Research:
As a market research and consulting firm operating from a decade, we have published many reports and advised several clients across the globe. First step for any study will start with an assessment of currently available data and insights from existing reports. Further, historical and current market information is collected from Investor Presentations, Annual Reports, SEC Filings, etc., and other information related to company’s performance and market positioning are gathered from Paid Databases (Factiva, Hoovers, and Reuters) and various other publications available in public domain.
Several associations trade associates, technical forums, institutes, societies and organizations are accessed to gain technical as well as market related insights through their publications such as research papers, blogs and press releases related to the studies are referred to get cues about the market. Further, white papers, journals, magazines, and other news articles published in the last 3 years are scrutinized and analyzed to understand the current market trends.
- Primary Research:
The primarily interview analysis comprise of data obtained from industry participants interview and answers to survey questions gathered by in-house primary team.
For primary research, interviews are conducted with industry experts/CEOs/Marketing Managers/Sales Managers/VPs/Subject Matter Experts from both demand and supply side to get a 360-degree view of the market. The primary team conducts several interviews based on the complexity of the markets to understand the various market trends and dynamics which makes research more credible and precise.
A typical research interview fulfils the following functions:
- Provides first-hand information on the market size, market trends, growth trends, competitive landscape, and outlook
- Validates and strengthens in-house secondary research findings
- Develops the analysis team’s expertise and market understanding
Primary research involves email interactions and telephone interviews for each market, category, segment, and sub-segment across geographies. The participants who typically take part in such a process include, but are not limited to:
- Industry participants: VPs, business development managers, market intelligence managers and national sales managers
- Outside experts: Valuation experts, research analysts and key opinion leaders specializing in the electronics and semiconductor industry.
Below is the breakup of our primary respondents by company, designation, and region:

Once we receive the confirmation from primary research sources or primary respondents, we finalize the base year market estimation and forecast the data as per the macroeconomic and microeconomic factors assessed during data collection.
- Data Analysis:
Once data is validated through both secondary as well as primary respondents, we finalize the market estimations by hypothesis formulation and factor analysis at regional and country level.
- 3.1 Macro-Economic Factor Analysis:
We analyse macroeconomic indicators such the gross domestic product (GDP), increase in the demand for goods and services across industries, technological advancement, regional economic growth, governmental policies, the influence of COVID-19, PEST analysis, and other aspects. This analysis aids in setting benchmarks for various nations/regions and approximating market splits. Additionally, the general trend of the aforementioned components aid in determining the market's development possibilities.
- 3.2 Country Level Data:
Various factors that are especially aligned to the country are taken into account to determine the market size for a certain area and country, including the presence of vendors, such as headquarters and offices, the country's GDP, demand patterns, and industry growth. To comprehend the market dynamics for the nation, a number of growth variables, inhibitors, application areas, and current market trends are researched. The aforementioned elements aid in determining the country's overall market's growth potential.
- 3.3 Company Profile:
The “Table of Contents” is formulated by listing and analyzing more than 25 - 30 companies operating in the market ecosystem across geographies. However, we profile only 10 companies as a standard practice in our syndicate reports. These 10 companies comprise leading, emerging, and regional players. Nonetheless, our analysis is not restricted to the 10 listed companies, we also analyze other companies present in the market to develop a holistic view and understand the prevailing trends. The “Company Profiles” section in the report covers key facts, business description, products & services, financial information, SWOT analysis, and key developments. The financial information presented is extracted from the annual reports and official documents of the publicly listed companies. Upon collecting the information for the sections of respective companies, we verify them via various primary sources and then compile the data in respective company profiles. The company level information helps us in deriving the base number as well as in forecasting the market size.
- 3.4 Developing Base Number:
Aggregation of sales statistics (2020-2022) and macro-economic factor, and other secondary and primary research insights are utilized to arrive at base number and related market shares for 2022. The data gaps are identified in this step and relevant market data is analyzed, collected from paid primary interviews or databases. On finalizing the base year market size, forecasts are developed on the basis of macro-economic, industry and market growth factors and company level analysis.
- Data Triangulation and Final Review:
The market findings and base year market size calculations are validated from supply as well as demand side. Demand side validations are based on macro-economic factor analysis and benchmarks for respective regions and countries. In case of supply side validations, revenues of major companies are estimated (in case not available) based on industry benchmark, approximate number of employees, product portfolio, and primary interviews revenues are gathered. Further revenue from target product/service segment is assessed to avoid overshooting of market statistics. In case of heavy deviations between supply and demand side values, all thes steps are repeated to achieve synchronization.
We follow an iterative model, wherein we share our research findings with Subject Matter Experts (SME’s) and Key Opinion Leaders (KOLs) until consensus view of the market is not formulated – this model negates any drastic deviation in the opinions of experts. Only validated and universally acceptable research findings are quoted in our reports.
We have important check points that we use to validate our research findings – which we call – data triangulation, where we validate the information, we generate from secondary sources with primary interviews and then we re-validate with our internal data bases and Subject matter experts. This comprehensive model enables us to deliver high quality, reliable data in shortest possible time.
Trends and growth analysis reports related to Power and Control Cable Market

Sep 2023
Remote Access Solution Market
Size and Forecast (2021 - 2031), Global and Regional Share, Trend, and Growth Opportunity Analysis Report Coverage: By Type [Secure Remote Access-VPN, Identity and Access Management (IAM) Solutions, Multi-Factor Authentication, Single Sign-On (SSO), Endpoint Security, and Others], Mode of Deployment (Cloud and On-Premise), End-Use Industry (IT and Telecommunications, BFSI, Healthcare, Government, Manufacturing, and Others), and Geography
Sep 2023
Hall Effect Teslameter Market
Size and Forecast (2021 - 2031), Global and Regional Share, Trend, and Growth Opportunity Analysis Report Coverage: By Type (Analog Hall Effect Teslameters and Digital Hall Effect Teslameters), End Users (Automotive, Industrial, Healthcare, Aerospace, Laboratory, and Others), and Geography
Sep 2023
Automotive Board to Board Connector Market
Size and Forecast (2021 - 2031), Global and Regional Share, Trend, and Growth Opportunity Analysis Report Coverage: By Type (Pin Headers, Sockets, Floating Connector, and Card Edge Connector), Pin Headers (Stacked Headers and Shrouded Headers), Application (Powertrain Control Systems, Infotainment and Navigation Systems, Advanced Driver Assistance Systems (ADAS), Electric Vehicles (EV) and Hybrid Vehicle Systems, Lighting Control Systems, Autonomous Vehicles, and Others), Pitch (Less Than 1 mm, 1–2 mm, and More Than 2 mm), Number of Pin (2–12 Pin, 13–30 Pin, 31–50 Pin, 51–100 Pin, and 100+ Pin), and Geography
Sep 2023
Radiation Hardened Motor Controller and Motor Drive Market
Size and Forecast (2021 - 2031), Global and Regional Share, Trend, and Growth Opportunity Analysis Report Coverage: By Type (Motor Controller and Motor Drive), Motor Drive (AC Drive, DC Drive, and BLDC), Application (Space Exploration, Military and Defense, Nuclear Power Plants, and Others), and Geography
Sep 2023
Pluggable Optics for Data Center Market
Size and Forecast (2021 - 2031), Global and Regional Share, Trend, and Growth Opportunity Analysis Report Coverage: By Component (Switches, Routers, and Servers), Data Rate (100–400 Gb/s, 400–800 Gb/s, and 800 Gb/s and above), and Geography
Sep 2023
Doors and Windows Automation Market
Size and Forecast (2021–2031), Global and Regional Share, Trend, and Growth Opportunity Analysis Report Coverage: By Type (Pedestrian Doors, Industrial Doors, and Windows), Component (Sensors and Detectors, Access Control Systems, Control Panels, Motors and Actuators, and Others), Industry Vertical (Commercial, Industrial, and Residential), Control System (Fully Automatic, Semi-Automatic, and Power Assist), and Geography
Sep 2023
Substrate-Like PCB Market
Size and Forecast (2021 - 2031), Global and Regional Share, Trend, and Growth Opportunity Analysis Report Coverage: By Line/Space (25/25 and 30/30 µm and Less than 25/25 µm), Fabrication Process (MSAP and UV LDI), Application (Consumer Electronics, Automotive, Industrial, Medical, and Others), and Geography
Sep 2023
LED Flashlight Market
Size and Forecast (2021 - 2031), Global and Regional Share, Trend, and Growth Opportunity Analysis Report Coverage: By Type (Rechargeable LED Flashlight and Non-Rechargeable LED Flashlight), Product (Everyday Carry Flashlights, Tactical Flashlights, and Safety Flashlights), Application (Residential, Commercial, and Military and Law Enforcement), and Geography
 Get Free Sample For