Sophorolipid and Rhamnolipid Market Share and Forecast by 2030
Sophorolipid and Rhamnolipid Market Size and Forecasts (2020 - 2030), Global and Regional Share, Trends, and Growth Opportunity Analysis Report Coverage: By Type (Sophorolipid and Rhamnolipid) and Application (Household Detergents, Personal Care, Industrial & Institutional Cleaners, Food Processing, Oilfield Chemicals, Leather Processing, Agriculture, Pharmaceuticals, and Others)
- Report Date : Sep 2023
- Report Code : TIPRE00030035
- Category : Chemicals and Materials
- Status : Published
- Available Report Formats :


- No. of Pages : 182
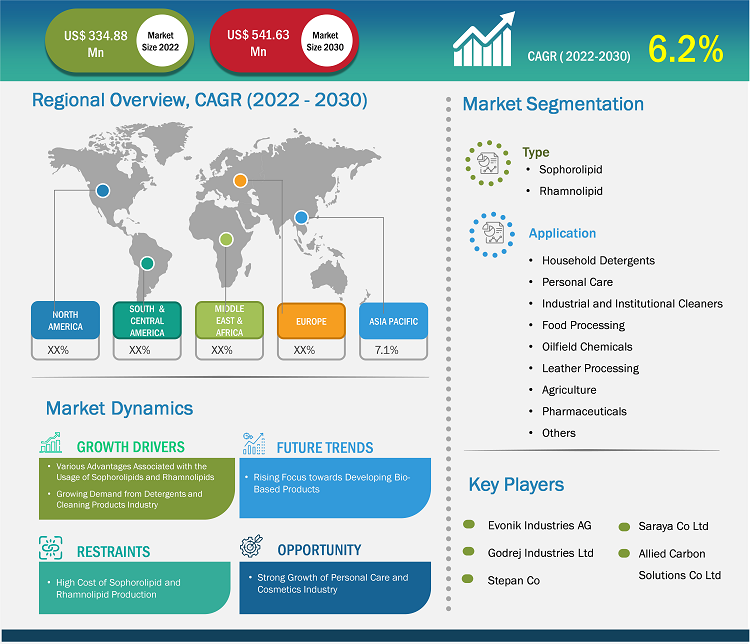
[Research Report] The sophorolipid and rhamnolipid market size is expected to grow from US$ 334.88 million in 2022 to US$ 541.63 million by 2030; it is estimated to register a CAGR of 6.2% from 2022 to 2030.
Market Insights and Analyst View:
Sophorolipids and rhamnolipids are extracted from natural sources. Raw materials required for the manufacturing of sophorolipid are vegetable oil; sugar; and nonpathogenic yeasts such as Candida batistae, C. apicola, Starmerella bombicola, Rhodotorula bogoriensis, Wickerhamiella domercqiae, and Rhodotorula babjevae. Sophorolipids and rhamnolipids are used in different applications such as household detergents, personal care, industrial and institutional cleaners, food processing, oilfield chemicals, leather processing, agriculture, and pharmaceuticals. Due to the low toxicity and high biodegradable properties of sophorolipids, they are highly used as biosurfactants to reduce surface and interfacial tension, increasing the dissolution rate of hydrocarbons and facilitating solubilization and absorption of compounds. Rhamnolipids have gained attention in different sectors due to their non-toxicity, high biodegradability, low surface tension, and minimum inhibitory concentration values.
Growth Drivers and Challenges:
Sophorolipids offer several advantages over chemical surfactants, such as high biodegradability, diversity of biological properties, and renewable characteristics being synthesized as a mixture of different molecules. Sophorolipids have various properties, including antimicrobial and antioxidant activity, that allow their application in different industries, such as detergents and personal care. They are also highly efficient in reducing the surface and interfacial tensions. Further, rhamnolipids are highly used in applications across many industries, such as bioremediation, cosmetics, agriculture, food processing, and pharmaceuticals, owing to their efficient surface and biological capabilities. Rhamnolipids effectively lower surface tension, exhibit low toxicity, have a strong wetting ability, and promote the biodegradation of poorly soluble substrates. Therefore, advantages associated with the usage of sophorolipids and rhamnolipids drive the sophorolipid and rhamnolipid market growth. However, the high cost of rhamnolipids and sophorolipids limits their use in different application sectors, restraining the global sophorolipid and rhamnolipid market growth. The cost of producing rhamnolipids is high due to the poorer yields as compared to commercial synthetic surfactants. High feedstock costs, expensive purification, and downstream processing are key factors increasing the production cost. The main disadvantage of sophorolipid is its high price. However, the chemical industry is analyzing ways to improve production efficiency and lower costs. Many studies have been focusing on finding a new cost-effective bioprocess setting.
Customize Research To Suit Your Requirement
We can optimize and tailor the analysis and scope which is unmet through our standard offerings. This flexibility will help you gain the exact information needed for your business planning and decision making.
Sophorolipid and Rhamnolipid Market: Strategic Insights
Market Size Value in US$ 334.88 million in 2022 Market Size Value by US$ 541.63 million by 2030 Growth rate CAGR of 6.2% from 2022 to 2030 Forecast Period 2022-2030 Base Year 2022

Shejal
Have a question?
Shejal will walk you through a 15-minute call to present the report’s content and answer all queries if you have any.
 Speak to Analyst
Customize Research To Suit Your Requirement
We can optimize and tailor the analysis and scope which is unmet through our standard offerings. This flexibility will help you gain the exact information needed for your business planning and decision making.
Sophorolipid and Rhamnolipid Market: Strategic Insights
| Market Size Value in | US$ 334.88 million in 2022 |
| Market Size Value by | US$ 541.63 million by 2030 |
| Growth rate | CAGR of 6.2% from 2022 to 2030 |
| Forecast Period | 2022-2030 |
| Base Year | 2022 |
Shejal
Have a question?
Shejal will walk you through a 15-minute call to present the report’s content and answer all queries if you have any.
Speak to Analyst
Report Segmentation and Scope:
The "Global Sophorolipid and Rhamnolipid Market" is segmented on the basis of type, application, and geography. Based on type, the sophorolipid and rhamnolipid market is segmented into sophorolipid and rhamnolipid. In terms of application, the sophorolipid and rhamnolipid market is segmented into household detergents, personal care, industrial and institutional cleaners, food processing, oilfield chemicals, leather processing, agriculture, pharmaceuticals, and others. Geographically, the sophorolipid and rhamnolipid market is segmented into North America (the US, Canada, and Mexico), Europe (Germany, France, Italy, the UK, Russia, and the Rest of Europe), Asia Pacific (Australia, China, Japan, India, South Korea, and the Rest of Asia Pacific), the Middle East & Africa (South Africa, Saudi Arabia, the UAE, and the Rest of Middle East & Africa), and South & Central America (Brazil, Argentina, and the Rest of South & Central America).
Segmental Analysis:
Based on type, the sophorolipid and rhamnolipid market is segmented into sophorolipid and rhamnolipid. The sophorolipid segment held a significant sophorolipid and rhamnolipid market share in 2022, and the market for the segment is expected to grow significantly from 2022 to 2030. Sophorolipid molecules possess excellent surface-active properties, making them valuable in various applications such as personal care products, detergents, food additives, pharmaceuticals, and environmental remediation. In cosmetics, sophorolipids have gained traction as natural and biodegradable emulsifiers and foaming agents. Their ability to stabilize formulations while being gentle on the skin aligns with the increasing consumer preference for eco-friendly and skin-friendly products.
Regional Analysis:
The sophorolipid and rhamnolipid market is segmented into five key regions—North America, Europe, Asia Pacific, South & Central America, and the Middle East & Africa. Europe dominated the global sophorolipid and rhamnolipid market, and the regional market accounted for approximately US$ 120 million in 2022. North America is also a major contributor, holding a significant portion of the global sophorolipid and rhamnolipid market share. The North America market is expected to reach over US$ 140 million in 2030. Asia Pacific is expected to register a considerable CAGR of over 7% from 2022 to 2030. The Asia Pacific sophorolipids and rhamnolipids market, by country, is segmented into Australia, China, India, Japan, South Korea, and the Rest of Asia Pacific. The market is driven by factors such as the growing demand from the detergents & cleaning products industry and rising awareness regarding the advantages associated with the use of sophorolipids and rhamnolipids. These biocompatible and environmentally friendly biosurfactants have gained significant traction due to their versatile application in industries such as personal care, pharmaceuticals, agriculture, and oil recovery. The rising awareness regarding sustainable and green technologies is expected to propel the demand for sophorolipids and rhamnolipids due to their effectiveness in reducing environmental impact. Further, the increasing focus on reducing reliance on traditional petrochemical-based surfactants has prompted companies in Asia Pacific to invest in the research, development, and production of these biobased alternatives.
Industry Developments and Future Opportunities:
Following are initiatives taken by the key players operating in the sophorolipid and rhamnolipid market:
- In 2023, Holiferm Ltd and Sasol Chemicals, a business unit of Sasol Ltd., announced a collaboration to produce and market rhamnolipids and mannosyl erythritol lipids (MELs). This collaboration expands the partnership announced in March 2022 between the two companies to develop and commercialize another biosurfactant product, sophorolipids.
- In 2022, Evonik announced an investment to build a new plant for the production of bio-based and fully biodegradable rhamnolipids. The investment at the Slovenská Ľupča site in Slovakia is expected to strengthen the company’s partnership with the consumer goods group Unilever, which began in 2019.
- In 2020, Stepan Co acquired Logos Technologies LLC's NatSurFact business, a rhamnolipid-based line of biosurfactants derived from renewable sources.
Sophorolipid and Rhamnolipid Market Report Scope
COVID-19 Pandemic Impact:
The COVID-19 pandemic negatively affected almost all industries in various countries. Lockdowns, travel restrictions, and business shutdowns in North America, Europe, Asia Pacific, South & Central America, and the Middle East & Africa hampered the growth of several industries, including the chemicals & materials industry. The shutdown of manufacturing units of sophorolipid and rhamnolipid companies disturbed global supply chains, manufacturing activities, and delivery schedules. Various companies reported delays in product deliveries and a slump in product sales in 2020. Negative impact of the pandemic on the growth of industries such as food, personal care, leather processing, and others adversely affected the sophorolipid and rhamnolipid market growth. However, several industries have started operating at full capacity as supply constraints resolve gradually, which propels the demand for sophorolipid and rhamnolipid from various industries, driving the sophorolipid and rhamnolipid market growth.
Competitive Landscape and Key Companies:
Dow Inc., Allied Carbon Solutions Co. Ltd., Saraya Co. Ltd., Evonik Industries AG, Givaudan SA, Godrej Industries Ltd., Holiferm Ltd., Stepan Co, Deguan Biosurfactant Supplier, and Jeneil Bioproducts GmbH are a few players operating in the global sophorolipid and rhamnolipid market. Players operating in the global sophorolipid and rhamnolipid market focus on providing high-quality products to fulfil customer demand. They also focus on adopting strategies such as new product launches, capacity expansion, partnerships, and collaborations to stay competitive in the market.

Report Coverage
Revenue forecast, Company Analysis, Industry landscape, Growth factors, and Trends

Segment Covered
Type, and Application

Regional Scope
North America, Europe, Asia Pacific, Middle East & Africa, South & Central America

Country Scope
This text is related
to country scope.
Frequently Asked Questions
A few players operating in the global sophorolipid and rhamnolipid market include Dow Inc, Allied Carbon Solutions Co Ltd, Saraya Co Ltd, Evonik Industries AG, Givaudan SA, Godrej Industries Ltd, Holiferm Ltd, Stepan Co, Deguan Biosurfactant Supplier, and Jeneil Bioproducts GmbH.
In 2022, Europe held the largest share of the global sophorolipid and rhamnolipid market. In Europe, the increasing use of sophorolipid and rhamnolipid in detergents, cleaning products, personal care and cosmetic products, food processing, pharmaceuticals, and many other applications is driving market growth.
The sophorolipid segment held the largest share in the global sophorolipid and rhamnolipid market in 2022. Sophorolipid molecules possess excellent surface-active properties, making them valuable in various applications such as personal care products, detergents, food additives, pharmaceuticals, and environmental remediation.
The household detergents segment held the largest share of the global sophorolipid and rhamnolipid market in 2022. Sophorolipids and rhamnolipids have shown effective results in hard surface cleaning and automated dishwashing aid formulations. Sophorolipid and rhamnolipids-based detergents are biodegradable and environmentally friendly.
The projected growth of the market is attributed to the advantages associated with usage of sophorolipids and rhamnolipids and the growing demand from detergents & cleaning products industry.
Asia Pacific is estimated to register the fastest CAGR in the global sophorolipid and rhamnolipid market over the forecast period. The market is driven by factors such as the growing demand from the detergents & cleaning products industry and rising awareness regarding advantages associated with using sophorolipids and rhamnolipids.
1. Introduction
1.1 The Insight Partners Research Report Guidance
1.2 Market Segmentation
2. Executive Summary
2.1 Key Insights
2.2 Market Attractiveness
3. Research Methodology
3.1 Coverage
3.2 Secondary Research
3.3 Primary Research
4. Global Sophorolipid and Rhamnolipid Market Landscape
4.1 Overview
4.2 Porter's Five Forces Analysis
4.2.1 Bargaining Power of Suppliers
4.2.2 Bargaining Power of Buyers
4.2.1 Threat of New Entrants
4.2.2 Intensity of Competitive Rivalry
4.2.3 Threat of Substitutes
4.3 Ecosystem Analysis
4.3.1 Raw Material Suppliers
4.3.2 Manufacturers
4.3.3 Distributors/Suppliers
4.3.4 End Use
4.3.5 List of Vendors in the Value Chain
5. Global Sophorolipid and Rhamnolipid Market – Key Market Dynamics
5.1 Market Drivers
5.1.1 Advantages Associated with Usage of Sophorolipids and Rhamnolipids
5.1.2 Growing Demand from Detergents & Cleaning Products Industry
5.2 Market Restraints
5.2.1 High Cost of Sophorolipid and Rhamnolipid Production
5.3 Market Opportunity
5.3.1 Strong Growth of Personal Care & Cosmetics Industry
5.4 Future Trend
5.4.1 Rising Focus on Developing Bio-Based Products
5.5 Impact Analysis
6. Sophorolipid and Rhamnolipid Market - Global Market Analysis
6.1 Global Sophorolipid and Rhamnolipid Market Revenue (US$ Million)
6.2 Global Sophorolipid and Rhamnolipid Market Volume (Kilo Tons)
6.3 Global Sophorolipid and Rhamnolipid Market Forecast and Analysis
7. Global Sophorolipid and Rhamnolipid Market Analysis – By Type
7.1 Sophorolipid
7.1.1 Overview
7.1.2 Sophorolipid Market Revenue and Forecast to 2030 (US$ Million)
7.1.3 Sophorolipid Market Volume and Forecast to 2030 (Kilo Tons)
7.2 Rhamnolipid
7.2.1 Overview
7.2.2 Rhamnolipid Market Revenue and Forecast to 2030 (US$ Million)
7.2.3 Rhamnolipid Market Volume and Forecast to 2030 (Kilo Tons)
8. Global Sophorolipid and Rhamnolipid Market Analysis – By Application
8.1 Household Detergents
8.1.1 Overview
8.1.2 Household Detergents Market Revenue, and Forecast to 2030 (US$ Million)
8.2 Personal Care
8.2.1 Overview
8.2.2 Personal Care Market Revenue, and Forecast to 2030 (US$ Million)
8.3 Industrial and Institutional Cleaners
8.3.1 Overview
8.3.2 Industrial and Institutional Cleaners Market Revenue and Forecast to 2030 (US$ Million)
8.4 Food Processing
8.4.1 Overview
8.4.2 Food Processing Market Revenue and Forecast to 2030 (US$ Million)
8.5 Oilfield Chemicals
8.5.1 Overview
8.5.2 Oilfield Chemicals Market Revenue and Forecast to 2030 (US$ Million)
8.6 Leather Processing
8.6.1 Overview
8.6.2 Leather Processing Market Revenue and Forecast to 2030 (US$ Million)
8.7 Agriculture
8.7.1 Overview
8.7.2 Agriculture Market Revenue and Forecast to 2030 (US$ Million)
8.8 Pharmaceuticals
8.8.1 Overview
8.8.2 Pharmaceuticals Market Revenue and Forecast to 2030 (US$ Million)
8.9 Others
8.9.1 Overview
8.9.2 Others Market Revenue and Forecast to 2030 (US$ Million)
9. Global Sophorolipid and Rhamnolipid Market - Geographical Analysis
9.1 North America
9.1.1 North America Sophorolipid and Rhamnolipid Market Overview
9.1.2 North America Sophorolipid and Rhamnolipid Market Volume and Forecasts to 2030 (Kilo Tons)
9.1.3 North America Sophorolipid and Rhamnolipid Market Revenue and Forecasts to 2030 (US$ Million)
9.1.4 North America Sophorolipid and Rhamnolipid Market Breakdown by Type
9.1.4.1 North America Sophorolipid and Rhamnolipid Market Volume and Forecasts and Analysis - By Type
9.1.4.2 North America Sophorolipid and Rhamnolipid Market Revenue and Forecasts and Analysis - By Type
9.1.5 North America Sophorolipid and Rhamnolipid Market Breakdown by Application
9.1.5.1 North America Sophorolipid and Rhamnolipid Market Revenue and Forecasts and Analysis - By Application
9.1.6 North America Sophorolipid and Rhamnolipid Market Revenue and Forecasts and Analysis - By Countries
9.1.6.1 North America Sophorolipid and Rhamnolipid Market Breakdown by Country
9.1.6.2 US Sophorolipid and Rhamnolipid Market Volume and Forecasts to 2030 (Kilo Tons)
9.1.6.3 US Sophorolipid and Rhamnolipid Market Revenue and Forecasts to 2030 (US$ Million)
9.1.6.3.1 US Sophorolipid and Rhamnolipid Market Breakdown by Type
9.1.6.3.2 US Sophorolipid and Rhamnolipid Market Breakdown by Type
9.1.6.3.3 US Sophorolipid and Rhamnolipid Market Breakdown by Application
9.1.6.4 Canada Sophorolipid and Rhamnolipid Market Volume and Forecasts to 2030 (Kilo Tons)
9.1.6.5 Canada Sophorolipid and Rhamnolipid Market Revenue and Forecasts to 2030 (US$ Million)
9.1.6.5.1 Canada Sophorolipid and Rhamnolipid Market Breakdown by Type
9.1.6.5.2 Canada Sophorolipid and Rhamnolipid Market Breakdown by Type
9.1.6.5.3 Canada Sophorolipid and Rhamnolipid Market Breakdown by Application
9.1.6.6 Mexico Sophorolipid and Rhamnolipid Market Volume and Forecasts to 2030 (Kilo Tons)
9.1.6.7 Mexico Sophorolipid and Rhamnolipid Market Revenue and Forecasts to 2030 (US$ Million)
9.1.6.7.1 Mexico Sophorolipid and Rhamnolipid Market Breakdown by Type
9.1.6.7.2 Mexico Sophorolipid and Rhamnolipid Market Breakdown by Type
9.1.6.7.3 Mexico Sophorolipid and Rhamnolipid Market Breakdown by Application
9.2 Europe
9.2.1 Europe Sophorolipid and Rhamnolipid Market Overview
9.2.2 Europe Sophorolipid and Rhamnolipid Market Volume and Forecasts to 2030 (Kilo Tons)
9.2.3 Europe Sophorolipid and Rhamnolipid Market Revenue and Forecasts to 2030 (US$ Million)
9.2.4 Europe Sophorolipid and Rhamnolipid Market Breakdown by Type
9.2.4.1 Europe Sophorolipid and Rhamnolipid Market Volume and Forecasts and Analysis - By Type
9.2.4.2 Europe Sophorolipid and Rhamnolipid Market Revenue and Forecasts and Analysis - By Type
9.2.5 Europe Sophorolipid and Rhamnolipid Market Breakdown by Application
9.2.5.1 Europe Sophorolipid and Rhamnolipid Market Revenue and Forecasts and Analysis - By Application
9.2.6 Europe Sophorolipid and Rhamnolipid Market Revenue and Forecasts and Analysis - By Countries
9.2.6.1 Europe Sophorolipid and Rhamnolipid Market Breakdown by Country
9.2.6.2 Germany Sophorolipid and Rhamnolipid Market Volume and Forecasts to 2030 (Kilo Tons)
9.2.6.3 Germany Sophorolipid and Rhamnolipid Market Revenue and Forecasts to 2030 (US$ Million)
9.2.6.3.1 Germany Sophorolipid and Rhamnolipid Market Breakdown by Type
9.2.6.3.2 Germany Sophorolipid and Rhamnolipid Market Breakdown by Type
9.2.6.3.3 Germany Sophorolipid and Rhamnolipid Market Breakdown by Application
9.2.6.4 France Sophorolipid and Rhamnolipid Market Volume and Forecasts to 2030 (Kilo Tons)
9.2.6.5 France Sophorolipid and Rhamnolipid Market Revenue and Forecasts to 2030 (US$ Million)
9.2.6.5.1 France Sophorolipid and Rhamnolipid Market Breakdown by Type
9.2.6.5.2 France Sophorolipid and Rhamnolipid Market Breakdown by Type
9.2.6.5.3 France Sophorolipid and Rhamnolipid Market Breakdown by Application
9.2.6.6 Italy Sophorolipid and Rhamnolipid Market Volume and Forecasts to 2030 (Kilo Tons)
9.2.6.7 Italy Sophorolipid and Rhamnolipid Market Revenue and Forecasts to 2030 (US$ Million)
9.2.6.7.1 Italy Sophorolipid and Rhamnolipid Market Breakdown by Type
9.2.6.7.2 Italy Sophorolipid and Rhamnolipid Market Breakdown by Type
9.2.6.7.3 Italy Sophorolipid and Rhamnolipid Market Breakdown by Application
9.2.6.8 UK Sophorolipid and Rhamnolipid Market Volume and Forecasts to 2030 (Kilo Tons)
9.2.6.9 UK Sophorolipid and Rhamnolipid Market Revenue and Forecasts to 2030 (US$ Million)
9.2.6.9.1 UK Sophorolipid and Rhamnolipid Market Breakdown by Type
9.2.6.9.2 UK Sophorolipid and Rhamnolipid Market Breakdown by Type
9.2.6.9.3 UK Sophorolipid and Rhamnolipid Market Breakdown by Application
9.2.6.10 Russia Sophorolipid and Rhamnolipid Market Volume and Forecasts to 2030 (Kilo Tons)
9.2.6.11 Russia Sophorolipid and Rhamnolipid Market Revenue and Forecasts to 2030 (US$ Million)
9.2.6.11.1 Russia Sophorolipid and Rhamnolipid Market Breakdown by Type
9.2.6.11.2 Russia Sophorolipid and Rhamnolipid Market Breakdown by Type
9.2.6.11.3 Russia Sophorolipid and Rhamnolipid Market Breakdown by Application
9.2.6.12 Rest of Europe Sophorolipid and Rhamnolipid Market Volume and Forecasts to 2030 (Kilo Tons)
9.2.6.13 Rest of Europe Sophorolipid and Rhamnolipid Market Revenue and Forecasts to 2030 (US$ Million)
9.2.6.13.1 Rest of Europe Sophorolipid and Rhamnolipid Market Breakdown by Type
9.2.6.13.2 Rest of Europe Sophorolipid and Rhamnolipid Market Breakdown by Type
9.2.6.13.3 Rest of Europe Sophorolipid and Rhamnolipid Market Breakdown by Application
9.3 Asia Pacific Sophorolipid and Rhamnolipid Market
9.3.1 Overview
9.3.2 Asia Pacific Sophorolipid and Rhamnolipid Market Volume and Forecasts To 2030 (Kilo Tons)
9.3.3 Asia Pacific Sophorolipid and Rhamnolipid Market Revenue and Forecasts To 2030 (US$ Million)
9.3.4 Asia Pacific Sophorolipid and Rhamnolipid Market Breakdown by Type
9.3.4.1 Asia Pacific Sophorolipid and Rhamnolipid Market Volume and Forecasts and Analysis - By Type
9.3.4.2 Asia Pacific Sophorolipid and Rhamnolipid Market Revenue and Forecasts and Analysis - By Type
9.3.5 Asia Pacific Sophorolipid and Rhamnolipid Market Breakdown by Application
9.3.5.1 Asia Pacific Sophorolipid and Rhamnolipid Market Revenue and Forecasts and Analysis - By Application
9.3.6 Asia Pacific Sophorolipid and Rhamnolipid Market Breakdown by Country
9.3.6.1 Asia Pacific Sophorolipid and Rhamnolipid Market Breakdown by Country
9.3.6.2 Australia Sophorolipid and Rhamnolipid Market Revenue and Forecasts To 2030 (US$ Million)
9.3.6.3 Australia Sophorolipid and Rhamnolipid Market Volume and Forecasts To 2030 (Kilo Tons)
9.3.6.3.1 Australia Sophorolipid and Rhamnolipid Market Breakdown by Type
9.3.6.3.2 Australia Sophorolipid and Rhamnolipid Market Breakdown by Type
9.3.6.3.3 Australia Sophorolipid and Rhamnolipid Market Breakdown by Application
9.3.6.4 China Sophorolipid and Rhamnolipid Market Revenue and Forecasts To 2030 (US$ Million)
9.3.6.5 China Sophorolipid and Rhamnolipid Market Volume and Forecasts To 2030 (Kilo Tons)
9.3.6.5.1 China Sophorolipid and Rhamnolipid Market Breakdown by Type
9.3.6.5.2 China Sophorolipid and Rhamnolipid Market Breakdown by Type
9.3.6.5.3 China Sophorolipid and Rhamnolipid Market Breakdown by Application
9.3.6.6 India Sophorolipid and Rhamnolipid Market Revenue and Forecasts To 2030 (US$ Million)
9.3.6.7 India Sophorolipid and Rhamnolipid Market Volume and Forecasts To 2030 (Kilo Tons)
9.3.6.7.1 India Sophorolipid and Rhamnolipid Market Breakdown by Type
9.3.6.7.2 India Sophorolipid and Rhamnolipid Market Breakdown by Type
9.3.6.7.3 India Sophorolipid and Rhamnolipid Market Breakdown by Application
9.3.6.8 Japan Sophorolipid and Rhamnolipid Market Revenue and Forecasts To 2030 (US$ Million)
9.3.6.9 Japan Sophorolipid and Rhamnolipid Market Volume and Forecasts To 2030 (Kilo Tons)
9.3.6.9.1 Japan Sophorolipid and Rhamnolipid Market Breakdown by Type
9.3.6.9.2 Japan Sophorolipid and Rhamnolipid Market Breakdown by Type
9.3.6.9.3 Japan Sophorolipid and Rhamnolipid Market Breakdown by Application
9.3.6.10 South Korea Sophorolipid and Rhamnolipid Market Revenue and Forecasts To 2030 (US$ Million)
9.3.6.11 South Korea Sophorolipid and Rhamnolipid Market Volume and Forecasts To 2030 (Kilo Tons)
9.3.6.11.1 South Korea Sophorolipid and Rhamnolipid Market Breakdown by Type
9.3.6.11.2 South Korea Sophorolipid and Rhamnolipid Market Breakdown by Type
9.3.6.11.3 South Korea Sophorolipid and Rhamnolipid Market Breakdown by Application
9.3.6.12 Rest of Asia Pacific Sophorolipid and Rhamnolipid Market Revenue and Forecasts To 2030 (US$ Million)
9.3.6.13 Rest of Asia Pacific Sophorolipid and Rhamnolipid Market Volume and Forecasts To 2030 (Kilo Tons)
9.3.6.13.1 Rest of Asia Pacific Sophorolipid and Rhamnolipid Market Breakdown by Type
9.3.6.13.2 Rest of Asia Pacific Sophorolipid and Rhamnolipid Market Breakdown by Type
9.3.6.13.3 Rest of Asia Pacific Sophorolipid and Rhamnolipid Market Breakdown by Application
9.4 Middle East & Africa
9.4.1 Middle East & Africa Sophorolipid and Rhamnolipid Market Overview
9.4.2 Middle East & Africa Sophorolipid and Rhamnolipid Market Volume and Forecasts to 2030 (Kilo Tons)
9.4.3 Middle East & Africa Sophorolipid and Rhamnolipid Market Revenue and Forecasts to 2030 (US$ Million)
9.4.4 Middle East & Africa Sophorolipid and Rhamnolipid Market Breakdown by Type
9.4.4.1 Middle East & Africa Sophorolipid and Rhamnolipid Market Volume and Forecasts and Analysis - By Type
9.4.4.2 Middle East & Africa Sophorolipid and Rhamnolipid Market Revenue and Forecasts and Analysis - By Type
9.4.5 Middle East & Africa Sophorolipid and Rhamnolipid Market Breakdown by Application
9.4.5.1 Middle East & Africa Sophorolipid and Rhamnolipid Market Revenue and Forecasts and Analysis - By Application
9.4.6 Middle East & Africa Sophorolipid and Rhamnolipid Market Revenue and Forecasts and Analysis - By Countries
9.4.6.1 Middle East & Africa Sophorolipid and Rhamnolipid Market Breakdown by Country
9.4.6.2 South Africa Sophorolipid and Rhamnolipid Market Volume and Forecasts to 2030 (Kilo Tons)
9.4.6.3 South Africa Sophorolipid and Rhamnolipid Market Revenue and Forecasts to 2030 (US$ Million)
9.4.6.3.1 South Africa Sophorolipid and Rhamnolipid Market Breakdown by Type
9.4.6.3.2 South Africa Sophorolipid and Rhamnolipid Market Breakdown by Type
9.4.6.3.3 South Africa Sophorolipid and Rhamnolipid Market Breakdown by Application
9.4.6.4 Saudi Arabia Sophorolipid and Rhamnolipid Market Volume and Forecasts to 2030 (Kilo Tons)
9.4.6.5 Saudi Arabia Sophorolipid and Rhamnolipid Market Revenue and Forecasts to 2030 (US$ Million)
9.4.6.5.1 Saudi Arabia Sophorolipid and Rhamnolipid Market Breakdown by Type
9.4.6.5.2 Saudi Arabia Sophorolipid and Rhamnolipid Market Breakdown by Type
9.4.6.5.3 Saudi Arabia Sophorolipid and Rhamnolipid Market Breakdown by Application
9.4.6.6 UAE Sophorolipid and Rhamnolipid Market Volume and Forecasts to 2030 (Kilo Tons)
9.4.6.7 UAE Sophorolipid and Rhamnolipid Market Revenue and Forecasts to 2030 (US$ Million)
9.4.6.7.1 UAE Sophorolipid and Rhamnolipid Market Breakdown by Type
9.4.6.7.2 UAE Sophorolipid and Rhamnolipid Market Breakdown by Type
9.4.6.7.3 UAE Sophorolipid and Rhamnolipid Market Breakdown by Application
9.4.6.8 Rest of Middle East & Africa Sophorolipid and Rhamnolipid Market Volume and Forecasts to 2030 (Kilo Tons)
9.4.6.9 Rest of Middle East & Africa Sophorolipid and Rhamnolipid Market Revenue and Forecasts to 2030 (US$ Million)
9.4.6.9.1 Rest of Middle East & Africa Sophorolipid and Rhamnolipid Market Breakdown by Type
9.4.6.9.2 Rest of Middle East & Africa Sophorolipid and Rhamnolipid Market Breakdown by Type
9.4.6.9.3 Rest of Middle East & Africa Sophorolipid and Rhamnolipid Market Breakdown by Application
9.5 South & Central America
9.5.1 South & Central America Sophorolipid and Rhamnolipid Market Overview
9.5.2 South & Central America Sophorolipid and Rhamnolipid Market Revenue and Forecasts to 2030 (US$ Million)
9.5.3 South & Central America Sophorolipid and Rhamnolipid Market Volume and Forecasts to 2030 (Kilo Tons)
9.5.4 South & Central America Sophorolipid and Rhamnolipid Market Breakdown by Type
9.5.4.1 South & Central America Sophorolipid and Rhamnolipid Market and Forecasts and Analysis - By Type
9.5.4.2 South & Central America Sophorolipid and Rhamnolipid Market and Forecasts and Analysis - By Type
9.5.5 South & Central America Sophorolipid and Rhamnolipid Market Breakdown by Application
9.5.5.1 South & Central America Sophorolipid and Rhamnolipid Market Revenue and Forecasts and Analysis - By Application
9.5.6 South & Central America Sophorolipid and Rhamnolipid Market Revenue and Forecasts and Analysis - By Countries
9.5.6.1 South & Central America Sophorolipid and Rhamnolipid Market Breakdown by Country
9.5.6.2 Brazil Sophorolipid and Rhamnolipid Market Volume and Forecasts to 2030 (Kilo Tons)
9.5.6.3 Brazil Sophorolipid and Rhamnolipid Market Revenue and Forecasts to 2030 (US$ Million)
9.5.6.3.1 Brazil Sophorolipid and Rhamnolipid Market Breakdown by Type
9.5.6.3.2 Brazil Sophorolipid and Rhamnolipid Market Breakdown by Type
9.5.6.3.3 Brazil Sophorolipid and Rhamnolipid Market Breakdown by Application
9.5.6.4 Argentina Sophorolipid and Rhamnolipid Market Volume and Forecasts to 2030 (Kilo Tons)
9.5.6.5 Argentina Sophorolipid and Rhamnolipid Market Revenue and Forecasts to 2030 (US$ Million)
9.5.6.5.1 Argentina Sophorolipid and Rhamnolipid Market Breakdown by Type
9.5.6.5.2 Argentina Sophorolipid and Rhamnolipid Market Breakdown by Type
9.5.6.5.3 Argentina Sophorolipid and Rhamnolipid Market Breakdown by Application
9.5.6.6 Rest of South & Central America Sophorolipid and Rhamnolipid Market Volume and Forecasts to 2030 (Kilo Tons)
9.5.6.7 Rest of South & Central America Sophorolipid and Rhamnolipid Market Revenue and Forecasts to 2030 (US$ Million)
9.5.6.7.1 Rest of South & Central America Sophorolipid and Rhamnolipid Market Breakdown by Type
9.5.6.7.2 Rest of South & Central America Sophorolipid and Rhamnolipid Market Breakdown by Type
9.5.6.7.3 Rest of South & Central America Sophorolipid and Rhamnolipid Market Breakdown by Application
10. Impact of COVID-19 Pandemic on Global Sophorolipid and Rhamnolipid Market
10.1 Pre & Post Covid-19 Impact
11. Competitive Landscape
11.1 Heat Map Analysis By Key Players
11.2 Company Positioning & Concentration
12. Industry Landscape
12.1 Overview
12.2 Market Initiative
12.3 New Product Development
12.4 Merger and Acquisition
13. Company Profiles
13.1 Allied Carbon Solutions Co Ltd
13.1.1 Key Facts
13.1.2 Business Description
13.1.3 Products and Services
13.1.4 Financial Overview
13.1.5 SWOT Analysis
13.1.6 Key Developments
13.2 Saraya Co Ltd
13.2.1 Key Facts
13.2.2 Business Description
13.2.3 Products and Services
13.2.4 Financial Overview
13.2.5 SWOT Analysis
13.2.6 Key Developments
13.3 Evonik Industries AG
13.3.1 Key Facts
13.3.2 Business Description
13.3.3 Products and Services
13.3.4 Financial Overview
13.3.5 SWOT Analysis
13.3.6 Key Developments
13.4 Givaudan SA
13.4.1 Key Facts
13.4.2 Business Description
13.4.3 Products and Services
13.4.4 Financial Overview
13.4.5 SWOT Analysis
13.4.6 Key Developments
13.5 Godrej Industries Ltd
13.5.1 Key Facts
13.5.2 Business Description
13.5.3 Products and Services
13.5.4 Financial Overview
13.5.5 SWOT Analysis
13.5.6 Key Developments
13.6 Holiferm Ltd
13.6.1 Key Facts
13.6.2 Business Description
13.6.3 Products and Services
13.6.4 Financial Overview
13.6.5 SWOT Analysis
13.6.6 Key Developments
13.7 Stepan Co
13.7.1 Key Facts
13.7.2 Business Description
13.7.3 Products and Services
13.7.4 Financial Overview
13.7.5 SWOT Analysis
13.7.6 Key Developments
13.8 Deguan Biosurfactant Supplier
13.8.1 Key Facts
13.8.2 Business Description
13.8.3 Products and Services
13.8.4 Financial Overview
13.8.5 SWOT Analysis
13.8.6 Key Developments
13.9 Dow Inc
13.9.1 Key Facts
13.9.2 Business Description
13.9.3 Products and Services
13.9.4 Financial Overview
13.9.5 SWOT Analysis
13.9.6 Key Developments
13.10 Jeneil Bioproducts GmbH
13.10.1 Key Facts
13.10.2 Business Description
13.10.3 Products and Services
13.10.4 Financial Overview
13.10.5 SWOT Analysis
13.10.6 Key Developments
14. Appendix
List of Tables
Table 1. Global Sophorolipid and Rhamnolipid Market Segmentation
Table 2. Global Sophorolipid and Rhamnolipid Market Revenue and Forecasts To 2030 (US$ Million)
Table 3. Global Sophorolipid and Rhamnolipid Market Volume and Forecasts To 2030 (Kilo Tons)
Table 4. Global Sophorolipid and Rhamnolipid Market Revenue and Forecasts To 2030 (US$ Million) – Type
Table 5. Global Sophorolipid and Rhamnolipid Market Volume and Forecasts To 2030 (Kilo Tons) – Type
Table 6. Global Sophorolipid and Rhamnolipid Market Revenue and Forecasts To 2030 (US$ Million) – Application
Table 7. North America Sophorolipid and Rhamnolipid Market Volume and Forecasts To 2030 (Kilo Tons) – By Type
Table 8. North America Sophorolipid and Rhamnolipid Market Revenue and Forecasts To 2030 (US$ Million) – By Type
Table 9. North America Sophorolipid and Rhamnolipid Market Revenue and Forecasts To 2030 (US$ Million) – By Application
Table 10. US Sophorolipid and Rhamnolipid Market Volume and Forecasts To 2030 (Kilo Tons) – By Type
Table 11. US Sophorolipid and Rhamnolipid Market Revenue and Forecasts To 2030 (US$ Million) – By Type
Table 12. US Sophorolipid and Rhamnolipid Market Revenue and Forecasts To 2030 (US$ Million) – By Application
Table 13. Canada Sophorolipid and Rhamnolipid Market Volume and Forecasts To 2030 (Kilo Tons) – By Type
Table 14. Canada Sophorolipid and Rhamnolipid Market Revenue and Forecasts To 2030 (US$ Million) – By Type
Table 15. Canada Sophorolipid and Rhamnolipid Market Revenue and Forecasts To 2030 (US$ Million) – By Application
Table 16. Mexico Sophorolipid and Rhamnolipid Market Volume and Forecasts To 2030 (Kilo Tons) – By Type
Table 17. Mexico Sophorolipid and Rhamnolipid Market Revenue and Forecasts To 2030 (US$ Million) – By Type
Table 18. Mexico Sophorolipid and Rhamnolipid Market Revenue and Forecasts To 2030 (US$ Million) – By Application
Table 19. Europe Sophorolipid and Rhamnolipid Market Volume and Forecasts To 2030 (Kilo Tons) – By Type
Table 20. Europe Sophorolipid and Rhamnolipid Market Revenue and Forecasts To 2030 (US$ Million) – By Type
Table 21. Europe Sophorolipid and Rhamnolipid Market Revenue and Forecasts To 2030 (US$ Million) – By Application
Table 22. Germany Sophorolipid and Rhamnolipid Market Volume and Forecasts To 2030 (Kilo Tons) – By Type
Table 23. Germany Sophorolipid and Rhamnolipid Market Revenue and Forecasts To 2030 (US$ Million) – By Type
Table 24. Germany Sophorolipid and Rhamnolipid Market Revenue and Forecasts To 2030 (US$ Million) – By Application
Table 25. France Sophorolipid and Rhamnolipid Market Volume and Forecasts To 2030 (Kilo Tons) – By Type
Table 26. France Sophorolipid and Rhamnolipid Market Revenue and Forecasts To 2030 (US$ Million) – By Type
Table 27. France Sophorolipid and Rhamnolipid Market Revenue and Forecasts To 2030 (US$ Million) – By Application
Table 28. Italy Sophorolipid and Rhamnolipid Market Volume and Forecasts To 2030 (Kilo Tons) – By Type
Table 29. Italy Sophorolipid and Rhamnolipid Market Revenue and Forecasts To 2030 (US$ Million) – By Type
Table 30. Italy Sophorolipid and Rhamnolipid Market Revenue and Forecasts To 2030 (US$ Million) – By Application
Table 31. UK Sophorolipid and Rhamnolipid Market Volume and Forecasts To 2030 (Kilo Tons) – By Type
Table 32. UK Sophorolipid and Rhamnolipid Market Revenue and Forecasts To 2030 (US$ Million) – By Type
Table 33. UK Sophorolipid and Rhamnolipid Market Revenue and Forecasts To 2030 (US$ Million) – By Application
Table 34. Russia Sophorolipid and Rhamnolipid Market Volume and Forecasts To 2030 (Kilo Tons) – By Type
Table 35. Russia Sophorolipid and Rhamnolipid Market Revenue and Forecasts To 2030 (US$ Million) – By Type
Table 36. Russia Sophorolipid and Rhamnolipid Market Revenue and Forecasts To 2030 (US$ Million) – By Application
Table 37. Rest of Europe Sophorolipid and Rhamnolipid Market Volume and Forecasts To 2030 (Kilo Tons) – By Type
Table 38. Rest of Europe Sophorolipid and Rhamnolipid Market Revenue and Forecasts To 2030 (US$ Million) – By Type
Table 39. Rest of Europe Sophorolipid and Rhamnolipid Market Revenue and Forecasts To 2030 (US$ Million) – By Application
Table 40. Asia Pacific Sophorolipid and Rhamnolipid Market Volume and Forecasts To 2030 (Kilo Tons) – By Type
Table 41. Asia Pacific Sophorolipid and Rhamnolipid Market Revenue and Forecasts To 2030 (US$ Million) – By Type
Table 42. Asia Pacific Sophorolipid and Rhamnolipid Market Revenue and Forecasts To 2030 (US$ Million) – Application
Table 43. Australia Sophorolipid and Rhamnolipid Market Revenue and Forecasts To 2030 (US$ Million) – Type
Table 44. Australia Sophorolipid and Rhamnolipid Market Volume and Forecasts To 2030 (Kilo Tons) – Type
Table 45. Australia Sophorolipid and Rhamnolipid Market Revenue and Forecasts To 2030 (US$ Million) – Application
Table 46. China Sophorolipid and Rhamnolipid Market Revenue and Forecasts To 2030 (US$ Million) – Type
Table 47. China Sophorolipid and Rhamnolipid Market Volume and Forecasts To 2030 (Kilo Tons) – Type
Table 48. China Sophorolipid and Rhamnolipid Market Revenue and Forecasts To 2030 (US$ Million) – Application
Table 49. India Sophorolipid and Rhamnolipid Market Revenue and Forecasts To 2030 (US$ Million) – Type
Table 50. India Sophorolipid and Rhamnolipid Market Volume and Forecasts To 2030 (Kilo Tons) – Type
Table 51. India Sophorolipid and Rhamnolipid Market Revenue and Forecasts To 2030 (US$ Million) – Application
Table 52. Japan Sophorolipid and Rhamnolipid Market Revenue and Forecasts To 2030 (US$ Million) – Type
Table 53. Japan Sophorolipid and Rhamnolipid Market Volume and Forecasts To 2030 (Kilo Tons) – Type
Table 54. Japan Sophorolipid and Rhamnolipid Market Revenue and Forecasts To 2030 (US$ Million) – Application
Table 55. South Korea Sophorolipid and Rhamnolipid Market Revenue and Forecasts To 2030 (US$ Million) – Type
Table 56. South Korea Sophorolipid and Rhamnolipid Market Volume and Forecasts To 2030 (Kilo Tons) – Type
Table 57. South Korea Sophorolipid and Rhamnolipid Market Revenue and Forecasts To 2030 (US$ Million) – Application
Table 58. Rest of Asia Pacific Sophorolipid and Rhamnolipid Market Revenue and Forecasts To 2030 (US$ Million) – Type
Table 59. Rest of Asia Pacific Sophorolipid and Rhamnolipid Market Volume and Forecasts To 2030 (Kilo Tons) – Type
Table 60. Rest of Asia Pacific Sophorolipid and Rhamnolipid Market Revenue and Forecasts To 2030 (US$ Million) – Application
Table 61. Middle East & Africa Sophorolipid and Rhamnolipid Market Volume and Forecasts To 2030 (Kilo Tons) – By Type
Table 62. Middle East & Africa Sophorolipid and Rhamnolipid Market Revenue and Forecasts To 2030 (US$ Million) – By Type
Table 63. Middle East & Africa Sophorolipid and Rhamnolipid Market Revenue and Forecasts To 2030 (US$ Million) – By Application
Table 64. South Africa Sophorolipid and Rhamnolipid Market Volume and Forecasts To 2030 (Kilo Tons) – By Type
Table 65. South Africa Sophorolipid and Rhamnolipid Market Revenue and Forecasts To 2030 (US$ Million) – By Type
Table 66. South Africa Sophorolipid and Rhamnolipid Market Revenue and Forecasts To 2030 (US$ Million) – By Application
Table 67. Saudi Arabia Sophorolipid and Rhamnolipid Market Volume and Forecasts To 2030 (Kilo Tons) – By Type
Table 68. Saudi Arabia Sophorolipid and Rhamnolipid Market Revenue and Forecasts To 2030 (US$ Million) – By Type
Table 69. Saudi Arabia Sophorolipid and Rhamnolipid Market Revenue and Forecasts To 2030 (US$ Million) – By Application
Table 70. UAE Sophorolipid and Rhamnolipid Market Volume and Forecasts To 2030 (Kilo Tons) – By Type
Table 71. UAE Sophorolipid and Rhamnolipid Market Revenue and Forecasts To 2030 (US$ Million) – By Type
Table 72. UAE Sophorolipid and Rhamnolipid Market Revenue and Forecasts To 2030 (US$ Million) – By Application
Table 73. Rest of Middle East & Africa Sophorolipid and Rhamnolipid Market Volume and Forecasts To 2030 (Kilo Tons) – By Type
Table 74. Rest of Middle East & Africa Sophorolipid and Rhamnolipid Market Revenue and Forecasts To 2030 (US$ Million) – By Type
Table 75. Rest of Middle East & Africa Sophorolipid and Rhamnolipid Market Revenue and Forecasts To 2030 (US$ Million) – By Application
Table 76. South & Central America Sophorolipid and Rhamnolipid Market Volume and Forecasts To 2030 (Kilo Tons) – By Type
Table 77. South & Central America Sophorolipid and Rhamnolipid Market Revenue and Forecasts To 2030 (US$ Million) – By Type
Table 78. South & Central America Sophorolipid and Rhamnolipid Market Revenue and Forecasts To 2030 (US$ Million) – By Application
Table 79. Brazil Sophorolipid and Rhamnolipid Market Volume and Forecasts To 2030 (Kilo Tons) – By Type
Table 80. Brazil Sophorolipid and Rhamnolipid Market Revenue and Forecasts To 2030 (US$ Million) – By Type
Table 81. Brazil Sophorolipid and Rhamnolipid Market Revenue and Forecasts To 2030 (US$ Million) – By Application
Table 82. Argentina Sophorolipid and Rhamnolipid Market Volume and Forecasts To 2030 (Kilo Tons) – By Type
Table 83. Argentina Sophorolipid and Rhamnolipid Market Revenue and Forecasts To 2030 (US$ Million) – By Type
Table 84. Argentina Sophorolipid and Rhamnolipid Market Revenue and Forecasts To 2030 (US$ Million) – By Application
Table 85. Rest of South & Central America Sophorolipid and Rhamnolipid Market Volume and Forecasts To 2030 (Kilo Tons) – By Type
Table 86. Rest of South & Central America Sophorolipid and Rhamnolipid Market Revenue and Forecasts To 2030 (US$ Million) – By Type
Table 87. Rest of South & Central America Sophorolipid and Rhamnolipid Market Revenue and Forecasts To 2030 (US$ Million) – By Application
Table 88. Company Positioning & Concentration
List of Figures
Figure 1. Global Sophorolipid and Rhamnolipid Market Segmentation, By Geography
Figure 2. Global Sophorolipid and Rhamnolipid Market – Porter's Analysis
Figure 3. Ecosystem: Global Sophorolipid and Rhamnolipid Market
Figure 4. Market Dynamics: Global Sophorolipid and Rhamnolipid Market
Figure 5. Global Sophorolipid and Rhamnolipid Market Impact Analysis of Drivers and Restraints
Figure 6. Global Sophorolipid and Rhamnolipid Market Revenue (US$ Million), 2020 – 2030
Figure 7. Global Sophorolipid and Rhamnolipid Market Volume (Kilo Tons), 2020 – 2030
Figure 8. Global Sophorolipid and Rhamnolipid Market Share (%) – Type, 2022 and 2030
Figure 9. Sophorolipid Market Revenue and Forecasts To 2030 (US$ Million)
Figure 10. Sophorolipid Market Volume and Forecasts To 2030 (Kilo Tons)
Figure 11. Rhamnolipid Market Revenue and Forecasts To 2030 (US$ Million)
Figure 12. Rhamnolipid Market Volume and Forecasts To 2030 (Kilo Tons)
Figure 13. Global Sophorolipid and Rhamnolipid Market Share (%) –Application, 2022 and 2030
Figure 14. Household Detergents Market Revenue and Forecasts To 2030 (US$ Million)
Figure 15. Personal Care Market Revenue and Forecasts To 2030 (US$ Million)
Figure 16. Industrial and Institutional Cleaners Market Revenue and Forecasts To 2030 (US$ Million)
Figure 17. Food Processing Market Revenue and Forecasts To 2030 (US$ Million)
Figure 18. Oilfield Chemicals Market Revenue and Forecasts To 2030 (US$ Million)
Figure 19. Leather Processing Market Revenue and Forecasts To 2030 (US$ Million)
Figure 20. Agriculture Market Revenue and Forecasts To 2030 (US$ Million)
Figure 21. Pharmaceuticals Market Revenue and Forecasts To 2030 (US$ Million)
Figure 22. Others Market Revenue and Forecasts To 2030 (US$ Million)
Figure 23. Global Sophorolipid and Rhamnolipid Market Breakdown by Geography, 2022 and 2030 (%)
Figure 24. North America Sophorolipid and Rhamnolipid Market Volume and Forecasts To 2030 (Kilo Tons)
Figure 25. North America Sophorolipid and Rhamnolipid Market Revenue and Forecasts To 2030 (US$ Million)
Figure 26. North America Sophorolipid and Rhamnolipid Market Breakdown by Type (2022 and 2030)
Figure 27. North America Sophorolipid and Rhamnolipid Market Breakdown by Application (2022 and 2030)
Figure 28. North America Sophorolipid and Rhamnolipid Market Breakdown by Key Countries, 2022 and 2030 (%)
Figure 29. US Sophorolipid and Rhamnolipid Market Volume and Forecasts To 2030 (Kilo Tons)
Figure 30. US Sophorolipid and Rhamnolipid Market Revenue and Forecasts To 2030 (US$ Million)
Figure 31. Canada Sophorolipid and Rhamnolipid Market Volume and Forecasts To 2030 (Kilo Tons)
Figure 32. Canada Sophorolipid and Rhamnolipid Market Revenue and Forecasts To 2030 (US$ Million)
Figure 33. Mexico Sophorolipid and Rhamnolipid Market Volume and Forecasts To 2030 (Kilo Tons)
Figure 34. Mexico Sophorolipid and Rhamnolipid Market Revenue and Forecasts To 2030 (US$ Million)
Figure 35. Europe Sophorolipid and Rhamnolipid Market Volume and Forecasts To 2030 (Kilo Tons)
Figure 36. Europe Sophorolipid and Rhamnolipid Market Revenue and Forecasts To 2030 (US$ Million)
Figure 37. Europe Sophorolipid and Rhamnolipid Market Breakdown by Type (2022 and 2030)
Figure 38. Europe Sophorolipid and Rhamnolipid Market Breakdown by Application (2022 and 2030)
Figure 39. Europe Sophorolipid and Rhamnolipid Market Breakdown by Key Countries, 2022 and 2030 (%)
Figure 40. Germany Sophorolipid and Rhamnolipid Market Volume and Forecasts To 2030 (Kilo Tons)
Figure 41. Germany Sophorolipid and Rhamnolipid Market Revenue and Forecasts To 2030 (US$ Million)
Figure 42. France Sophorolipid and Rhamnolipid Market Volume and Forecasts To 2030 (Kilo Tons)
Figure 43. France Sophorolipid and Rhamnolipid Market Revenue and Forecasts To 2030 (US$ Million)
Figure 44. Italy Sophorolipid and Rhamnolipid Market Volume and Forecasts To 2030 (Kilo Tons)
Figure 45. Italy Sophorolipid and Rhamnolipid Market Revenue and Forecasts To 2030 (US$ Million)
Figure 46. UK Sophorolipid and Rhamnolipid Market Volume and Forecasts To 2030 (Kilo Tons)
Figure 47. UK Sophorolipid and Rhamnolipid Market Revenue and Forecasts To 2030 (US$ Million)
Figure 48. Russia Sophorolipid and Rhamnolipid Market Volume and Forecasts To 2030 (Kilo Tons)
Figure 49. Russia Sophorolipid and Rhamnolipid Market Revenue and Forecasts To 2030 (US$ Million)
Figure 50. Rest of Europe Sophorolipid and Rhamnolipid Market Volume and Forecasts To 2030 (Kilo Tons)
Figure 51. Rest of Europe Sophorolipid and Rhamnolipid Market Revenue and Forecasts To 2030 (US$ Million)
Figure 52. Asia Pacific Sophorolipid and Rhamnolipid Market Volume and Forecasts To 2030 (Kilo Tons)
Figure 53. Asia Pacific Sophorolipid and Rhamnolipid Market Revenue and Forecasts To 2030 (US$ Million)
Figure 54. Asia Pacific Sophorolipid and Rhamnolipid Market Breakdown by Type (2022 and 2030)
Figure 55. Asia Pacific Sophorolipid and Rhamnolipid Market Breakdown by Application (2022 and 2030)
Figure 56. Asia Pacific Sophorolipid and Rhamnolipid Market Breakdown By Key Countries, 2022 And 2030 (%)
Figure 57. Australia Sophorolipid and Rhamnolipid Market Revenue and Forecasts To 2030 (US$ Million)
Figure 58. Australia Sophorolipid and Rhamnolipid Market Volume and Forecasts To 2030 (Kilo Tons)
Figure 59. China Sophorolipid and Rhamnolipid Market Revenue and Forecasts To 2030 (US$ Million)
Figure 60. China Sophorolipid and Rhamnolipid Market Volume and Forecasts To 2030 (Kilo Tons)
Figure 61. India Sophorolipid and Rhamnolipid Market Revenue and Forecasts To 2030 (US$ Million)
Figure 62. India Sophorolipid and Rhamnolipid Market Volume and Forecasts To 2030 (Kilo Tons)
Figure 63. Japan Sophorolipid and Rhamnolipid Market Revenue and Forecasts To 2030 (US$ Million)
Figure 64. Japan Sophorolipid and Rhamnolipid Market Volume and Forecasts To 2030 (Kilo Tons)
Figure 65. South Korea Sophorolipid and Rhamnolipid Market Revenue and Forecasts To 2030 (US$ Million)
Figure 66. South Korea Sophorolipid and Rhamnolipid Market Volume and Forecasts To 2030 (Kilo Tons)
Figure 67. Rest of Asia Pacific Sophorolipid and Rhamnolipid Market Revenue and Forecasts To 2030 (US$ Million)
Figure 68. Rest of Asia Pacific Sophorolipid and Rhamnolipid Market Volume and Forecasts To 2030 (Kilo Tons)
Figure 69. Middle East & Africa Sophorolipid and Rhamnolipid Market Volume and Forecasts To 2030 (Kilo Tons)
Figure 70. Middle East & Africa Sophorolipid and Rhamnolipid Market Revenue and Forecasts To 2030 (US$ Million)
Figure 71. Middle East & Africa Sophorolipid and Rhamnolipid Market Breakdown by Type (2022 and 2030)
Figure 72. Middle East & Africa Sophorolipid and Rhamnolipid Market Breakdown by Application (2022 and 2030)
Figure 73. Middle East & Africa Sophorolipid and Rhamnolipid Market Breakdown by Key Countries, 2022 and 2030 (%)
Figure 74. South Africa Sophorolipid and Rhamnolipid Market Volume and Forecasts To 2030 (Kilo Tons)
Figure 75. South Africa Sophorolipid and Rhamnolipid Market Revenue and Forecasts To 2030 (US$ Million)
Figure 76. Saudi Arabia Sophorolipid and Rhamnolipid Market Volume and Forecasts To 2030 (Kilo Tons)
Figure 77. Saudi Arabia Sophorolipid and Rhamnolipid Market Revenue and Forecasts To 2030 (US$ Million)
Figure 78. UAE Sophorolipid and Rhamnolipid Market Volume and Forecasts To 2030 (Kilo Tons)
Figure 79. UAE Sophorolipid and Rhamnolipid Market Revenue and Forecasts To 2030 (US$ Million)
Figure 80. Rest of Middle East & Africa Sophorolipid and Rhamnolipid Market Volume and Forecasts To 2030 (Kilo Tons)
Figure 81. Rest of Middle East & Africa Sophorolipid and Rhamnolipid Market Revenue and Forecasts To 2030 (US$ Million)
Figure 82. South & Central America Sophorolipid and Rhamnolipid Market Revenue and Forecasts To 2030 (US$ Million)
Figure 83. South & Central America Sophorolipid and Rhamnolipid Market Volume and Forecasts To 2030 (Kilo Tons)
Figure 84. South & Central America Sophorolipid and Rhamnolipid Market Breakdown by Type (2022 and 2030)
Figure 85. South & Central America Sophorolipid and Rhamnolipid Market Breakdown by Application (2022 and 2030)
Figure 86. South & Central America Sophorolipid and Rhamnolipid Market Breakdown by Key Countries, 2022 and 2030 (%)
Figure 87. Brazil Sophorolipid and Rhamnolipid Market Volume and Forecasts To 2030 (Kilo Tons)
Figure 88. Brazil Sophorolipid and Rhamnolipid Market Revenue and Forecasts To 2030 (US$ Million)
Figure 89. Argentina Sophorolipid and Rhamnolipid Market Volume and Forecasts To 2030 (Kilo Tons)
Figure 90. Argentina Sophorolipid and Rhamnolipid Market Revenue and Forecasts To 2030 (US$ Million)
Figure 91. Rest of South & Central America Sophorolipid and Rhamnolipid Market Volume and Forecasts To 2030 (Kilo Tons)
Figure 92. Rest of South & Central America Sophorolipid and Rhamnolipid Market Revenue and Forecasts To 2030 (US$ Million)
Figure 93. Heat Map Analysis By Key Players
The List of Companies - Sophorolipid and Rhamnolipid Market
- Dow Inc
- Allied Carbon Solutions Co Ltd
- Saraya Co Ltd
- Evonik Industries AG
- Givaudan SA
- Godrej Industries Ltd
- Holiferm Ltd
- Stepan Co
- Deguan Biosurfactant Supplier
- Jeneil Bioproducts GmbH.
The Insight Partners performs research in 4 major stages: Data Collection & Secondary Research, Primary Research, Data Analysis and Data Triangulation & Final Review.
- Data Collection and Secondary Research:
As a market research and consulting firm operating from a decade, we have published many reports and advised several clients across the globe. First step for any study will start with an assessment of currently available data and insights from existing reports. Further, historical and current market information is collected from Investor Presentations, Annual Reports, SEC Filings, etc., and other information related to company’s performance and market positioning are gathered from Paid Databases (Factiva, Hoovers, and Reuters) and various other publications available in public domain.
Several associations trade associates, technical forums, institutes, societies and organizations are accessed to gain technical as well as market related insights through their publications such as research papers, blogs and press releases related to the studies are referred to get cues about the market. Further, white papers, journals, magazines, and other news articles published in the last 3 years are scrutinized and analyzed to understand the current market trends.
- Primary Research:
The primarily interview analysis comprise of data obtained from industry participants interview and answers to survey questions gathered by in-house primary team.
For primary research, interviews are conducted with industry experts/CEOs/Marketing Managers/Sales Managers/VPs/Subject Matter Experts from both demand and supply side to get a 360-degree view of the market. The primary team conducts several interviews based on the complexity of the markets to understand the various market trends and dynamics which makes research more credible and precise.
A typical research interview fulfils the following functions:
- Provides first-hand information on the market size, market trends, growth trends, competitive landscape, and outlook
- Validates and strengthens in-house secondary research findings
- Develops the analysis team’s expertise and market understanding
Primary research involves email interactions and telephone interviews for each market, category, segment, and sub-segment across geographies. The participants who typically take part in such a process include, but are not limited to:
- Industry participants: VPs, business development managers, market intelligence managers and national sales managers
- Outside experts: Valuation experts, research analysts and key opinion leaders specializing in the electronics and semiconductor industry.
Below is the breakup of our primary respondents by company, designation, and region:

Once we receive the confirmation from primary research sources or primary respondents, we finalize the base year market estimation and forecast the data as per the macroeconomic and microeconomic factors assessed during data collection.
- Data Analysis:
Once data is validated through both secondary as well as primary respondents, we finalize the market estimations by hypothesis formulation and factor analysis at regional and country level.
- 3.1 Macro-Economic Factor Analysis:
We analyse macroeconomic indicators such the gross domestic product (GDP), increase in the demand for goods and services across industries, technological advancement, regional economic growth, governmental policies, the influence of COVID-19, PEST analysis, and other aspects. This analysis aids in setting benchmarks for various nations/regions and approximating market splits. Additionally, the general trend of the aforementioned components aid in determining the market's development possibilities.
- 3.2 Country Level Data:
Various factors that are especially aligned to the country are taken into account to determine the market size for a certain area and country, including the presence of vendors, such as headquarters and offices, the country's GDP, demand patterns, and industry growth. To comprehend the market dynamics for the nation, a number of growth variables, inhibitors, application areas, and current market trends are researched. The aforementioned elements aid in determining the country's overall market's growth potential.
- 3.3 Company Profile:
The “Table of Contents” is formulated by listing and analyzing more than 25 - 30 companies operating in the market ecosystem across geographies. However, we profile only 10 companies as a standard practice in our syndicate reports. These 10 companies comprise leading, emerging, and regional players. Nonetheless, our analysis is not restricted to the 10 listed companies, we also analyze other companies present in the market to develop a holistic view and understand the prevailing trends. The “Company Profiles” section in the report covers key facts, business description, products & services, financial information, SWOT analysis, and key developments. The financial information presented is extracted from the annual reports and official documents of the publicly listed companies. Upon collecting the information for the sections of respective companies, we verify them via various primary sources and then compile the data in respective company profiles. The company level information helps us in deriving the base number as well as in forecasting the market size.
- 3.4 Developing Base Number:
Aggregation of sales statistics (2020-2022) and macro-economic factor, and other secondary and primary research insights are utilized to arrive at base number and related market shares for 2022. The data gaps are identified in this step and relevant market data is analyzed, collected from paid primary interviews or databases. On finalizing the base year market size, forecasts are developed on the basis of macro-economic, industry and market growth factors and company level analysis.
- Data Triangulation and Final Review:
The market findings and base year market size calculations are validated from supply as well as demand side. Demand side validations are based on macro-economic factor analysis and benchmarks for respective regions and countries. In case of supply side validations, revenues of major companies are estimated (in case not available) based on industry benchmark, approximate number of employees, product portfolio, and primary interviews revenues are gathered. Further revenue from target product/service segment is assessed to avoid overshooting of market statistics. In case of heavy deviations between supply and demand side values, all thes steps are repeated to achieve synchronization.
We follow an iterative model, wherein we share our research findings with Subject Matter Experts (SME’s) and Key Opinion Leaders (KOLs) until consensus view of the market is not formulated – this model negates any drastic deviation in the opinions of experts. Only validated and universally acceptable research findings are quoted in our reports.
We have important check points that we use to validate our research findings – which we call – data triangulation, where we validate the information, we generate from secondary sources with primary interviews and then we re-validate with our internal data bases and Subject matter experts. This comprehensive model enables us to deliver high quality, reliable data in shortest possible time.

Sep 2023
Amorphous Silica Market
Size and Forecast (2021 - 2031), Global and Regional Share, Trend, and Growth Opportunity Analysis Report Coverage: By Grade (High-Purity, Medium-Purity, and Low-Purity), Product Type (Precipitated Silica, Silica Gel, Colloidal Silica, Fumed Silica, and Others), Application (Rubber, Electrical and Electronics, Building and Construction, Personal Care and Cosmetics, Food and Beverages, Oil and Gas, Pulp and Paper, Agrochemicals, and Others), and Geography
Sep 2023
Leather for Automotive Seats Market
Size and Forecast (2021 - 2031), Global and Regional Share, Trend, and Growth Opportunity Analysis Report Coverage: By Type [Genuine Leather and Artificial Leather (Polyurethane, Polyvinyl Chloride, and Others)], Vehicle Type (Passenger Cars, Light Commercial Vehicles, Heavy Commercial Vehicles, and Others), and Geography
Sep 2023
Leather for Aviation Application Market
Size and Forecast (2021 - 2031), Global and Regional Share, Trend, and Growth Opportunity Analysis Report Coverage: By Type [Genuine Leather and Artificial Leather (Polyurethane, Polyvinyl Chloride, and Others)], Application [Seats, Headrests, Armrests, Cushions, Cabin Interiors, and Others], Aircraft Type [Private Aircraft, Commercial Aircraft, Military Aircraft, and Others], and Geography
Sep 2023
Leather for Railway Market
Size and Forecast (2021 - 2031), Global and Regional Share, Trend, and Growth Opportunity Analysis Report Coverage: By Type (Genuine Leather and Artificial Leather [Polyurethane, Polyvinyl Chloride, and Others]), Application (Train Seats, Traction Bellows, Handle and Grip Bars, Cushions and Pillows, and Others), Train Type (Passenger Trains, Freight Trains, Mining Trains, and Others), and Geography
Sep 2023
Re-Refined Paraffinic Base Oil Market
Size and Forecast (2021 - 2031), Global and Regional Share, Trend, and Growth Opportunity Analysis Report Coverage: By Process (Acid Treatment, Clay Treatment, Solvent Extraction, and Hydrotreating), Application (Engine Oil, Hydraulic Oil, Metalworking Fluid, Compressor Oil, Grease, Turbine Oil, and Others), End Use (Automotive, Construction, Mining and Metallurgy, Marine, Energy and Power, Oil and Gas, and Others), and Geography
Sep 2023
Cosmetic Polymer Ingredients Market
Size and Forecast (2021 - 2031), Global and Regional Share, Trend, and Growth Opportunity Analysis Report Coverage: By Type (Polyethylene Glycol, Acrylic Acid-Based, Vinyl Acetate, Silicone, Cellulose, Collagen, Pectin, Xanthan Gum, Chitosan, and Others), Category (Natural, Synthetic, and Semi-Synthetic), Function (Rheology Modifier, Stabilizers, Emulsifiers, Film Formers, Conditioning, and Others), Application (Skincare, Hair Care, Makeup, and Others), and Geography
Sep 2023
Plastic Pipes Market
Size and Forecast (2021 - 2031), Global and Regional Share, Trend, and Growth Opportunity Analysis Report Coverage: By Type [Corrugated (Single-Wall and Multi-Wall) and Smoothwall], Material Type (Polyvinyl Chloride, High-Density Polyethylene, Polypropylene, and Others), Application (Water Supply, Sewage and Drainage, Irrigation, Gas Distribution, and Others), End-Use Industry (Construction and Infrastructure, Water and Wastewater Management, Oil and Gas, and Others), and Geography
Sep 2023
Nonwovens for Energy Applications Market
Size and Forecast (2021 - 2031), Global and Regional Share, Trend, and Growth Opportunity Analysis Report Coverage: By Type (Carbon Fiber, Titanium Fiber, and Others), Application [Battery, Fuel Cell Gas Diffusion Layer (GDL), PTL, and Wind Energy], and Geography
 Get Free Sample For