Spatial Computing Market Key Players and Forecast by 2030
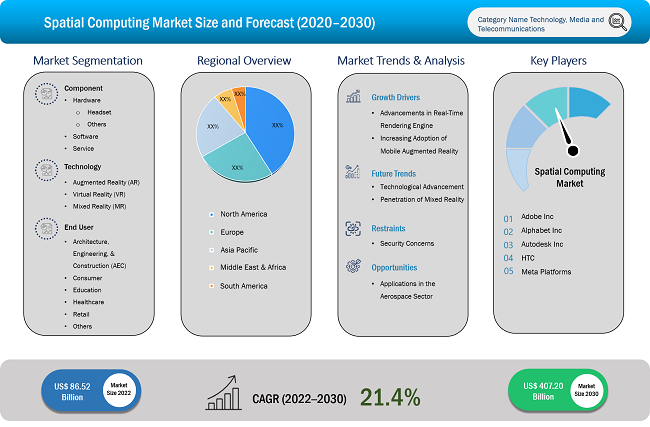
Spatial Computing Market Size and Forecast (2020–2030), Global and Regional Share, Trend, and Growth Opportunity Analysis Report Coverage: By Component [Hardware (Headset and Others), Software, and Service], Technology [Augmented Reality (AR), Virtual Reality (VR), and Mixed Reality (MR)], End User [Architecture, Engineering, & Construction (AEC); Consumer; Education; Healthcare; Retail; and Others], and Geography
- Report Date : Sep 2025
- Report Code : TIPRE00039173
- Category : Technology, Media and Telecommunications
- Status : Data Released
- Available Report Formats :


- No. of Pages : 150
The spatial computing market size was valued at US$ 86.52 billion in 2022 and is expected to reach US$ 407.20 billion by 2030; it is estimated to record a CAGR of 21.4% from 2022 to 2030. Technological advancement and penetration of mixed reality is likely to remain key spatial computing market trends.
Spatial Computing Market Analysis
Modern Internet, also termed Web 3.0, utilizes a suite of advanced technologies that render computers increasingly invisible. It is done by integrating the user interface (UI) into the physical environment. Spatial computing technology seamlessly integrates computers into the environment by utilizing human’s natural spatial capabilities to increase productivity.
Spatial computing is anticipated to dramatically change daily activities and has already had a huge influence on how people live. A simple example of the spatial computing revolution is social media location tagging. While it may be considered as a basic component of any social media post, it presents a robust context to users through location-specific information and generates insights about target audiences. Using a vehicle or phone’s Global Positioning System (GPS) system is another example of the technology revolution.
In many cases, the power that these technologies can offer increases when they operate in synergy with one another rather than in isolation. To address this, Institute of Electrical and Electronics Engineers (IEEE) protocol for Web 3.0, aka the Spatial Web/metaverse, was released. It offers technical standards for these technologies to communicate with each other in an organized and harmonious way.
Spatial Computing Market Overview
The report includes growth prospects in light of current spatial computing market trends and driving factors influencing the market growth. The global market is experiencing extensive growth and is estimated to continue expanding in the coming years. Spatial computing can be termed as the digitization of actions involving machines, objects, people, and the environments in which they occur, for enabling and optimizing actions and interactions. The technology contains the potential to digitally transform how industrial enterprises optimize operations for frontline workers in factories, worksites, and warehouses and to enable digitally augmented dimensional context for enterprise actions and interactions. Over the past few years, there have been advancements in the technologies, such as artificial intelligence (AI), machine learning (ML), natural language processing (NLP), camera sensors, computer vision, Internet of Things (IoT), virtual reality (VR), augmented reality (AR), mixed reality (MR), and extended reality (XR), that are making spatial computing possible. The spatial computing market forecast is estimated by considering all such trends, along with various secondary and primary research findings.
Customize Research To Suit Your Requirement
We can optimize and tailor the analysis and scope which is unmet through our standard offerings. This flexibility will help you gain the exact information needed for your business planning and decision making.
Spatial Computing Market: Strategic Insights

Naveen
Have a question?
Naveen will walk you through a 15-minute call to present the report’s content and answer all queries if you have any.
 Speak to Analyst
Customize Research To Suit Your Requirement
We can optimize and tailor the analysis and scope which is unmet through our standard offerings. This flexibility will help you gain the exact information needed for your business planning and decision making.
Spatial Computing Market: Strategic Insights
Naveen
Have a question?
Naveen will walk you through a 15-minute call to present the report’s content and answer all queries if you have any.
Speak to Analyst
Spatial Computing Market Drivers and Opportunities
Advancements in Real-Time Rendering Engine Fuels Spatial Computing Market Growth
Current software and available technology have lifted rendering from being limited to computer enthusiasts to a rapidly expanding field that includes architects, artists, developers, engineers, and others. Despite certain limits to the technology, professionals constantly perform research on integrations of various multivariate technologies to ensure mainstream rendering and visualization. The applications of AI to aid in the rendering process are gaining ground in the field of architectural visualization. Without the need for manual optimization, users can utilize ML algorithms and deep neural networks (DNN) to generate more lifelike and nuanced visualizations. With the help of AI, the rendering process can be further fine-tuned to improve speed and efficiency. Such advancements contribute to the growing spatial computing market size.
Spatial Computing Market Report Segmentation Analysis
Key segments that contributed to the derivation of the spatial computing market analysis are component, technology, and end user.
- Based on component, the market is segmented into hardware, software, and service. The market for the hardware segment is further bifurcated into headsets and others. In 2022, the hardware segment held a larger share of the market.
- Based on technology, the market is segmented into augmented reality (AR), virtual reality (VR), and mixed reality (MR). The large enterprises segment dominated the market in 2023 owing to the growing investments by large enterprises in meeting management software.
- In terms of end user, the market is segmented into architecture, engineering, & Construction (AEC); consumer; education; healthcare; retail; and others. Meeting management software is widely used in corporate settings. Also, government, education, and other end users are adopting the meeting management software significantly.
Spatial Computing Market Share Analysis by Geography
- In terms of revenue, North America dominated the spatial computing market share in 2022. APAC is expected to grow at the fastest pace during the forecast period. The market in APAC is segmented into Australia, China, India, Japan, South Korea, and the Rest of APAC. The region is diverse in terms of demographics. It is one of the largest technology research hubs, and the majority of the world’s semiconductors are manufactured in the region.
- With the growing requirement for advanced manufacturing technologies, manufacturers in the region adopt AR and VR technologies at a fast pace. Since nations such as the US, Germany, and the UK are increasing their stringency on imported products, suppliers from APAC are significantly opting for spatial computing technologies as a means to better adhere to such regulations and requirements.
- Precision medicine is gaining prominence with the growing trend of specialized and personalized patient care in APAC. Rising prevalence of lifestyle diseases and increasing awareness of such diseases are certain factors promoting precision and personalized medicines. To provide more effective care, the individual needs of a patient are combined with spatial computing for designing such medicines. Spatial computing is also being utilized from drug molecule screening to medical device production. All these factors fuel the spatial computing market growth in APAC.
Spatial Computing Market News and Recent Developments
The spatial computing market is evaluated by gathering qualitative and quantitative data post primary and secondary research, which includes important corporate publications, association data, and databases. The following is a list of developments in the spatial computing market:
- In March 2024, Cromwell Hospital in London, owned by Bupa, disclosed that their surgical team utilized MR headset for two microsurgical spine procedures. The surgeons employed Apple's Vision Pro headset to facilitate medical procedures, marking a notable advancement in healthcare technology. Following its release in the US, Apple's Vision Pro has seen a surge in healthcare applications compatible with the device, as highlighted in an Apple press release. Notable among these is Stryker's Mako SmartRobotics app, tailored for surgeons performing hip and knee replacements.
(Source: Cromwell Hospital, Press Release)
- In September 2023, pre-orders for Meta Quest 3 were initiated. The world’s first mass-market MR headset’s price was announced, which started from US$ 499.99 for the 128GB version and US$ 649.99 for the 512GB variant. Meta Quest 3 features breakthrough MR that enables a spectrum of experiences and was the world’s first device to feature the new Snapdragon XR2 Gen 2 platform.
(Source: Meta, Press Release)
Spatial Computing Market Report Scope
Spatial Computing Market Report Coverage and Deliverables
The "Spatial Computing Market Size and Forecast (2022–2030)" provides a detailed analysis of the market covering the areas mentioned below:
- Market size and forecast at global, regional, and country levels for all the key market segments covered under the scope
- Market dynamics such as drivers, restraints, and key opportunities
- Key future trends
- Detailed PEST/Porter's Five Forces and SWOT analysis
- Global and regional market analysis covering key market trends, major players, regulations, and recent market developments
- Industry landscape and competition analysis covering market concentration, heat map analysis, prominent players, and recent developments
- Detailed company profiles

Report Coverage
Revenue forecast, Company Analysis, Industry landscape, Growth factors, and Trends

Segment Covered
This text is related
to segments covered.

Regional Scope
North America, Europe, Asia Pacific, Middle East & Africa, South & Central America

Country Scope
This text is related
to country scope.
Frequently Asked Questions
Asia Pacific is anticipated to grow with the highest CAGR over the forecast period.
North America held the largest market share in 2022, followed by Europe and Asia Pacific.
The software segment held largest market share in 2022, and is expected to grow with the highest CAGR during the forecast period 2023-2030.
The key players, holding majority shares, in spatial computing market includes Autodesk Inc, Alphabet Inc, Adobe Inc, Meta Platforms, and HTC.
The spatial computing market was valued at US$ 86.52 billion in 2022 and is expected to grow at a CAGR of 21.4% during 2022–2030.
Integration of blockchain in spatial computing software is expected to be a key future trend of the spatial computing market.
Factors such as advancements in real-time rendering engines and applications in the aerospace sector are driving the spatial computing market growth.
1. Introduction
1.1 Scope of the Study
1.2 Market Definition, Assumptions and Limitations
1.3 Market Segmentation
2. Executive Summary
2.1 Key Insights
2.2 Market Attractiveness Analysis
3. Research Methodology
4. Spatial Computing Market Landscape
4.1 Overview
4.2 PEST Analysis
4.3 Ecosystem Analysis
4.3.1 List of Vendors in the Value Chain
5. Spatial Computing Market - Key Market Dynamics
5.1 Key Market Drivers
5.2 Key Market Restraints
5.3 Key Market Opportunities
5.4 Future Trends
5.5 Impact Analysis of Drivers and Restraints
6. Spatial Computing Market - Global Market Analysis
6.1 Spatial Computing - Global Market Overview
6.2 Spatial Computing - Global Market and Forecast to 2030
7. Spatial Computing Market – Revenue Analysis (USD Million) – By Component, 2020-2030
7.1 Overview
7.2 Hardware
7.2.1 Headset
7.2.2 Others
7.3 Software
7.4 Service
8. Spatial Computing Market – Revenue Analysis (USD Million) – By Technology, 2020-2030
8.1 Overview
8.2 Augmented Reality (AR)
8.3 Virtual Reality (VR)
8.4 Mixed Reality (MR)
9. Spatial Computing Market – Revenue Analysis (USD Million) – By End User, 2020-2030
9.1 Overview
9.2 Architecture, Engineering, and Construction (AEC)
9.3 Consumer
9.4 Education
9.5 Healthcare
9.6 Retail
9.7 Others
10. Spatial Computing Market - Revenue Analysis (USD Million), 2020-2030 – Geographical Analysis
10.1 North America
10.1.1 North America Spatial Computing Market Overview
10.1.2 North America Spatial Computing Market Revenue and Forecasts to 2030
10.1.3 North America Spatial Computing Market Revenue and Forecasts and Analysis - By Component
10.1.4 North America Spatial Computing Market Revenue and Forecasts and Analysis - By Technology
10.1.5 North America Spatial Computing Market Revenue and Forecasts and Analysis - By End User
10.1.6 North America Spatial Computing Market Revenue and Forecasts and Analysis - By Countries
10.1.6.1 United States Spatial Computing Market
10.1.6.1.1 United States Spatial Computing Market, by Component
10.1.6.1.2 United States Spatial Computing Market, by Technology
10.1.6.1.3 United States Spatial Computing Market, by End User
10.1.6.2 Canada Spatial Computing Market
10.1.6.2.1 Canada Spatial Computing Market, by Component
10.1.6.2.2 Canada Spatial Computing Market, by Technology
10.1.6.2.3 Canada Spatial Computing Market, by End User
10.1.6.3 Mexico Spatial Computing Market
10.1.6.3.1 Mexico Spatial Computing Market, by Component
10.1.6.3.2 Mexico Spatial Computing Market, by Technology
10.1.6.3.3 Mexico Spatial Computing Market, by End User
Note - Similar analysis would be provided for below mentioned regions/countries
10.2 Europe
10.2.1 Germany
10.2.2 France
10.2.3 Italy
10.2.4 United Kingdom
10.2.5 Russia
10.2.6 Rest of Europe
10.3 Asia-Pacific
10.3.1 Australia
10.3.2 China
10.3.3 India
10.3.4 Japan
10.3.5 South Korea
10.3.6 Rest of Asia-Pacific
10.4 Middle East and Africa
10.4.1 South Africa
10.4.2 Saudi Arabia
10.4.3 U.A.E
10.4.4 Rest of Middle East and Africa
10.5 South and Central America
10.5.1 Brazil
10.5.2 Argentina
10.5.3 Rest of South and Central America
11. Industry Landscape
11.1 Mergers and Acquisitions
11.2 Agreements, Collaborations, Joint Ventures
11.3 New Product Launches
11.4 Expansions and Other Strategic Developments
12. Competitive Landscape
12.1 Heat Map Analysis by Key Players
12.2 Company Positioning and Concentration
13. Spatial Computing Market - Key Company Profiles
13.1 Adobe Inc
13.1.1 Key Facts
13.1.2 Business Description
13.1.3 Products and Services
13.1.4 Financial Overview
13.1.5 SWOT Analysis
13.1.6 Key Developments
Note - Similar information would be provided for below list of companies
13.2 Alphabet Inc
13.3 Apple Inc
13.4 Autodesk Inc
13.5 Dassault Systemes
13.6 HTC
13.7 Magic Leap Inc
13.8 Meta Platforms
13.9 Microsoft Corporation
13.10 Unity Technologies
14. Appendix
14.1 Glossary
14.2 About The Insight Partners
14.3 Market Intelligence Cloud
The List of Companies - Spatial Computing Market
- Adobe Inc
- Alphabet Inc
- Apple Inc
- Autodesk Inc
- Dassault Systemes
- HTC
- Magic Leap Inc
- Meta Platforms Inc
- Microsoft Corporation
- Unity Technologies
The Insight Partners performs research in 4 major stages: Data Collection & Secondary Research, Primary Research, Data Analysis and Data Triangulation & Final Review.
- Data Collection and Secondary Research:
As a market research and consulting firm operating from a decade, we have published many reports and advised several clients across the globe. First step for any study will start with an assessment of currently available data and insights from existing reports. Further, historical and current market information is collected from Investor Presentations, Annual Reports, SEC Filings, etc., and other information related to company’s performance and market positioning are gathered from Paid Databases (Factiva, Hoovers, and Reuters) and various other publications available in public domain.
Several associations trade associates, technical forums, institutes, societies and organizations are accessed to gain technical as well as market related insights through their publications such as research papers, blogs and press releases related to the studies are referred to get cues about the market. Further, white papers, journals, magazines, and other news articles published in the last 3 years are scrutinized and analyzed to understand the current market trends.
- Primary Research:
The primarily interview analysis comprise of data obtained from industry participants interview and answers to survey questions gathered by in-house primary team.
For primary research, interviews are conducted with industry experts/CEOs/Marketing Managers/Sales Managers/VPs/Subject Matter Experts from both demand and supply side to get a 360-degree view of the market. The primary team conducts several interviews based on the complexity of the markets to understand the various market trends and dynamics which makes research more credible and precise.
A typical research interview fulfils the following functions:
- Provides first-hand information on the market size, market trends, growth trends, competitive landscape, and outlook
- Validates and strengthens in-house secondary research findings
- Develops the analysis team’s expertise and market understanding
Primary research involves email interactions and telephone interviews for each market, category, segment, and sub-segment across geographies. The participants who typically take part in such a process include, but are not limited to:
- Industry participants: VPs, business development managers, market intelligence managers and national sales managers
- Outside experts: Valuation experts, research analysts and key opinion leaders specializing in the electronics and semiconductor industry.
Below is the breakup of our primary respondents by company, designation, and region:

Once we receive the confirmation from primary research sources or primary respondents, we finalize the base year market estimation and forecast the data as per the macroeconomic and microeconomic factors assessed during data collection.
- Data Analysis:
Once data is validated through both secondary as well as primary respondents, we finalize the market estimations by hypothesis formulation and factor analysis at regional and country level.
- 3.1 Macro-Economic Factor Analysis:
We analyse macroeconomic indicators such the gross domestic product (GDP), increase in the demand for goods and services across industries, technological advancement, regional economic growth, governmental policies, the influence of COVID-19, PEST analysis, and other aspects. This analysis aids in setting benchmarks for various nations/regions and approximating market splits. Additionally, the general trend of the aforementioned components aid in determining the market's development possibilities.
- 3.2 Country Level Data:
Various factors that are especially aligned to the country are taken into account to determine the market size for a certain area and country, including the presence of vendors, such as headquarters and offices, the country's GDP, demand patterns, and industry growth. To comprehend the market dynamics for the nation, a number of growth variables, inhibitors, application areas, and current market trends are researched. The aforementioned elements aid in determining the country's overall market's growth potential.
- 3.3 Company Profile:
The “Table of Contents” is formulated by listing and analyzing more than 25 - 30 companies operating in the market ecosystem across geographies. However, we profile only 10 companies as a standard practice in our syndicate reports. These 10 companies comprise leading, emerging, and regional players. Nonetheless, our analysis is not restricted to the 10 listed companies, we also analyze other companies present in the market to develop a holistic view and understand the prevailing trends. The “Company Profiles” section in the report covers key facts, business description, products & services, financial information, SWOT analysis, and key developments. The financial information presented is extracted from the annual reports and official documents of the publicly listed companies. Upon collecting the information for the sections of respective companies, we verify them via various primary sources and then compile the data in respective company profiles. The company level information helps us in deriving the base number as well as in forecasting the market size.
- 3.4 Developing Base Number:
Aggregation of sales statistics (2020-2022) and macro-economic factor, and other secondary and primary research insights are utilized to arrive at base number and related market shares for 2022. The data gaps are identified in this step and relevant market data is analyzed, collected from paid primary interviews or databases. On finalizing the base year market size, forecasts are developed on the basis of macro-economic, industry and market growth factors and company level analysis.
- Data Triangulation and Final Review:
The market findings and base year market size calculations are validated from supply as well as demand side. Demand side validations are based on macro-economic factor analysis and benchmarks for respective regions and countries. In case of supply side validations, revenues of major companies are estimated (in case not available) based on industry benchmark, approximate number of employees, product portfolio, and primary interviews revenues are gathered. Further revenue from target product/service segment is assessed to avoid overshooting of market statistics. In case of heavy deviations between supply and demand side values, all thes steps are repeated to achieve synchronization.
We follow an iterative model, wherein we share our research findings with Subject Matter Experts (SME’s) and Key Opinion Leaders (KOLs) until consensus view of the market is not formulated – this model negates any drastic deviation in the opinions of experts. Only validated and universally acceptable research findings are quoted in our reports.
We have important check points that we use to validate our research findings – which we call – data triangulation, where we validate the information, we generate from secondary sources with primary interviews and then we re-validate with our internal data bases and Subject matter experts. This comprehensive model enables us to deliver high quality, reliable data in shortest possible time.

Sep 2025
Flight Planning Software Market
Size and Forecast (2021 - 2031), Global and Regional Share, Trend, and Growth Opportunity Analysis Report Coverage: By Component (Software and Services), Deployment (Cloud and On-Premise), Application (Logistics and Cargo, Airport, Private Airlines, Commercial Airlines, Flight School and Training Center, and Military and Defense), and Geography
Sep 2025
Deepfake AI Detection Market
Size and Forecast (2021 - 2031), Global and Regional Share, Trend, and Growth Opportunity Analysis Report Coverage: By Component (Software and Services), Deployment (Cloud and On-Premises), Enterprise Size (Large Enterprises and SMEs), Industry Vertical (Media and Entertainment, BFSI, Government and Politics, Healthcare and Life Sciences, IT and Telecom, Retail and E-Commerce, and Others), and Geography
Sep 2025
Electronic Patient-Reported Outcomes (ePROS) Market
Size and Forecast (2021 - 2031), Global and Regional Share, Trend, and Growth Opportunity Analysis Report Coverage: By Delivery Mode (Cloud Based and On-Premises), Application (Oncology, Respiratory, and Others), End User [Contract Research Organizations (CROs), Pharmaceutical Companies, and Others], and Geography (North America, Europe, Asia Pacific, Middle East & Africa, and South & Central America)
Sep 2025
Travel and Expense Management Software Market
Size and Forecast (2021 - 2031), Global and Regional Share, Trend, and Growth Opportunity Analysis Report Coverage: By Deployment Mode (On-Premise and Cloud), Organization Size (Large Enterprises and Small and Medium Enterprises), Industry (BFSI, IT and Telecom, Manufacturing, Healthcare, Government and Defense, Retail, Transport and Logistics, and Others), and Geography
Sep 2025
Online Exam Proctoring Market
Size and Forecast (2021 - 2031), Global and Regional Share, Trend, and Growth Opportunity Analysis Report Coverage: By Type (Advanced Automated Proctoring, Recorded Proctoring, and Live Online Proctoring), Deployment (Cloud and On-Premises), End User (Educational Institutes, Enterprises, Government, and Online Learning Platforms), and Geography
Sep 2025
Manufacturing Execution System (MES) Market
Size and Forecast (2021 - 2031), Global and Regional Share, Trend, and Growth Opportunity Analysis Report Coverage: By Component (Software and Services), Services Type (Professional Services and Managed Services), Deployment (Cloud and On-Premise), Organization Size (Large Enterprises and SMEs), License Type (Subscription-Based and Licensed), Sales Channel (Direct Sales and Channel Partners), End User (Discrete Industry and Process Industry), and Geography
Sep 2025
Maritime Analytics Market
Size and Forecast (2021 - 2031), Global and Regional Share, Trend, and Growth Opportunity Analysis Report Coverage: By Component (Software and Services), Deployment (Cloud and On-Premises), Application (Predictive and Prescriptive Analytics, Optimal Route Mapping, Pricing Insights, Vessel Safety and Security, and Others), End User (Commercial and Military), and Geography
 Get Free Sample For