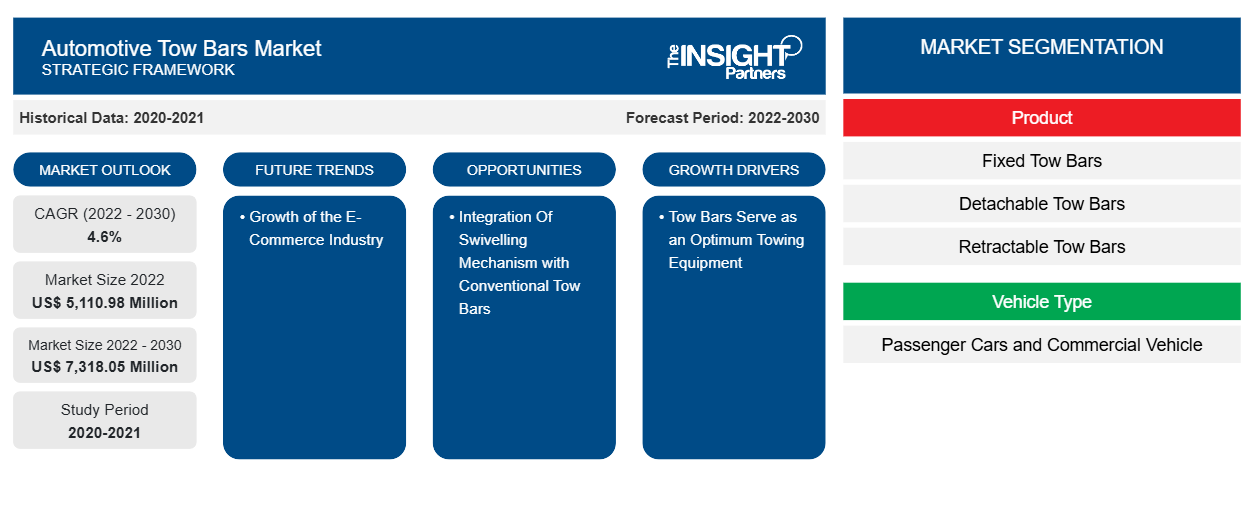
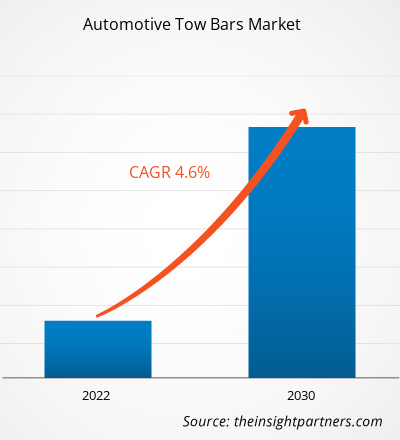
2022 年汽车拖车杆市场价值为 51.1098 亿美元,预计到 2030 年将达到 73.1805 亿美元;预计 2022-2030 年期间复合年增长率为 4.6%。
分析师观点:
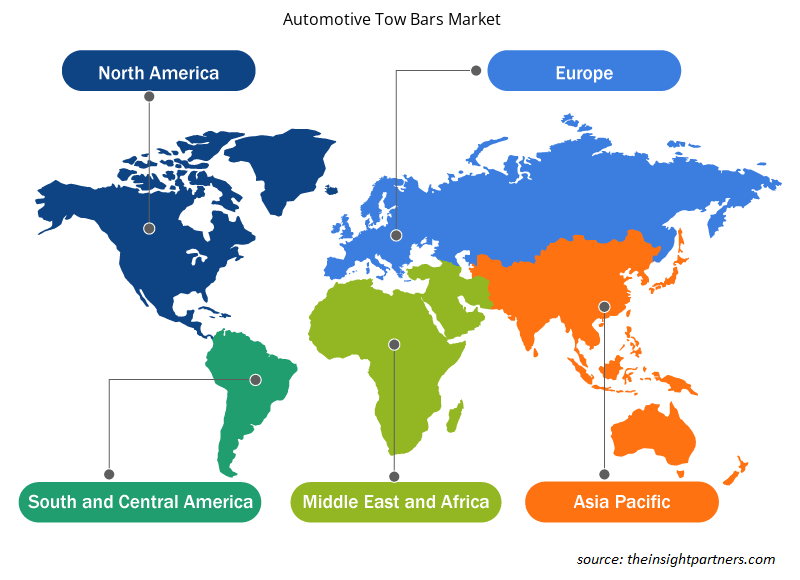
牵引杆用于牵引抛锚的车辆,同时确保平衡以避免打滑。全球汽车牵引杆市场分为五大区域——北美、欧洲、亚太地区、中东和非洲以及南美和中美。冒险运动和休闲车 (RV) 的日益普及推动了对汽车牵引杆的需求。乘用车销量的增加也支持了汽车牵引杆市场的增长。根据欧洲汽车制造商协会 (ACEA) 的数据,欧洲和北美占全球汽车总产量的 34.6% 左右。预计欧洲将在汽车牵引杆市场中实现最高的复合年增长率,其次是北美和亚太地区。
汽车牵引杆的需求与乘用车的销量直接相关。因此,欧洲和北美等发达地区的乘用车销量增长支持了汽车牵引杆市场的增长。
大多数大篷车用户选择牵引杆来牵引大篷车。市场上有各种类型的牵引杆可供携带各种配件,在英国非常受欢迎。电动牵引杆越来越受欢迎,这将为在汽车牵引杆市场运营的公司在未来几年获得强大的客户群创造机会。
市场概况:
各个发展中国家的可支配收入不断增长、冒险活动日益增多以及大篷车和房车使用率不断上升,推动了汽车牵引杆市场的增长。由于可牵引休闲车的趋势日益增长,对汽车牵引杆的需求可能会激增。电动牵引杆可以通过开关操作。因此,由于对运动型多用途车 (SUV) 和越野车的偏好日益增加,预计在预测期内对电动牵引杆的需求将以中等速度增长。增加投资以建立工厂和扩大汽车生产厂将推动对乘用车和商用车的需求。因此,预计这些关键因素将在 2020-2027 年推动汽车牵引杆市场增长。
此外,汽车牵引杆市场中的各家公司都采取了多种策略,例如产品开发和收购,以保持竞争优势。2020 年 3 月,Curt Manufacturing 推出了一款新型非约束性牵引杆——Rambler 钢制牵引杆。新推出的产品具有自动锁定机制、三个收起位置和防滑臂,可实现更好的控制和操作。因此,无机市场策略推动了汽车牵引杆市场的增长。
定制此报告以满足您的需求
您可以免费定制任何报告,包括本报告的部分内容、国家级分析、Excel 数据包,以及为初创企业和大学提供优惠和折扣
汽车牵引杆市场:
- 获取此报告的关键市场趋势。这个免费样品将包括数据分析,从市场趋势到估计和预测。
市场驱动因素:
汽车产量增加推动汽车牵引杆市场增长
过去几年,汽车产量的增长,特别是在北美和欧洲等发达地区,推动了汽车牵引杆市场的增长。汽车牵引杆可作为标准灯丝或作为奥迪、路虎揽胜、宝马和福特汽车公司等汽车巨头推出的大多数高级乘用车型号的附加功能。全球发达经济体汽车产量的快速增长推动了汽车行业对牵引杆的需求。电动汽车和混合动力汽车在市场上越来越受欢迎。可持续发展和随之而来的对绿色汽车的需求导致了电动汽车和其他可再生能源的出现,包括太阳能、风能和生物燃料。此外,政府采取了多项举措鼓励使用这些车辆,例如向绿色汽车采用者提供奖励和税收优惠。因此,电动和混合动力汽车的快速普及推动了汽车牵引杆市场的增长。
节段分析:
根据产品,汽车牵引杆市场分为可伸缩牵引杆、固定牵引杆、可拆卸牵引杆和其他。
伸缩式牵引杆是一种细长的鹅颈形牵引杆,可在保险杠下方旋转。伸缩式牵引杆可根据需要轻松缩回或伸出;在缩回位置,牵引杆完全隐藏。伸缩式产品的牵引球和牵引杆颈为一体式,只需几秒钟即可轻松手动旋转,将其放置在车辆后面板和保险杠之间的空间中。此牵引杆使用方便且易于使用。它可以轻松折叠;用户友好,几秒钟内即可使用。它以电动方式工作,或通过方便放置的释放机制工作。伸缩式牵引杆自动从保险杠下方旋转出来,可立即使用。伸缩式牵引杆外观低调;其增加的复杂性可能会在未来造成问题。但是,适当的维护和保养可以减轻任何潜在的可靠性问题。此外,预测期内,多个潜在地区的乘用车和商用车数量的不断增长可能会推动对可伸缩牵引杆的需求。
汽车牵引杆市场区域洞察
Insight Partners 的分析师已详尽解释了预测期内影响汽车牵引杆市场的区域趋势和因素。本节还讨论了北美、欧洲、亚太地区、中东和非洲以及南美和中美洲的汽车牵引杆市场细分和地理位置。
- 获取汽车牵引杆市场的区域特定数据
汽车牵引杆市场报告范围
| 报告属性 | 细节 |
|---|---|
| 2022 年市场规模 | 51.1098亿美元 |
| 2030 年的市场规模 | 73.1805亿美元 |
| 全球复合年增长率(2022 - 2030 年) | 4.6% |
| 史料 | 2020-2021 |
| 预测期 | 2022-2030 |
| 涵盖的领域 | 按产品
|
| 覆盖地区和国家 | 北美
|
| 市场领导者和主要公司简介 |
|
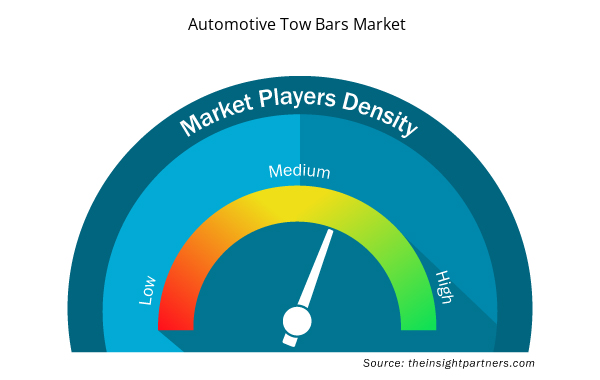
汽车牵引杆市场参与者密度:了解其对业务动态的影响
汽车牵引杆市场正在快速增长,这得益于终端用户需求的不断增长,这些需求源于消费者偏好的不断变化、技术进步以及对产品优势的认识不断提高等因素。随着需求的增加,企业正在扩大其产品范围,进行创新以满足消费者的需求,并利用新兴趋势,从而进一步推动市场增长。
市场参与者密度是指在特定市场或行业内运营的企业或公司的分布情况。它表明在给定市场空间中,相对于其规模或总市场价值,有多少竞争对手(市场参与者)存在。
在汽车牵引杆市场运营的主要公司有:
- 太平洋汽车澳大利亚有限公司
- 博萨尔集团
- 布林克集团
- BTA牵引设备
- CURT 制造有限公司
- 豪利时
免责声明:上面列出的公司没有按照任何特定顺序排列。
- 了解汽车牵引杆市场顶级关键参与者概况
区域分析:
汽车拖车杆市场份额分为五大区域:北美、欧洲、亚太地区、中东和非洲以及南美地区。
美国、加拿大和墨西哥是北美的主要经济体。随着人口不断增长,高消费能力吸引了多项技术发展,技术进步导致北美市场竞争激烈。该地区拥有世界上最大的汽车制造中心之一。知名汽车制造商和零部件制造商的存在正在推动市场价值。北美的经济增长增加了乘用车和商用车的销量。牵引杆用于乘用车、轻型商用车和重型商用车;它们足够坚固,在用于牵引拖车时不会解体。乘用车和商用车销量的增长增加了对汽车牵引杆的需求。欧洲汽车制造商协会 (ACEA) 在 2021 年表示,欧洲乘用车和商用车产量为 1358 万辆。使用轻质材料设计牵引杆可以减轻车辆重量并提高燃油效率,这将为未来几年的汽车牵引杆市场提供丰厚的机会。材料科学领域的多项技术进步推动了汽车牵引杆市场的繁荣。这些发展使得制造商能够使用具有更高抗拉强度的聚合物或金属,从而大大提高牵引杆的功能及其使用寿命。推动汽车牵引杆市场增长的主要因素是牵引杆及其材料的制造技术的快速发展。此外,由于 SUV 需求不断增长,预计在预测期内,北美电动牵引杆的进步将以中等速度增长,这鼓励制造商增加 SUV 的产量。
关键球员分析:
AutoPacific Australia Pty Ltd、Bosal Group、Brink Group、BTA Towing Equipment、CURT Manufacturing LLC、Oris、PCT Automotive Limited、Alois Kober GmbH、North Shore Tow bars 和 GDW NV 是汽车拖车市场上的主要参与者。
最新动态:
全球汽车牵引杆市场中的公司普遍采用并购等无机和有机战略。以下列出了主要汽车牵引杆市场参与者的一些最新发展:
年 | 消息 |
2020 年 11 月 | 排气和旅行设备品牌 Bosal 宣布重建其拖车部门,以服务于新车的售后市场和经销商装配。 |
2020 年 3 月 | Curt Manufacturing 推出了一款新型非约束性牵引杆 Rambler 钢制牵引杆。新推出的产品具有自动锁定机制、三个收起位置和防滑臂,可实现更好的控制和操作。 |
- 历史分析(2 年)、基准年、预测(7 年)及复合年增长率
- PEST 和 SWOT 分析
- 市场规模价值/数量 - 全球、区域、国家
- 行业和竞争格局
- Excel 数据集

Report Coverage
Revenue forecast, Company Analysis, Industry landscape, Growth factors, and Trends

Segment Covered
This text is related
to segments covered.

Regional Scope
North America, Europe, Asia Pacific, Middle East & Africa, South & Central America

Country Scope
This text is related
to country scope.
常见问题
In the past few years, the increase in automotive production, particularly in the advanced regions, including North America and Europe, has driven the growth of the automotive tow bars market. The tow bar for automobiles is available as a standard filament or as an additional feature with most premium passenger car models launched by automotive giants such as Audi, Range Rover, BMW, and Ford Motor Company.
Prominent market vendors have launched electrically operated tow bars for both OEMs and the aftermarket segments of the automotive sector. These tow bars are designed to improve the functionality of conventional tow bars and offer users convenience in terms of operability.
The US, Canada, and Mexico are major economies in North America. Technological advancements have led to a highly competitive market in the region as the increasing population attracts several technological developments due to high spending power. The region has one of the largest automotive manufacturing hubs in the globe.
Bosal Group, Brink Group, CURT Manufacturing LLC, Oris, and PCT Automotive Limited are the key market players operating in the global automotive tow bars market.
Smart tow bars equipped with wireless connectivity and remote-control capabilities make it easier for users to manage towing tasks. Users can control the tow bar from their smartphone or tablet, eliminating the need for manual adjustments and simplifying the hitching and unhitching process.
Trends and growth analysis reports related to Automotive and Transportation : READ MORE..
The List of Companies - Automotive Tow Bars Market
- AutoPacific Australia Pty Ltd
- Bosal Group
- Brink Group
- BTA Towing Equipment
- CURT Manufacturing LLC
- Oris
- PCT Automotive Limited
- Alois Kober GmbH
- North Shore Tow bars
- GDW NV
The Insight Partners performs research in 4 major stages: Data Collection & Secondary Research, Primary Research, Data Analysis and Data Triangulation & Final Review.
- Data Collection and Secondary Research:
As a market research and consulting firm operating from a decade, we have published and advised several client across the globe. First step for any study will start with an assessment of currently available data and insights from existing reports. Further, historical and current market information is collected from Investor Presentations, Annual Reports, SEC Filings, etc., and other information related to company’s performance and market positioning are gathered from Paid Databases (Factiva, Hoovers, and Reuters) and various other publications available in public domain.
Several associations trade associates, technical forums, institutes, societies and organization are accessed to gain technical as well as market related insights through their publications such as research papers, blogs and press releases related to the studies are referred to get cues about the market. Further, white papers, journals, magazines, and other news articles published in last 3 years are scrutinized and analyzed to understand the current market trends.
- Primary Research:
The primarily interview analysis comprise of data obtained from industry participants interview and answers to survey questions gathered by in-house primary team.
For primary research, interviews are conducted with industry experts/CEOs/Marketing Managers/VPs/Subject Matter Experts from both demand and supply side to get a 360-degree view of the market. The primary team conducts several interviews based on the complexity of the markets to understand the various market trends and dynamics which makes research more credible and precise.
A typical research interview fulfils the following functions:
- Provides first-hand information on the market size, market trends, growth trends, competitive landscape, and outlook
- Validates and strengthens in-house secondary research findings
- Develops the analysis team’s expertise and market understanding
Primary research involves email interactions and telephone interviews for each market, category, segment, and sub-segment across geographies. The participants who typically take part in such a process include, but are not limited to:
- Industry participants: VPs, business development managers, market intelligence managers and national sales managers
- Outside experts: Valuation experts, research analysts and key opinion leaders specializing in the electronics and semiconductor industry.
Below is the breakup of our primary respondents by company, designation, and region:

Once we receive the confirmation from primary research sources or primary respondents, we finalize the base year market estimation and forecast the data as per the macroeconomic and microeconomic factors assessed during data collection.
- Data Analysis:
Once data is validated through both secondary as well as primary respondents, we finalize the market estimations by hypothesis formulation and factor analysis at regional and country level.
- Macro-Economic Factor Analysis:
We analyse macroeconomic indicators such the gross domestic product (GDP), increase in the demand for goods and services across industries, technological advancement, regional economic growth, governmental policies, the influence of COVID-19, PEST analysis, and other aspects. This analysis aids in setting benchmarks for various nations/regions and approximating market splits. Additionally, the general trend of the aforementioned components aid in determining the market's development possibilities.
- Country Level Data:
Various factors that are especially aligned to the country are taken into account to determine the market size for a certain area and country, including the presence of vendors, such as headquarters and offices, the country's GDP, demand patterns, and industry growth. To comprehend the market dynamics for the nation, a number of growth variables, inhibitors, application areas, and current market trends are researched. The aforementioned elements aid in determining the country's overall market's growth potential.
- Company Profile:
The “Table of Contents” is formulated by listing and analyzing more than 25 - 30 companies operating in the market ecosystem across geographies. However, we profile only 10 companies as a standard practice in our syndicate reports. These 10 companies comprise leading, emerging, and regional players. Nonetheless, our analysis is not restricted to the 10 listed companies, we also analyze other companies present in the market to develop a holistic view and understand the prevailing trends. The “Company Profiles” section in the report covers key facts, business description, products & services, financial information, SWOT analysis, and key developments. The financial information presented is extracted from the annual reports and official documents of the publicly listed companies. Upon collecting the information for the sections of respective companies, we verify them via various primary sources and then compile the data in respective company profiles. The company level information helps us in deriving the base number as well as in forecasting the market size.
- Developing Base Number:
Aggregation of sales statistics (2020-2022) and macro-economic factor, and other secondary and primary research insights are utilized to arrive at base number and related market shares for 2022. The data gaps are identified in this step and relevant market data is analyzed, collected from paid primary interviews or databases. On finalizing the base year market size, forecasts are developed on the basis of macro-economic, industry and market growth factors and company level analysis.
- Data Triangulation and Final Review:
The market findings and base year market size calculations are validated from supply as well as demand side. Demand side validations are based on macro-economic factor analysis and benchmarks for respective regions and countries. In case of supply side validations, revenues of major companies are estimated (in case not available) based on industry benchmark, approximate number of employees, product portfolio, and primary interviews revenues are gathered. Further revenue from target product/service segment is assessed to avoid overshooting of market statistics. In case of heavy deviations between supply and demand side values, all thes steps are repeated to achieve synchronization.
We follow an iterative model, wherein we share our research findings with Subject Matter Experts (SME’s) and Key Opinion Leaders (KOLs) until consensus view of the market is not formulated – this model negates any drastic deviation in the opinions of experts. Only validated and universally acceptable research findings are quoted in our reports.
We have important check points that we use to validate our research findings – which we call – data triangulation, where we validate the information, we generate from secondary sources with primary interviews and then we re-validate with our internal data bases and Subject matter experts. This comprehensive model enables us to deliver high quality, reliable data in shortest possible time.
 获取此报告的免费样本