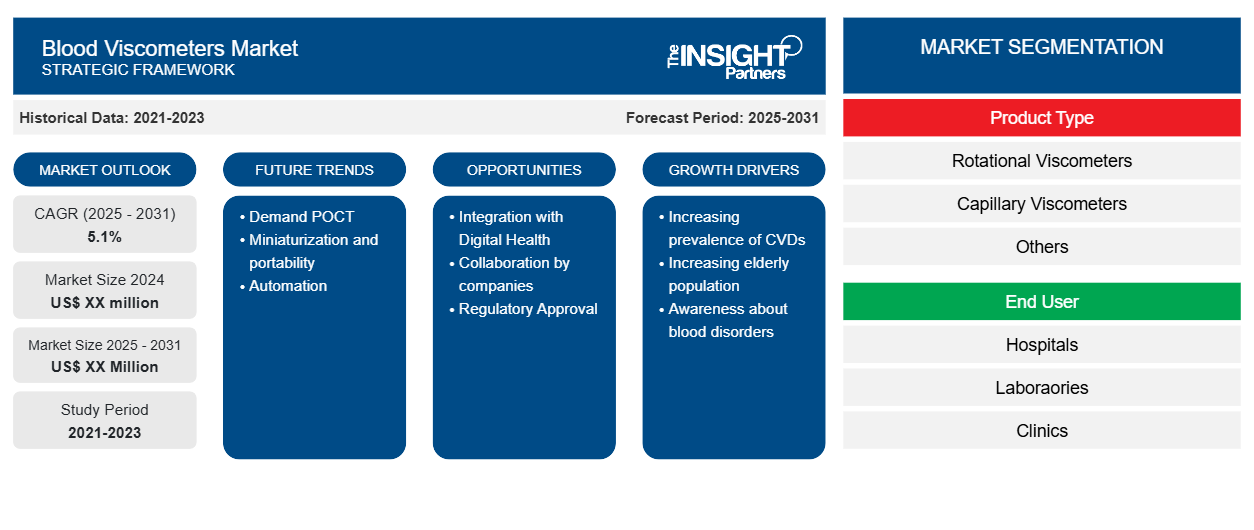
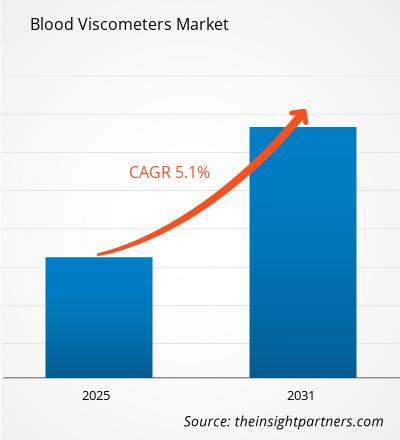
预计血液粘度计市场在 2023 年至 2031 年期间的复合年增长率为 5.1%,市场规模将从 2023 年的 XX 百万美元扩大到 2031 年的 XX 百万美元。
报告按产品类型(旋转粘度计、毛细管粘度计和其他)进行细分。报告进一步根据最终用户(医院、实验室、诊所和其他)进行分析。全球分析进一步细分为区域和主要国家。报告以美元为单位提供上述分析和细分的价值。
报告目的
Insight Partners 的《血液粘度计市场》报告旨在描述当前形势和未来增长、主要驱动因素、挑战和机遇。这将为各种业务利益相关者提供见解,例如:
- 技术提供商/制造商:了解不断变化的市场动态并了解潜在的增长机会,从而能够做出明智的战略决策。
- 投资者:对市场增长率、市场财务预测以及整个价值链中存在的机会进行全面的趋势分析。
- 监管机构:监管市场政策和警察活动,旨在最大限度地减少滥用行为,维护投资者的信任和信心,维护市场的完整性和稳定性。
血液粘度计市场细分
产品类型
- 旋转粘度计
- 毛细管粘度计
- 其他的
最终用户
- 医院
- 实验室
- 诊所
- 其他的
定制此报告以满足您的需求
您可以免费定制任何报告,包括本报告的部分内容、国家级分析、Excel 数据包,以及为初创企业和大学提供优惠和折扣
血液粘度计市场:战略洞察
- 获取此报告的关键市场趋势。这个免费样品将包括数据分析,从市场趋势到估计和预测。
血液粘度计市场增长动力
- 心血管疾病患病率不断上升:心血管疾病 (CVD) 和其他慢性疾病患病率不断上升,导致全球对血液粘度计的需求不断增加。例如,根据世界卫生组织的数据,心血管疾病是全球死亡的主要原因,每年约有 1790 万人死于心血管疾病。根据疾病控制和预防中心的数据,20 岁及以上的成年人中约有 1/20 患有冠状动脉疾病。
- 老年人口增加:人口老龄化极大地影响了血液粘度及其相关疾病。与衰老过程相关的血液内在变化包括红细胞质量增加和血浆蛋白改变,这些变化会增加血液粘度。另一种血液疾病的特征是红细胞生成增加,这在老年人中更为常见,并导致血液粘度升高。
- 对血液疾病的认识:提高对血液疾病和粘度计作用的认识可能在这些疾病的诊断和管理中发挥重要作用。血液粘度计仪器测量血液的粘度,从而有助于评估疾病如何影响血流。高粘度通常会导致凝血或中风等并发症。增强对血液粘度影响和粘度计实用性的认识将有助于患有血液疾病的患者获得更好的临床结果。
血液粘度计市场未来趋势
- 按需即时血液粘度计:即时血液粘度计可快速产生结果;因此,临床领域现在可以立即做出决定。它们有助于减少实验室的处理时间,并增强患者甚至紧急情况的管理。此外,它们可移动,并可带到不同的环境中进行测试,这增加了可访问性和便利性。
- 小型化和便携性:血液粘度计已实现小型化和便携性。这使得该应用可以在医院、诊所甚至家中轻松使用它们,从而提高了在任何地方进行快速评估的可及性,而无需大型设备。它允许更频繁的监测,这对于控制与血液粘度相关的状况可能至关重要。
- 自动化:自动化血液粘度计通过多种优势使测量过程更加简单。大多数自动化粘度计可以与实验室信息系统通信,从而使数据管理更加有效,与电子健康记录的集成更加容易。自动化最大限度地降低了人为错误的风险,结果具有更好的可重复性和可靠性。粘度计中的某些型号具有不同的测试参数,例如粘度和血细胞比容,可以作为单个样本进行评估。总体而言,自动化血液粘度计可增强临床设置的流动性并改善患者的预后。
血液粘度计的市场机会
- 与数字健康相结合:将血液粘度计整合到数字健康技术中,确实可以对患有血液疾病的患者的治疗和护理产生重大影响。通过数字健康平台进行持续或定期监测最终将实现实时数据访问和分析。远程医疗服务还可以作为远程监控的支持,患者可以在家中管理自己的病情,而医疗服务提供者则跟踪他们的血液粘度水平。其他一些被认为是潜在新兴技术的应用包括可实时监测血液粘度的可穿戴粘度计,为患者和医疗服务提供者提供持续反馈。
- 企业合作:合作研发血液粘度计可显著促进此类设备的开发和应用。研究人员可以与各大学合作,汇集血液学家、工程师以及数据科学家,创新粘度计技术。生物技术公司或医疗设备制造商可以参与其中,获得更多资源和专业知识,制造先进的粘度计。
- 监管部门批准:血液粘度计需要获得监管部门批准,这仍然是业务创新和增长的机会。获得美国客户 FDA 和欧洲客户 EMA 等监管机构的批准可以打开国际市场,从而增加销售和分销。与医院和研究机构合作进行更多临床试验和研究,以验证产品的合法性。
血液粘度计市场区域洞察
Insight Partners 的分析师已详细解释了预测期内影响血液粘度计市场的区域趋势和因素。本节还讨论了北美、欧洲、亚太地区、中东和非洲以及南美和中美洲的血液粘度计市场细分和地理位置。
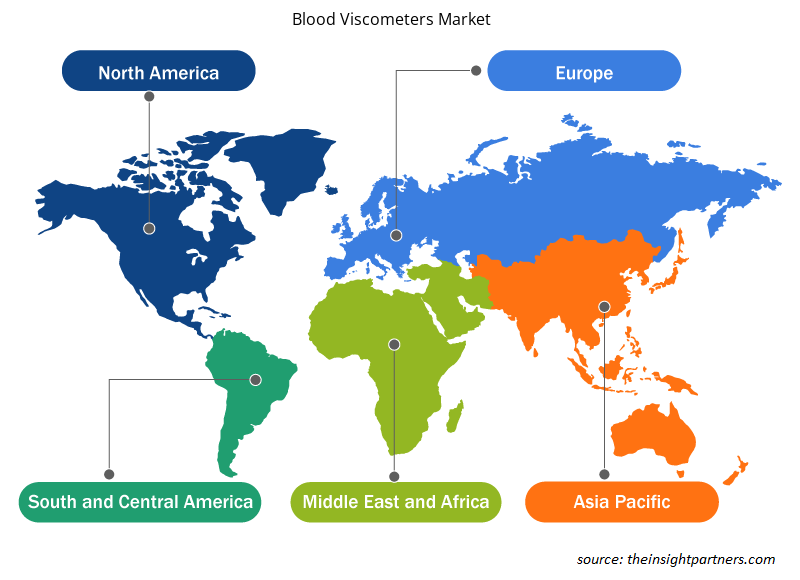
- 获取血液粘度计市场的区域特定数据
血液粘度计市场报告范围
| 报告属性 | 细节 |
|---|---|
| 2023 年的市场规模 | XX 百万美元 |
| 2031 年市场规模 | XX 百万美元 |
| 全球复合年增长率(2023 - 2031) | 5.1% |
| 史料 | 2021-2022 |
| 预测期 | 2024-2031 |
| 涵盖的领域 | 按产品类型
|
| 覆盖地区和国家 | 北美
|
| 市场领导者和主要公司简介 |
|
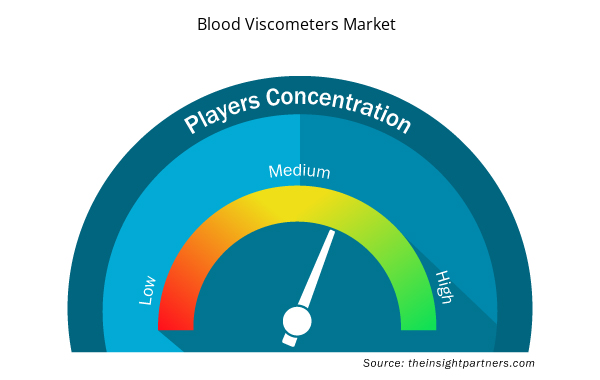
血液粘度计市场参与者密度:了解其对业务动态的影响
血液粘度计市场正在快速增长,这得益于终端用户需求的不断增长,而这些需求又源于消费者偏好的不断变化、技术进步以及对产品优势的认识不断提高等因素。随着需求的增加,企业正在扩大其产品范围,进行创新以满足消费者的需求,并利用新兴趋势,从而进一步推动市场增长。
市场参与者密度是指在特定市场或行业内运营的企业或公司的分布情况。它表明在给定市场空间中,相对于其规模或总市场价值,有多少竞争对手(市场参与者)存在。
在血液粘度计市场运营的主要公司有:
- 赛默飞世尔科技公司
- 安东帕有限公司
- RheoSense公司
- 布鲁克菲尔德资产管理公司
- 生物流体技术
免责声明:上面列出的公司没有按照任何特定顺序排列。
- 了解血液粘度计市场主要参与者概况
主要卖点
- 全面覆盖:报告全面涵盖了血液粘度计市场的产品、服务、类型和最终用户的分析,提供了整体概况。
- 专家分析:报告基于对行业专家和分析师的深入了解而编写。
- 最新信息:该报告涵盖了最新信息和数据趋势,确保了其与业务的相关性。
- 定制选项:此报告可以定制以满足特定客户要求并恰当地适应业务策略。
因此,血液粘度计市场研究报告有助于引领解读和了解行业情景和增长前景。尽管可能存在一些合理的担忧,但本报告的总体优势往往大于劣势。
- 历史分析(2 年)、基准年、预测(7 年)及复合年增长率
- PEST 和 SWOT 分析
- 市场规模价值/数量 - 全球、区域、国家
- 行业和竞争格局
- Excel 数据集

Report Coverage
Revenue forecast, Company Analysis, Industry landscape, Growth factors, and Trends

Segment Covered
This text is related
to segments covered.

Regional Scope
North America, Europe, Asia Pacific, Middle East & Africa, South & Central America

Country Scope
This text is related
to country scope.
常见问题
Players operating in the market are Thermo Fisher Scientific, Microsil India, RheoSense, Benson, Ametek Brookfeild, Acutek, Lasany, and PCE Instruments
Rotational viscometers segment, by product, dominated the market in 2023.
The Blood Viscometers Market is estimated to witness a CAGR of 5.1% from 2023 to 2031
North America region dominated the Ophthalmic Lasers market in 2023.
Integration with Digital Health act as a opportunity for growth of the market in forecast period.
The major factors driving the Blood Viscometers market are:
1. Increasing prevalence of CVDs
2.Awareness about blood disorders
Trends and growth analysis reports related to Life Sciences : READ MORE..
1. Thermo Fisher Scientific Inc.
2. Anton Paar GmbH
3. RheoSense, Inc
4. Brookfield Asset Management Inc.
5. BioFluid Technologies
6. Health Onvector
7. Lamy Rheology
8. Benson Viscometers
9. HRD Antwerp
10. LAUDA-Brinkmann, LP.
The Insight Partners performs research in 4 major stages: Data Collection & Secondary Research, Primary Research, Data Analysis and Data Triangulation & Final Review.
- Data Collection and Secondary Research:
As a market research and consulting firm operating from a decade, we have published and advised several client across the globe. First step for any study will start with an assessment of currently available data and insights from existing reports. Further, historical and current market information is collected from Investor Presentations, Annual Reports, SEC Filings, etc., and other information related to company’s performance and market positioning are gathered from Paid Databases (Factiva, Hoovers, and Reuters) and various other publications available in public domain.
Several associations trade associates, technical forums, institutes, societies and organization are accessed to gain technical as well as market related insights through their publications such as research papers, blogs and press releases related to the studies are referred to get cues about the market. Further, white papers, journals, magazines, and other news articles published in last 3 years are scrutinized and analyzed to understand the current market trends.
- Primary Research:
The primarily interview analysis comprise of data obtained from industry participants interview and answers to survey questions gathered by in-house primary team.
For primary research, interviews are conducted with industry experts/CEOs/Marketing Managers/VPs/Subject Matter Experts from both demand and supply side to get a 360-degree view of the market. The primary team conducts several interviews based on the complexity of the markets to understand the various market trends and dynamics which makes research more credible and precise.
A typical research interview fulfils the following functions:
- Provides first-hand information on the market size, market trends, growth trends, competitive landscape, and outlook
- Validates and strengthens in-house secondary research findings
- Develops the analysis team’s expertise and market understanding
Primary research involves email interactions and telephone interviews for each market, category, segment, and sub-segment across geographies. The participants who typically take part in such a process include, but are not limited to:
- Industry participants: VPs, business development managers, market intelligence managers and national sales managers
- Outside experts: Valuation experts, research analysts and key opinion leaders specializing in the electronics and semiconductor industry.
Below is the breakup of our primary respondents by company, designation, and region:

Once we receive the confirmation from primary research sources or primary respondents, we finalize the base year market estimation and forecast the data as per the macroeconomic and microeconomic factors assessed during data collection.
- Data Analysis:
Once data is validated through both secondary as well as primary respondents, we finalize the market estimations by hypothesis formulation and factor analysis at regional and country level.
- Macro-Economic Factor Analysis:
We analyse macroeconomic indicators such the gross domestic product (GDP), increase in the demand for goods and services across industries, technological advancement, regional economic growth, governmental policies, the influence of COVID-19, PEST analysis, and other aspects. This analysis aids in setting benchmarks for various nations/regions and approximating market splits. Additionally, the general trend of the aforementioned components aid in determining the market's development possibilities.
- Country Level Data:
Various factors that are especially aligned to the country are taken into account to determine the market size for a certain area and country, including the presence of vendors, such as headquarters and offices, the country's GDP, demand patterns, and industry growth. To comprehend the market dynamics for the nation, a number of growth variables, inhibitors, application areas, and current market trends are researched. The aforementioned elements aid in determining the country's overall market's growth potential.
- Company Profile:
The “Table of Contents” is formulated by listing and analyzing more than 25 - 30 companies operating in the market ecosystem across geographies. However, we profile only 10 companies as a standard practice in our syndicate reports. These 10 companies comprise leading, emerging, and regional players. Nonetheless, our analysis is not restricted to the 10 listed companies, we also analyze other companies present in the market to develop a holistic view and understand the prevailing trends. The “Company Profiles” section in the report covers key facts, business description, products & services, financial information, SWOT analysis, and key developments. The financial information presented is extracted from the annual reports and official documents of the publicly listed companies. Upon collecting the information for the sections of respective companies, we verify them via various primary sources and then compile the data in respective company profiles. The company level information helps us in deriving the base number as well as in forecasting the market size.
- Developing Base Number:
Aggregation of sales statistics (2020-2022) and macro-economic factor, and other secondary and primary research insights are utilized to arrive at base number and related market shares for 2022. The data gaps are identified in this step and relevant market data is analyzed, collected from paid primary interviews or databases. On finalizing the base year market size, forecasts are developed on the basis of macro-economic, industry and market growth factors and company level analysis.
- Data Triangulation and Final Review:
The market findings and base year market size calculations are validated from supply as well as demand side. Demand side validations are based on macro-economic factor analysis and benchmarks for respective regions and countries. In case of supply side validations, revenues of major companies are estimated (in case not available) based on industry benchmark, approximate number of employees, product portfolio, and primary interviews revenues are gathered. Further revenue from target product/service segment is assessed to avoid overshooting of market statistics. In case of heavy deviations between supply and demand side values, all thes steps are repeated to achieve synchronization.
We follow an iterative model, wherein we share our research findings with Subject Matter Experts (SME’s) and Key Opinion Leaders (KOLs) until consensus view of the market is not formulated – this model negates any drastic deviation in the opinions of experts. Only validated and universally acceptable research findings are quoted in our reports.
We have important check points that we use to validate our research findings – which we call – data triangulation, where we validate the information, we generate from secondary sources with primary interviews and then we re-validate with our internal data bases and Subject matter experts. This comprehensive model enables us to deliver high quality, reliable data in shortest possible time.
 获取此报告的免费样本