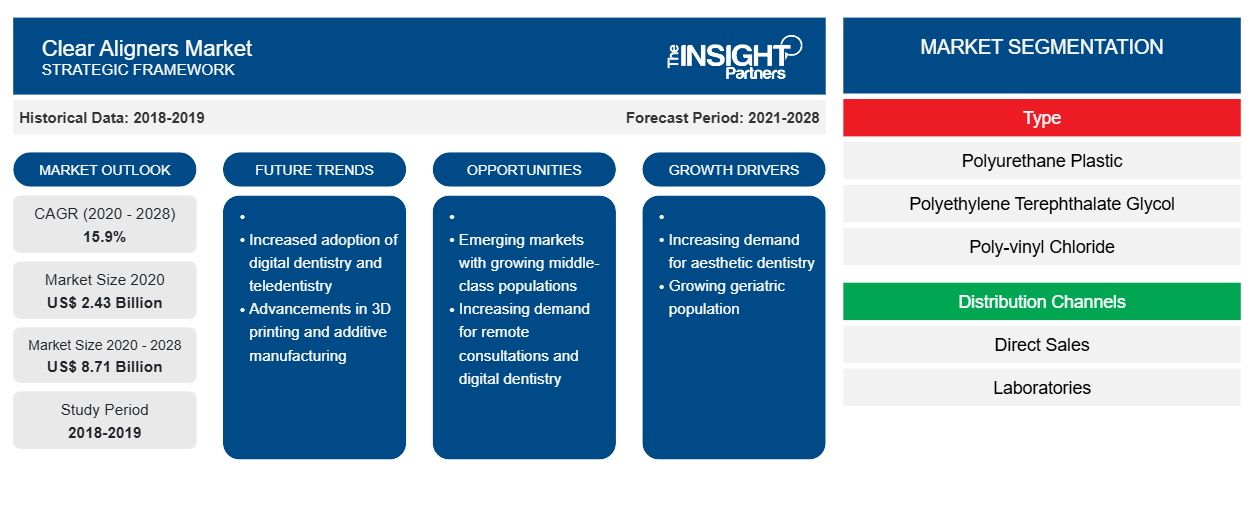
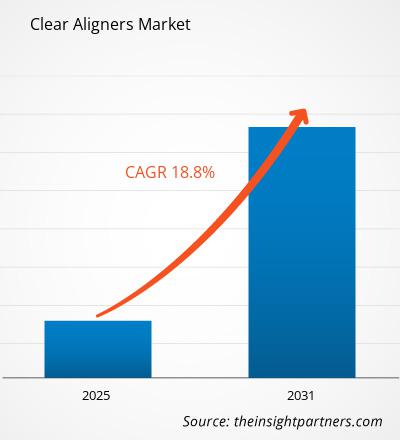
预计到 2031 年,透明矫正器市场规模将从 2024 年的 66 亿美元增至 217.5594 亿美元。预计 2025-2031 年期间,该市场的复合年增长率将达到 18.8%。在预测期内,定制移植物的发展可能会带来新的市场趋势。
透明矫正器市场分析
牙齿不齐、牙齿过度咬合、牙齿反咬、交叉咬合、牙齿间隙、牙齿拥挤和颞下颌关节紊乱 (TMD) 等牙齿和口腔疾病的流行,增加了透明矫正器的使用,从而推动了市场增长。导致牙齿问题的因素包括牙周病、损伤和事故。根据路透社 2022 年发表的一篇文章,全球约有 35 亿人患有口腔疾病,未经治疗的龋齿 (蛀牙) 影响了近 25 亿人。根据美国正畸医师协会的数据,2022 年,美国约有 315 万名 8 至 17 岁的患者正在接受正畸治疗,占该年龄段人口的约 7.4%。根据BMC Oral Health 2025报告,美国接受正畸治疗的成年人数量从2016年的155万增加到2018年的161万。
透明矫正器市场概览
由于审美偏好的提高、技术的进步、口腔健康意识的增强、可支配收入的增加以及远程正畸和远程监控的整合,透明矫正器市场正在不断扩大。可满足个人喜好和牙齿状况的可定制透明矫正器可能是未来的一大机遇。
定制此报告以满足您的需求
您可以免费定制任何报告,包括本报告的部分内容、国家级分析、Excel 数据包,以及为初创企业和大学提供优惠和折扣
透明矫正器市场:
- 获取此报告的关键市场趋势。这个免费样品将包括数据分析,从市场趋势到估计和预测。
透明矫正器市场驱动因素和机遇
儿童错颌畸形患病率不断上升
具有错颌畸形特征(包括上颌骨过度突出、前牙不规则和前牙间隙)的人牙齿外观和咀嚼能力较差。根据《国际牙科论坛报》 2025 年报道,错颌畸形是最常见的临床牙科疾病之一,影响全球约 60% 至 75% 的人口。每年,全球约有 2100 万人选择接受正畸治疗。根据患病率,错颌畸形在全球排名第三,仅次于蛀牙和牙周病。错颌畸形在患有自闭症谱系障碍 (ASD) 的儿童中更为常见。后牙交叉咬合、上颌骨过度突出和上颌骨拥挤不良是儿童中最常见的错颌畸形特征。
根据 Elsevier BVdata,美国严重深覆合的患病率约为 8%,5 至 6 岁儿童的平均覆合率为 36.5% 至 39.2%。美国国家生物技术信息中心 (NCBI) 发表的一项研究对 12 至 18 岁部分青少年群体的咬合情况进行了分析。研究表明,超过 93% 的受试者确诊为某种形式的错颌畸形。欧洲青少年的错颌畸形患病率更高。根据美国国家生物技术信息中心 (NCBI) 2021 年的数据,I 类(34.9%)和 II 类 1 分类错颌畸形(40.0%)的病例较高。人群中报告的错颌畸形增加(18%)、咬合减少(14%)、牙齿覆盖增加(25.1%)和反向错颌畸形(10%)。根据 PeerJ Journal 2019 年发布的数据,日本 12 至 15 岁青少年中 Angle 类 II 的患病率较高,为 38.2%。女孩的前牙拥挤比男孩更普遍。因此,青少年错颌畸形发病率的上升正在增加透明矫正器的使用,从而推动市场增长。
美容牙科手术需求不断增长
牙科美容手术是全球最常见的美容手术之一。美国美容牙科学会 (AACD) 是患者在尝试维持健康功能和寻找终身外观时的主要牙科资源。根据美国整形外科学会 (ASPS) 2022 年的数据,美容牙科最近经历了一次繁荣,51 至 64 岁人群的手术需求增加了 47%。根据 GlobeNewswire 2025,全球每年进行近 3000 万次美容牙科手术,包括从牙齿美白到复杂的全口重建的治疗。美容手术不再仅限于富人和名人。北美的中产阶级人口正在接受这些手术,因为他们越来越渴望增强审美吸引力。外科牙科手术的易得性促进了透明矫正器的采用。
在墨西哥,牙齿美容手术的费用较低。该国普通美容牙科手术和顶级美容牙科手术的价格差额约为每牙冠或每贴面 50 至 150 美元。墨西哥牙医提供的牙冠成本较低,且采用优质材料在实验室中制作。亚洲国家正在努力实现成本更低、方法更先进的美容手术。泰国、新加坡、印度和马来西亚是牙齿美容手术的首选目的地。患者来自美国和英国等发达国家,选择新加坡进行治疗。这些国家有牙科水疗中心,为患者提供创新的牙科治疗和手术。例如,曼谷牙科水疗中心(位于泰国曼谷)为海外患者提供牙科服务。因此,牙齿美容手术的成本效益推动了透明矫正器的使用并推动了市场增长。
透明矫正器市场报告细分分析
有助于得出透明矫正器市场分析的关键部分是类型、年龄组和最终用户。
- 根据类型,透明矫正器市场分为聚氨酯塑料、聚对苯二甲酸乙二醇酯 (PETG)、聚氯乙烯 (PVC) 等。聚氨酯塑料在 2024 年占据了透明矫正器市场的最大份额。
- 就年龄组而言,市场分为成人和儿童。2024 年,成人群体在透明矫正器市场中占有最大份额。
- 根据最终用户,市场分为医院和零售药店、在线渠道和其他渠道。2024 年,医院和零售药店占据了透明矫正器市场的最大份额。
透明矫正器市场份额按地区分析
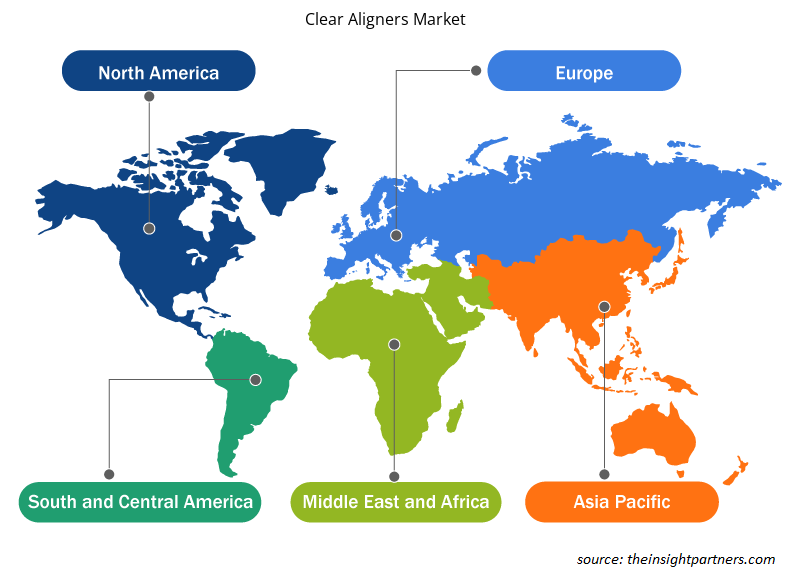
透明矫正器市场报告的地理范围主要集中在五个地区:北美、亚太地区、欧洲、南美和中美以及中东和非洲。就收入而言,北美在 2024 年占据了市场主导地位。预计在预测期内,北美将继续占据市场主导地位。美国占透明矫正器市场的很大一部分,每年进行的手术数量相当可观。根据 2023 年在 Biores Scientia Journal 上发表的牙科和口腔保健研究,在美国,近 30% 的人咬合正常,I 类错颌畸形的患病率为 50-55%。错颌畸形的患病率不断上升,这推动了对透明矫正器的需求,因为它们比传统的金属牙套更美观、舒适和方便。透明矫正器几乎是隐形的,可以拆卸,这使其成为成年人和青少年更有吸引力的选择,他们希望矫正牙齿,而不需要传统正畸的可见性和不便性。此外,与需要定期调整的传统牙套相比,它们还提供了减少就诊次数的便利。实施产品发布、产品批准和合作等战略举措的关键参与者推动了市场增长。2024 年 5 月,OrthoFX 推出了新一代先进的透明矫正器聚合物 NiTime Clear Aligners。它是第一个也是唯一一个明确设计用于缩短佩戴时间的透明矫正器系统,已获得美国食品药品监督管理局 (FDA) 510(k) 批准,可供全国范围内治疗所有类型牙齿错颌畸形的医生使用。
透明矫正器市场区域洞察
Insight Partners 的分析师已详尽解释了预测期内影响透明矫正器市场的区域趋势和因素。本节还讨论了北美、欧洲、亚太地区、中东和非洲以及南美和中美洲的透明矫正器市场细分和地理位置。
- 获取透明矫正器市场的区域特定数据
透明矫正器市场报告范围
| 报告属性 | 细节 |
|---|---|
| 2024 年的市场规模 | 66亿美元 |
| 2031 年市场规模 | 217.5594亿美元 |
| 全球复合年增长率(2025 - 2031) | 18.8% |
| 史料 | 2021-2023 |
| 预测期 | 2024-2031 |
| 涵盖的领域 | 按类型
|
| 覆盖地区和国家 | 北美
|
| 市场领导者和主要公司简介 |
|
透明矫正器市场参与者密度:了解其对业务动态的影响
透明矫正器市场正在快速增长,这得益于最终用户需求的不断增长,这些需求源于消费者偏好的不断变化、技术进步以及对产品优势的认识不断提高等因素。随着需求的增加,企业正在扩大其产品范围,进行创新以满足消费者的需求,并利用新兴趋势,从而进一步推动市场增长。
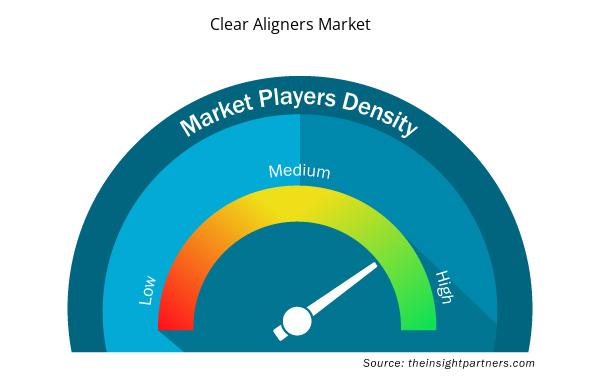
市场参与者密度是指在特定市场或行业内运营的企业或公司的分布情况。它表明在给定市场空间中,相对于其规模或总市场价值,有多少竞争对手(市场参与者)存在。
在透明矫正器市场运营的主要公司有:
- Align Technology Inc.
- 登士柏西诺德
- 丹纳赫
- 施特劳曼公司研究所
- 3M
- 亨利·沙因公司
免责声明:上面列出的公司没有按照任何特定顺序排列。
- 获取透明矫正器市场顶级关键参与者概述
透明矫正器市场新闻和最新发展
通过收集一手和二手研究后的定性和定量数据来评估透明矫正器市场,其中包括重要的公司出版物、协会数据和数据库。以下是透明矫正器市场见证的一些关键发展:
- Henry Schein UK 推出了 Smilers 和 Smilers Expert,这是针对普通牙科医生和正畸医生的双重矫正器解决方案。据 Henry Schein 称,这些产品为错颌畸形提供可定制的治疗,使牙科医生能够提供优质的正畸护理。(来源 Henry Schein UK,2025 年 2 月)
- Align Technology, Inc. 宣布,其 Invisalign 腭扩张器系统已根据医疗器械法规 (MDR 2017/745) 在欧洲获得 CE 标志。Invisalign 腭扩张器系统已完成英国和海外领土 MHRA 的注册。(来源:Align Technology, Inc.,新闻稿,2024 年 11 月)
透明矫正器市场报告覆盖范围和交付成果
“透明矫正器市场规模和预测(2021-2031)”报告对市场进行了详细分析,涵盖以下领域:
- 范围内涵盖的所有关键细分市场的全球、区域和国家层面的透明矫正器市场规模和预测
- 透明矫正器的市场趋势以及市场动态,如驱动因素、限制因素和关键机遇
- 详细的 PEST 和 SWOT 分析
- 透明矫正器市场分析涵盖主要市场趋势、全球和区域框架、主要参与者、法规和最新市场发展
- 行业格局和竞争分析,涵盖市场集中度、热图分析、知名参与者以及透明矫正器市场的最新发展
- 详细的公司简介
- 历史分析(2 年)、基准年、预测(7 年)及复合年增长率
- PEST 和 SWOT 分析
- 市场规模价值/数量 - 全球、区域、国家
- 行业和竞争格局
- Excel 数据集

Report Coverage
Revenue forecast, Company Analysis, Industry landscape, Growth factors, and Trends

Segment Covered
This text is related
to segments covered.

Regional Scope
North America, Europe, Asia Pacific, Middle East & Africa, South & Central America

Country Scope
This text is related
to country scope.
常见问题
North America dominated the market in 2024.
The rising incidence of dental disorders and increasing prevalence of malocclusions among children are significant factors fueling the market growth.
The clear aligners market value is expected to reach US$ 21,755.94 million by 2031.
The growing digitization of CAD/CAM technology is likely to emerge as a new growth trend in the market in the coming years.
Align Technology Inc., Dentsply Sirona, Danaher, Institut Straumann AG, 3M, Henry Schein Inc., TP Orthodontics Inc., DynaFlex, Great Lakes Dental Technologies, and SCHEU DENTAL GmbH are among the key players operating in the market.
The market is expected to register a CAGR of 18.8% during 2024–2031.
Trends and growth analysis reports related to Life Sciences : READ MORE..
The List of Companies - Clear Aligners Market
- Align Technology Inc.
- Dentsply Sirona
- Danaher
- Institut Straumann AG
- 3M
- Henry Schein Inc.
- TP Orthodontics Inc.
- DynaFlex
- Great Lakes Dental Technologies
- SCHEU DENTAL GmbH
The Insight Partners performs research in 4 major stages: Data Collection & Secondary Research, Primary Research, Data Analysis and Data Triangulation & Final Review.
- Data Collection and Secondary Research:
As a market research and consulting firm operating from a decade, we have published and advised several client across the globe. First step for any study will start with an assessment of currently available data and insights from existing reports. Further, historical and current market information is collected from Investor Presentations, Annual Reports, SEC Filings, etc., and other information related to company’s performance and market positioning are gathered from Paid Databases (Factiva, Hoovers, and Reuters) and various other publications available in public domain.
Several associations trade associates, technical forums, institutes, societies and organization are accessed to gain technical as well as market related insights through their publications such as research papers, blogs and press releases related to the studies are referred to get cues about the market. Further, white papers, journals, magazines, and other news articles published in last 3 years are scrutinized and analyzed to understand the current market trends.
- Primary Research:
The primarily interview analysis comprise of data obtained from industry participants interview and answers to survey questions gathered by in-house primary team.
For primary research, interviews are conducted with industry experts/CEOs/Marketing Managers/VPs/Subject Matter Experts from both demand and supply side to get a 360-degree view of the market. The primary team conducts several interviews based on the complexity of the markets to understand the various market trends and dynamics which makes research more credible and precise.
A typical research interview fulfils the following functions:
- Provides first-hand information on the market size, market trends, growth trends, competitive landscape, and outlook
- Validates and strengthens in-house secondary research findings
- Develops the analysis team’s expertise and market understanding
Primary research involves email interactions and telephone interviews for each market, category, segment, and sub-segment across geographies. The participants who typically take part in such a process include, but are not limited to:
- Industry participants: VPs, business development managers, market intelligence managers and national sales managers
- Outside experts: Valuation experts, research analysts and key opinion leaders specializing in the electronics and semiconductor industry.
Below is the breakup of our primary respondents by company, designation, and region:

Once we receive the confirmation from primary research sources or primary respondents, we finalize the base year market estimation and forecast the data as per the macroeconomic and microeconomic factors assessed during data collection.
- Data Analysis:
Once data is validated through both secondary as well as primary respondents, we finalize the market estimations by hypothesis formulation and factor analysis at regional and country level.
- Macro-Economic Factor Analysis:
We analyse macroeconomic indicators such the gross domestic product (GDP), increase in the demand for goods and services across industries, technological advancement, regional economic growth, governmental policies, the influence of COVID-19, PEST analysis, and other aspects. This analysis aids in setting benchmarks for various nations/regions and approximating market splits. Additionally, the general trend of the aforementioned components aid in determining the market's development possibilities.
- Country Level Data:
Various factors that are especially aligned to the country are taken into account to determine the market size for a certain area and country, including the presence of vendors, such as headquarters and offices, the country's GDP, demand patterns, and industry growth. To comprehend the market dynamics for the nation, a number of growth variables, inhibitors, application areas, and current market trends are researched. The aforementioned elements aid in determining the country's overall market's growth potential.
- Company Profile:
The “Table of Contents” is formulated by listing and analyzing more than 25 - 30 companies operating in the market ecosystem across geographies. However, we profile only 10 companies as a standard practice in our syndicate reports. These 10 companies comprise leading, emerging, and regional players. Nonetheless, our analysis is not restricted to the 10 listed companies, we also analyze other companies present in the market to develop a holistic view and understand the prevailing trends. The “Company Profiles” section in the report covers key facts, business description, products & services, financial information, SWOT analysis, and key developments. The financial information presented is extracted from the annual reports and official documents of the publicly listed companies. Upon collecting the information for the sections of respective companies, we verify them via various primary sources and then compile the data in respective company profiles. The company level information helps us in deriving the base number as well as in forecasting the market size.
- Developing Base Number:
Aggregation of sales statistics (2020-2022) and macro-economic factor, and other secondary and primary research insights are utilized to arrive at base number and related market shares for 2022. The data gaps are identified in this step and relevant market data is analyzed, collected from paid primary interviews or databases. On finalizing the base year market size, forecasts are developed on the basis of macro-economic, industry and market growth factors and company level analysis.
- Data Triangulation and Final Review:
The market findings and base year market size calculations are validated from supply as well as demand side. Demand side validations are based on macro-economic factor analysis and benchmarks for respective regions and countries. In case of supply side validations, revenues of major companies are estimated (in case not available) based on industry benchmark, approximate number of employees, product portfolio, and primary interviews revenues are gathered. Further revenue from target product/service segment is assessed to avoid overshooting of market statistics. In case of heavy deviations between supply and demand side values, all thes steps are repeated to achieve synchronization.
We follow an iterative model, wherein we share our research findings with Subject Matter Experts (SME’s) and Key Opinion Leaders (KOLs) until consensus view of the market is not formulated – this model negates any drastic deviation in the opinions of experts. Only validated and universally acceptable research findings are quoted in our reports.
We have important check points that we use to validate our research findings – which we call – data triangulation, where we validate the information, we generate from secondary sources with primary interviews and then we re-validate with our internal data bases and Subject matter experts. This comprehensive model enables us to deliver high quality, reliable data in shortest possible time.
 获取此报告的免费样本