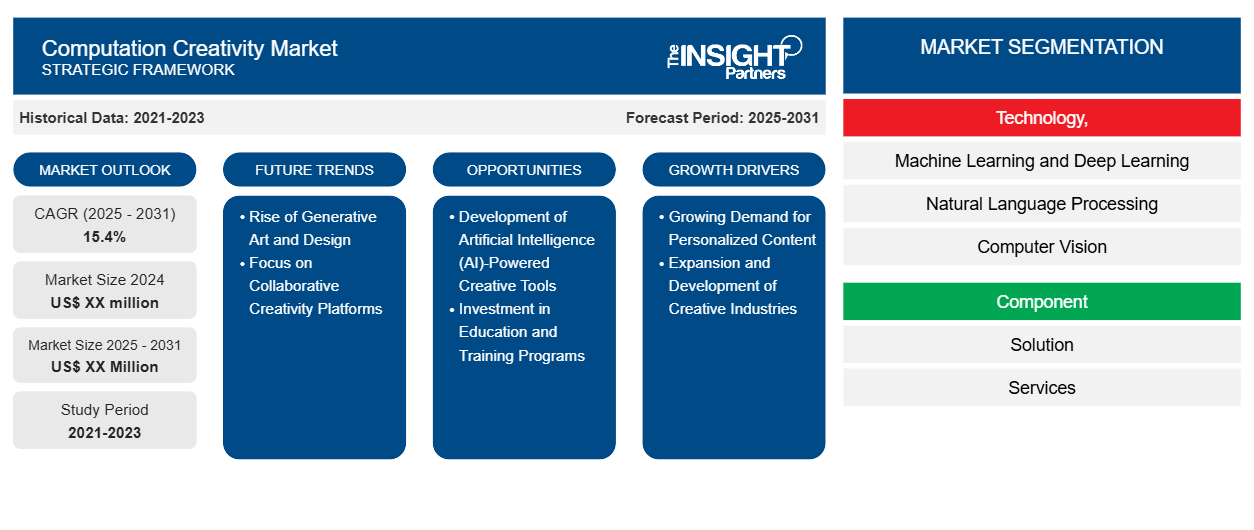
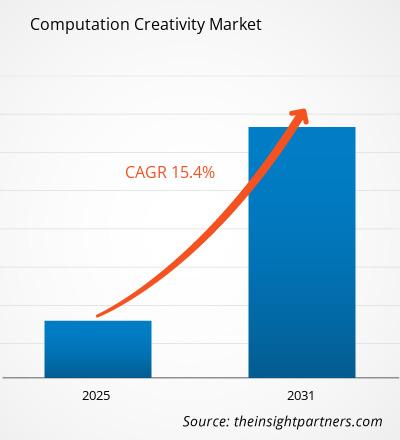
预计计算创造力市场在 2023 年至 2031 年期间的复合年增长率为 15.4%,市场规模将从 2023 年的 XX 百万美元扩大到 2031 年的 XX 百万美元。
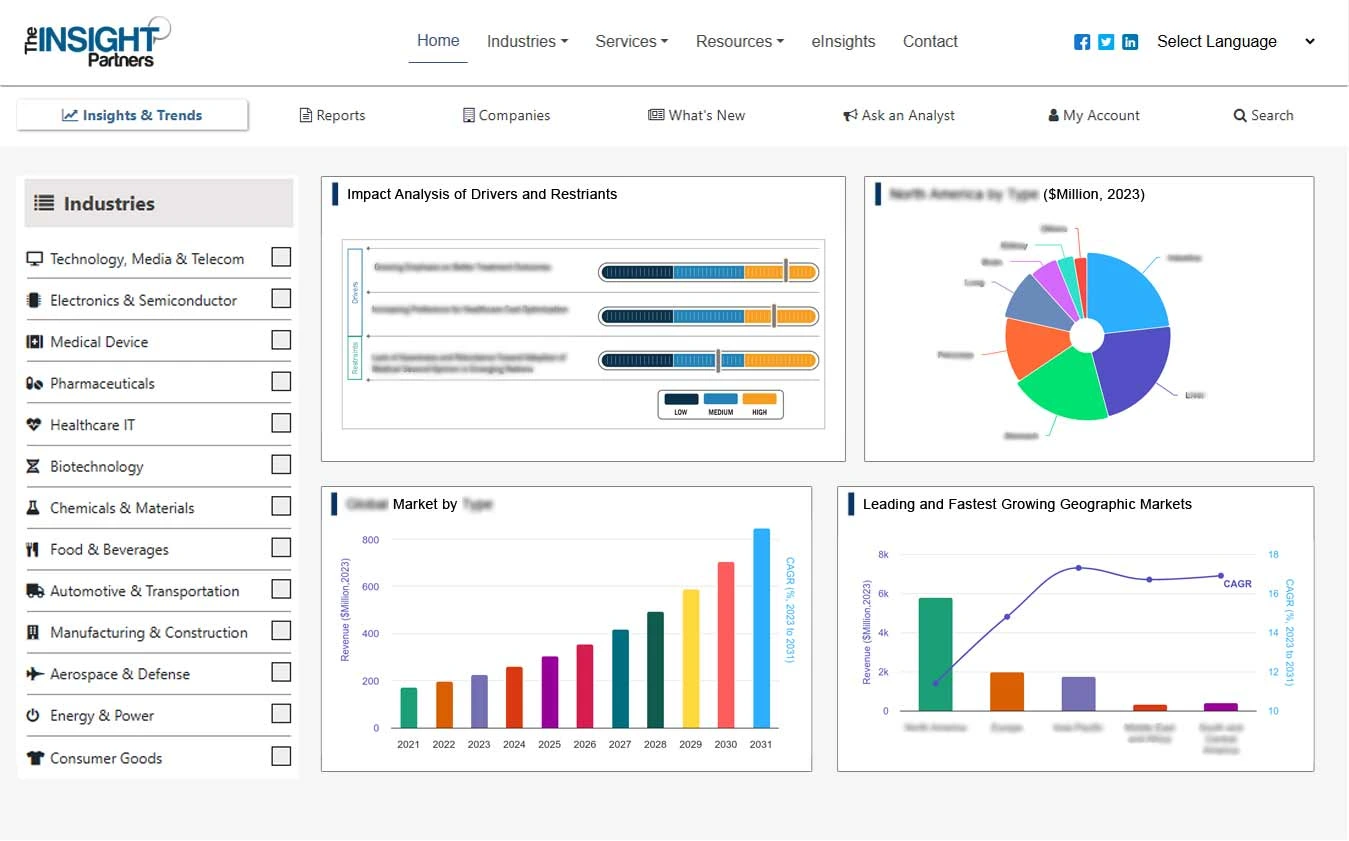
报告按技术(机器学习和深度学习、自然语言处理、计算机视觉)细分;组件(解决方案、服务);应用(营销和网页设计、产品设计、音乐创作、摄影和摄像、高端视频游戏开发、自动故事生成)。全球分析进一步细分为区域和主要国家。报告以美元为单位提供上述分析和细分的价值。
报告目的
Insight Partners 发布的《计算创造力市场》报告旨在描述当前形势和未来增长、主要驱动因素、挑战和机遇。这将为各种业务利益相关者提供见解,例如:
- 技术提供商/制造商:了解不断变化的市场动态并了解潜在的增长机会,从而能够做出明智的战略决策。
- 投资者:对市场增长率、市场财务预测以及整个价值链中存在的机会进行全面的趋势分析。
- 监管机构:监管市场政策和警察活动,旨在最大限度地减少滥用行为,维护投资者的信任和信心,维护市场的完整性和稳定性。
计算创造力市场细分
技术,
- 机器学习和深度学习
- 自然语言处理
- 计算机视觉
成分
- 解决方案
- 服务
应用
- 市场营销和网页设计
- 产品设计
- 音乐创作
- 摄影和摄像
- 高端视频游戏开发
- 自动故事生成
地理
- 北美
- 欧洲
- 亚太
- 南美洲和中美洲
- 中东和非洲
地理
- 北美
- 欧洲
- 亚太
- 南美洲和中美洲
- 中东和非洲
定制此报告以满足您的需求
您可以免费定制任何报告,包括本报告的部分内容、国家级分析、Excel 数据包,以及为初创企业和大学提供优惠和折扣
计算创造力市场:战略洞察
- 获取此报告的关键市场趋势。这个免费样品将包括数据分析,从市场趋势到估计和预测。
计算创造力市场增长动力
- 个性化内容需求不断增长:在信息过载的时代,对满足个人偏好和需求的个性化内容的需求日益增长。计算创意工具利用数据分析来创造量身定制的体验,增强营销、娱乐和教育等各个领域的客户参与度。随着品牌努力与受众建立更深层次的联系,使用计算方法生成独特和个性化内容的能力成为重要的竞争优势,推动市场增长。
- 创意产业的扩张和发展:创意产业的扩张,包括游戏、电影和数字媒体,在推动计算创意市场方面发挥着关键作用。随着这些行业的不断发展和创新,对能够简化创作过程、提高生产力和促进创意团队之间协作的先进工具的需求日益增加。对将计算创意集成到生产流程中的复杂解决方案的需求正在推动市场增长并为技术进步开辟新的途径。
计算创造力市场未来趋势
- 生成艺术和设计的兴起:生成艺术和设计的兴起正在重塑计算创意市场的格局。艺术家和设计师正在尝试使用算法和计算技术来创作独特且具有视觉冲击力的艺术作品。这一趋势不仅使艺术创作民主化,而且还鼓励艺术家和技术人员之间的合作。随着生成艺术越来越受欢迎,支持这一运动的平台和工具也纷纷涌现,推动创新并拓展创意表达的视野。
- 关注协作创意平台:人们越来越关注协作创意平台,这些平台使团队能够无缝协作,不受地理位置的限制。这些平台利用基于云的技术和人工智能来促进实时协作,允许多个用户同时为创意项目做出贡献。随着远程工作变得越来越普遍,对此类平台的需求也在不断增加,从而催生了一个创意协作和创新的新时代,从而增强了整体创意过程。
计算创造力市场机会
- 开发人工智能 (AI) 驱动的创意工具:人工智能的持续进步为开发适合各个行业的人工智能驱动的创意工具提供了重要机会。公司可以投资开发利用人工智能功能的专业软件,以协助专业人员生成内容、增强设计或自动执行重复性任务。通过提供简化创意流程的创新解决方案,企业可以在快速变化的环境中占领市场份额并满足创作者、教育工作者和营销人员不断变化的需求。
- 投资教育和培训项目:随着计算创造力工具的日益普及,对教育和培训项目的需求也日益增长,这些项目旨在使个人掌握有效利用这些技术的技能。这为教育机构和企业提供了一个机会,可以开发专注于计算创造力、人工智能和设计思维的课程和培训模块。通过投资教育计划,组织可以创建一支能够利用先进工具和技术的熟练劳动力队伍,最终推动该领域的创新和增长。
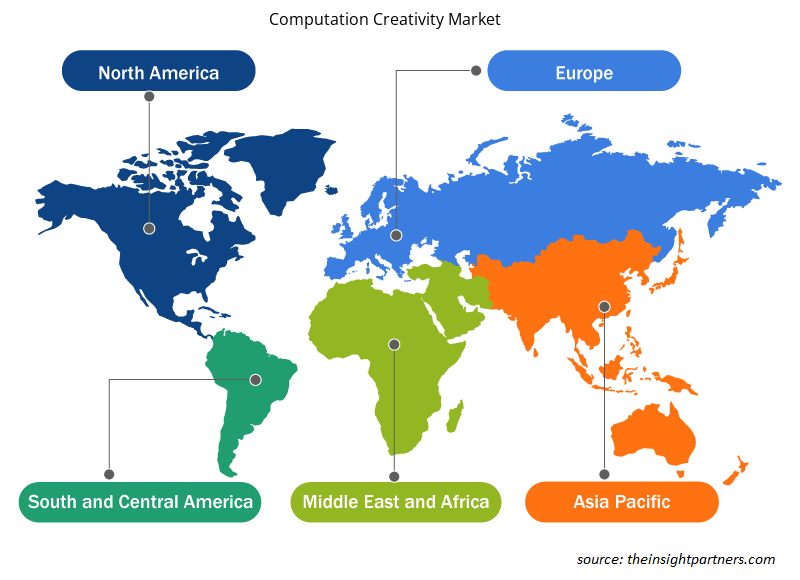
计算创造力市场区域洞察
Insight Partners 的分析师已详细解释了预测期内影响计算创造力市场的区域趋势和因素。本节还讨论了北美、欧洲、亚太地区、中东和非洲以及南美和中美洲的计算创造力市场细分和地理位置。
- 获取计算创造力市场的区域特定数据
计算创造力市场报告范围
| 报告属性 | 细节 |
|---|---|
| 2023 年的市场规模 | XX 百万美元 |
| 2031 年市场规模 | XX 百万美元 |
| 全球复合年增长率(2023 - 2031) | 15.4% |
| 史料 | 2021-2022 |
| 预测期 | 2024-2031 |
| 涵盖的领域 | 通过技术,
|
| 覆盖地区和国家 | 北美
|
| 市场领导者和主要公司简介 |
|
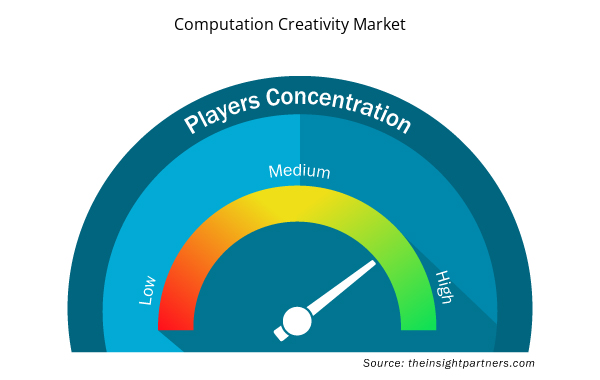
计算创造力市场参与者密度:了解其对业务动态的影响
计算创意市场正在快速增长,这得益于终端用户需求的不断增长,而这些需求又源于消费者偏好的不断变化、技术进步以及对产品优势的认识不断提高等因素。随着需求的增加,企业正在扩大其产品范围,进行创新以满足消费者的需求,并利用新兴趋势,从而进一步推动市场增长。
市场参与者密度是指在特定市场或行业内运营的企业或公司的分布情况。它表明在给定市场空间中,相对于其规模或总市场价值,有多少竞争对手(市场参与者)存在。
在计算创造力市场运营的主要公司有:
- IBM
- 微软
- 谷歌
- Adobe
- 亚马逊网络服务公司
免责声明:上面列出的公司没有按照任何特定顺序排列。
- 获取计算创造力市场顶级关键参与者的概述
主要卖点
- 全面覆盖:报告全面涵盖了计算创造力市场的产品、服务、类型和最终用户的分析,提供了整体概况。
- 专家分析:报告基于对行业专家和分析师的深入了解而编写。
- 最新信息:该报告涵盖了最新信息和数据趋势,确保了其与业务的相关性。
- 定制选项:此报告可以定制以满足特定客户要求并恰当地适应业务策略。
因此,计算创意市场研究报告有助于引领解读和了解行业情景和增长前景。尽管可能存在一些合理的担忧,但本报告的总体优势往往大于劣势。
- 历史分析(2 年)、基准年、预测(7 年)及复合年增长率
- PEST 和 SWOT 分析
- 市场规模价值/数量 - 全球、区域、国家
- 行业和竞争格局
- Excel 数据集
- Non-Emergency Medical Transportation Market
- Maritime Analytics Market
- Influenza Vaccines Market
- Environmental Consulting Service Market
- Artwork Management Software Market
- Adaptive Traffic Control System Market
- Diaper Packaging Machine Market
- Microcatheters Market
- Enzymatic DNA Synthesis Market
- Small Satellite Market

Report Coverage
Revenue forecast, Company Analysis, Industry landscape, Growth factors, and Trends

Segment Covered
This text is related
to segments covered.

Regional Scope
North America, Europe, Asia Pacific, Middle East & Africa, South & Central America

Country Scope
This text is related
to country scope.
常见问题
Some of the customization options available based on the request are an additional 3-5 company profiles and country-specific analysis of 3-5 countries of your choice. Customizations are to be requested/discussed before making final order confirmation# as our team would review the same and check the feasibility
The report can be delivered in PDF/PPT format; we can also share excel dataset based on the request
The major factors driving the Computation Creativity market are Rise in Digital Transformation and Automation and Growing Demand for Content Personalization and Localization.
The adoption of cloud and SaaS solutions is anticipated to play a significant role in the global Computation Creativity market in the coming years.
The Computation Creativity Market is estimated to witness a CAGR of 15.4% from 2023 to 2031
Trends and growth analysis reports related to Technology, Media and Telecommunications : READ MORE..
1. IBM
2. Microsoft
3. Google
4. Adobe
5. Amazon Web Service, Inc.
6. Autodesk Inc.
7. Automated Creative
8. Prisma Labs, Inc.
9. Lumen5
10. Hello Games
The Insight Partners performs research in 4 major stages: Data Collection & Secondary Research, Primary Research, Data Analysis and Data Triangulation & Final Review.
- Data Collection and Secondary Research:
As a market research and consulting firm operating from a decade, we have published and advised several client across the globe. First step for any study will start with an assessment of currently available data and insights from existing reports. Further, historical and current market information is collected from Investor Presentations, Annual Reports, SEC Filings, etc., and other information related to company’s performance and market positioning are gathered from Paid Databases (Factiva, Hoovers, and Reuters) and various other publications available in public domain.
Several associations trade associates, technical forums, institutes, societies and organization are accessed to gain technical as well as market related insights through their publications such as research papers, blogs and press releases related to the studies are referred to get cues about the market. Further, white papers, journals, magazines, and other news articles published in last 3 years are scrutinized and analyzed to understand the current market trends.
- Primary Research:
The primarily interview analysis comprise of data obtained from industry participants interview and answers to survey questions gathered by in-house primary team.
For primary research, interviews are conducted with industry experts/CEOs/Marketing Managers/VPs/Subject Matter Experts from both demand and supply side to get a 360-degree view of the market. The primary team conducts several interviews based on the complexity of the markets to understand the various market trends and dynamics which makes research more credible and precise.
A typical research interview fulfils the following functions:
- Provides first-hand information on the market size, market trends, growth trends, competitive landscape, and outlook
- Validates and strengthens in-house secondary research findings
- Develops the analysis team’s expertise and market understanding
Primary research involves email interactions and telephone interviews for each market, category, segment, and sub-segment across geographies. The participants who typically take part in such a process include, but are not limited to:
- Industry participants: VPs, business development managers, market intelligence managers and national sales managers
- Outside experts: Valuation experts, research analysts and key opinion leaders specializing in the electronics and semiconductor industry.
Below is the breakup of our primary respondents by company, designation, and region:

Once we receive the confirmation from primary research sources or primary respondents, we finalize the base year market estimation and forecast the data as per the macroeconomic and microeconomic factors assessed during data collection.
- Data Analysis:
Once data is validated through both secondary as well as primary respondents, we finalize the market estimations by hypothesis formulation and factor analysis at regional and country level.
- Macro-Economic Factor Analysis:
We analyse macroeconomic indicators such the gross domestic product (GDP), increase in the demand for goods and services across industries, technological advancement, regional economic growth, governmental policies, the influence of COVID-19, PEST analysis, and other aspects. This analysis aids in setting benchmarks for various nations/regions and approximating market splits. Additionally, the general trend of the aforementioned components aid in determining the market's development possibilities.
- Country Level Data:
Various factors that are especially aligned to the country are taken into account to determine the market size for a certain area and country, including the presence of vendors, such as headquarters and offices, the country's GDP, demand patterns, and industry growth. To comprehend the market dynamics for the nation, a number of growth variables, inhibitors, application areas, and current market trends are researched. The aforementioned elements aid in determining the country's overall market's growth potential.
- Company Profile:
The “Table of Contents” is formulated by listing and analyzing more than 25 - 30 companies operating in the market ecosystem across geographies. However, we profile only 10 companies as a standard practice in our syndicate reports. These 10 companies comprise leading, emerging, and regional players. Nonetheless, our analysis is not restricted to the 10 listed companies, we also analyze other companies present in the market to develop a holistic view and understand the prevailing trends. The “Company Profiles” section in the report covers key facts, business description, products & services, financial information, SWOT analysis, and key developments. The financial information presented is extracted from the annual reports and official documents of the publicly listed companies. Upon collecting the information for the sections of respective companies, we verify them via various primary sources and then compile the data in respective company profiles. The company level information helps us in deriving the base number as well as in forecasting the market size.
- Developing Base Number:
Aggregation of sales statistics (2020-2022) and macro-economic factor, and other secondary and primary research insights are utilized to arrive at base number and related market shares for 2022. The data gaps are identified in this step and relevant market data is analyzed, collected from paid primary interviews or databases. On finalizing the base year market size, forecasts are developed on the basis of macro-economic, industry and market growth factors and company level analysis.
- Data Triangulation and Final Review:
The market findings and base year market size calculations are validated from supply as well as demand side. Demand side validations are based on macro-economic factor analysis and benchmarks for respective regions and countries. In case of supply side validations, revenues of major companies are estimated (in case not available) based on industry benchmark, approximate number of employees, product portfolio, and primary interviews revenues are gathered. Further revenue from target product/service segment is assessed to avoid overshooting of market statistics. In case of heavy deviations between supply and demand side values, all thes steps are repeated to achieve synchronization.
We follow an iterative model, wherein we share our research findings with Subject Matter Experts (SME’s) and Key Opinion Leaders (KOLs) until consensus view of the market is not formulated – this model negates any drastic deviation in the opinions of experts. Only validated and universally acceptable research findings are quoted in our reports.
We have important check points that we use to validate our research findings – which we call – data triangulation, where we validate the information, we generate from secondary sources with primary interviews and then we re-validate with our internal data bases and Subject matter experts. This comprehensive model enables us to deliver high quality, reliable data in shortest possible time.
 获取此报告的免费样本