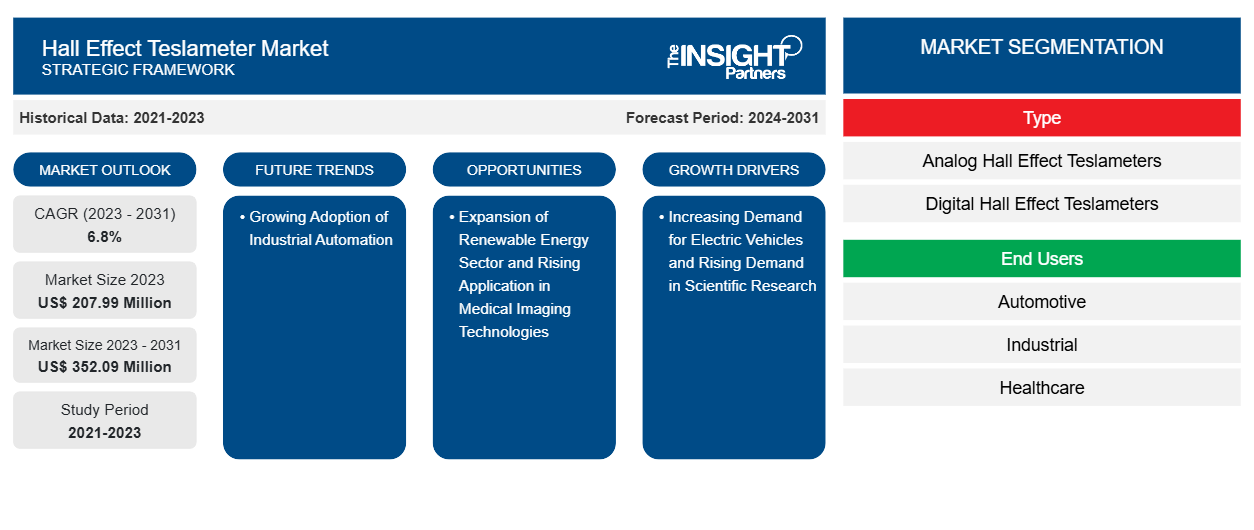
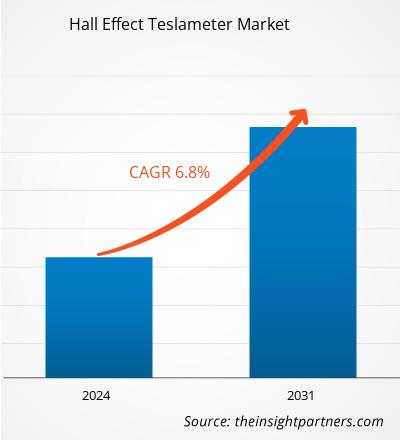
霍尔效应特斯拉计市场规模预计将从 2023 年的 2.0799 亿美元增至 2031 年的 3.5209 亿美元。预计 2023-2031 年期间该市场的复合年增长率将达到 6.8%。工业自动化的日益普及可能会在未来几年为市场带来新的趋势。
霍尔效应特斯拉计市场分析
在政府补贴和向可持续交通转变的推动下,电动汽车的使用日益增多,这是推动霍尔效应特斯拉计市场增长的主要因素之一。由于霍尔效应特斯拉计用于测量电动机、电池系统和其他电子元件中的磁场,因此电动汽车制造商对该产品的需求正在增加。此外,特斯拉计广泛应用于磁相关行业,用于精确测量磁场,这增加了其在科研行业的需求。此外,由于霍尔效应特斯拉计用于测量风力涡轮机和太阳能光伏系统的磁场,不断扩大的可再生能源行业预计将在预测期内为霍尔效应特斯拉计市场增长创造丰厚的机会。此外,随着医疗保健行业对改进成像技术的需求增加,预计预测期内对霍尔效应特斯拉计的需求将激增。
霍尔效应特斯拉计市场概览
特斯拉计(高斯计)是一种用于测量磁通密度的仪器。特斯拉计通常由磁场探头和电子模块组成。探头将观察到的磁场转换为电信号。现代科学和工业中使用的大多数特斯拉计探头都是基于霍尔效应的。由于这些探头具有很高的准确性、精确度和适用性,因此这些设备被广泛应用于研发、学术应用和质量保证等各个学科。此外,霍尔效应特斯拉计是医学和工程领域获得精确磁场测量的重要工具。
定制此报告以满足您的需求
您可以免费定制任何报告,包括本报告的部分内容、国家级分析、Excel 数据包,以及为初创企业和大学提供优惠和折扣
霍尔效应特斯拉计市场:
- 获取此报告的关键市场趋势。这个免费样品将包括数据分析,从市场趋势到估计和预测。
霍尔效应特斯拉计市场驱动因素和机遇
科学研究需求不断增长
霍尔效应特斯拉计广泛应用于磁学相关行业,在科学研究中发挥着关键作用。霍尔效应特斯拉计因其能够提供高精度的磁场强度测量而越来越受科学研究的欢迎。这些测量工具使科学家和工程师能够检查电磁环境、了解材料特性并进行创新实验。此外,霍尔效应特斯拉计使研究人员能够精确量化磁场强度、测试理论模型并获得可重复的结果。由于精度在涉及电磁学、材料测试和粒子物理学的研究中至关重要——其中微小的误差可能会导致重大的结果差异——因此对霍尔效应特斯拉计的需求正在迅速增长。此外,霍尔效应特斯拉计可以精确检测磁场,而不会对研究材料产生物理影响或干扰,这使得它们在材料科学和生物学等领域特别有用,在这些领域保持所研究材料或样品的完整性至关重要。该设备提供精确的读数,没有直接干扰或相互作用,使研究人员无需引入其他因素即可研究自然磁性。此外,材料科学、物理学和生物医学研究等领域都依赖磁场验证来确保实验的成功以及新技术和新疗法的创造。缺乏精确的验证使得最终结果不可靠,从而导致错误的结论,并可能在创新或医学发展中遭遇挫折,这增加了对霍尔效应特斯拉计的需求。因此,科学研究领域对霍尔效应特斯拉计的需求不断增长,推动了市场的增长。
可再生能源领域的扩张
全球能源格局正逐渐转向更可持续和更环保的解决方案,这推动了对可靠磁场测量工具的需求。磁性元件和磁场在风力涡轮机和太阳能光伏(PV) 系统等可再生能源技术中发挥着重要作用。霍尔效应特斯拉计用于测量风力涡轮发电机和电动机的磁场,确保最佳性能和效率。精确的磁场测量对于准确控制风力涡轮机叶片间距是必不可少的,这对于最佳发电至关重要。同样,该设备监测太阳能光伏逆变器和变压器中的磁场,这对于维持系统效率和电能质量至关重要。精确的磁场测量对于精确校准太阳跟踪系统中使用的传感器是必需的,它可以调整太阳能电池板的方向以实现最佳能量生产。此外,全球向可再生能源的转变正在推动太阳能、风能和其他可再生能源行业的扩张。根据国际能源署 (IEA) 的数据,到 2024 年,太阳能光伏 (PV) 技术的投资预计将超过 5000 亿美元,超过所有其他发电来源的总和。此外,在美国,到 2024 年,清洁能源的投资预计将超过 3000 亿美元,是 2020 年的 1.6 倍,超过化石燃料的投资。此外,欧盟预计将在可再生能源上投资 3700 亿美元,中国预计将在 2024 年投资约 6800 亿美元。因此,可再生能源行业的扩张预计将在预测期内为霍尔效应特斯拉计市场的增长创造丰厚的机会。
霍尔效应特斯拉计市场报告细分分析
有助于得出霍尔效应特斯拉计市场分析的关键部分是类型和最终用户。
- 根据类型,霍尔效应特斯拉计市场分为模拟霍尔效应特斯拉计和数字霍尔效应特斯拉计。数字霍尔效应特斯拉计部分在 2023 年占据了市场主导地位。
- 根据最终用户,霍尔效应特斯拉计市场细分为汽车、工业、医疗保健、航空航天、实验室和其他领域。汽车领域在 2023 年占据了市场主导地位。
霍尔效应特斯拉计市场份额按地区分析
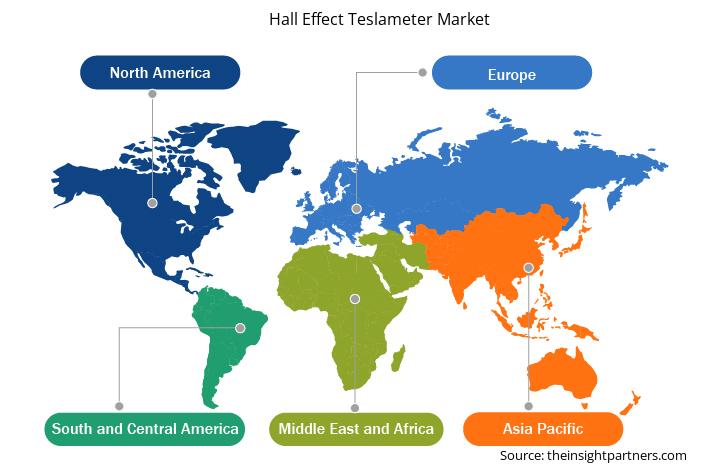
- 霍尔效应特斯拉计市场分为五大区域:北美、欧洲、亚太地区 (APAC)、中东和非洲 (MEA) 以及南美和中美。
- 亚太地区在霍尔效应特斯拉计市场占据主导地位,其次是北美和欧洲。随着电动汽车 (EV) 在中国、日本和韩国等国家的兴起,电动汽车制造商需要霍尔效应特斯拉计来测量安装在电动汽车中的电动机产生的磁场强度。这可以提高电机性能并确保电机在其指定的磁场范围内运行。此外,印度和中国等发展中国家的可支配收入不断增加,为智能可穿戴设备、智能手机和电动汽车等高科技消费电子产品带来了庞大的客户群,从而推动了霍尔效应特斯拉计市场的发展。例如,根据 APMoller–Mersk 的数据,中国在 2022 年将电动汽车普及率提高到 27.6%。预计到 2025 年,这一比例将达到 16%,到 2035 年将达到 49%。预计到 2023 年底,中国电动汽车的总产销量将增加到 1000 万辆。电动汽车在消费者中越来越受欢迎,预计将在预测期内为霍尔效应特斯拉计制造商创造增长机会。霍尔效应传感器用于电池管理系统 (BMS) 中,以监测进出电池组的电流。这些传感器与特斯拉计相连,使它们能够监测与电流相关的磁场,以确认系统在安全参数范围内运行。
霍尔效应特斯拉计市场区域洞察
Insight Partners 的分析师已详尽解释了预测期内影响霍尔效应特斯拉计市场的区域趋势和因素。本节还讨论了霍尔效应特斯拉计市场在北美、欧洲、亚太地区、中东和非洲以及南美和中美的细分市场和地理位置。
- 获取霍尔效应特斯拉计市场的区域特定数据
霍尔效应特斯拉计市场报告范围
| 报告属性 | 细节 |
|---|---|
| 2023 年的市场规模 | 2.0799亿美元 |
| 2031 年市场规模 | 3.5209亿美元 |
| 全球复合年增长率(2023 - 2031) | 6.8% |
| 史料 | 2021-2023 |
| 预测期 | 2024-2031 |
| 涵盖的领域 | 按类型
|
| 覆盖地区和国家 | 北美
|
| 市场领导者和主要公司简介 |
|
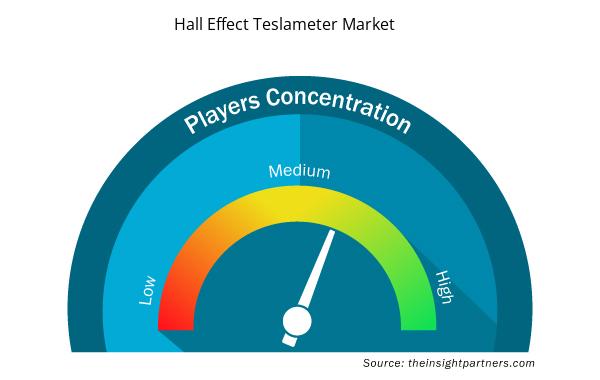
霍尔效应特斯拉计市场参与者密度:了解其对业务动态的影响
霍尔效应特斯拉计市场正在快速增长,这得益于终端用户需求的不断增长,这些需求源于消费者偏好的不断变化、技术进步以及对产品优势的认识不断提高等因素。随着需求的增加,企业正在扩大其产品范围,进行创新以满足消费者需求,并利用新兴趋势,从而进一步推动市场增长。
市场参与者密度是指在特定市场或行业内运营的企业或公司的分布情况。它表明在给定市场空间中,相对于其规模或总市场价值,有多少竞争对手(市场参与者)存在。
霍尔效应特斯拉计市场的主要公司有:
- PCE 仪器英国有限公司
- OMEGA 工程公司
- 科利集团
- 森尼斯公司
- 赫斯特磁性仪器公司
- Dr. Brockhaus Messtechnik GmbH & Co. KG
免责声明:上面列出的公司没有按照任何特定顺序排列。
- 了解霍尔效应特斯拉计市场顶级关键参与者概况
霍尔效应特斯拉计市场新闻和最新发展
霍尔效应特斯拉计市场通过收集一手和二手研究后的定性和定量数据进行评估,其中包括重要的公司出版物、协会数据和数据库。以下列出了霍尔效应特斯拉计市场的一些发展情况:
- PCE Instruments 宣布在罗马尼亚启动新的生产工厂。PCE Instruments RO SRL 进一步加强了其全球影响力,并支持他们在全球范围内提供一流的测量解决方案。(来源:PCE Instruments,新闻稿,2022 年 12 月)
- Arcline Investment Management (Arcline) 宣布已完成从 Spectris plc (LSE: SXS) 收购 Omega Engineering Inc. (Omega)。Omega 是领先的传感、控制和监控技术供应商,并已加入 Arcline 投资组合公司 Dwyer 集团 (Dwyer)。(来源:Arcline Investment Management,新闻稿,2022 年 7 月)
霍尔效应特斯拉计市场报告覆盖范围和交付成果
“霍尔效应特斯拉计市场规模和预测(2021-2031)”对市场进行了详细的分析,涵盖了以下领域:
- 霍尔效应特斯拉计市场规模及全球、区域和国家层面所有关键细分市场的预测
- 霍尔效应特斯拉计市场趋势,以及驱动因素、限制因素和关键机遇等市场动态
- 详细的 PEST 和 SWOT 分析
- 霍尔效应特斯拉计市场分析涵盖关键市场趋势、全球和区域框架、主要参与者、法规和最新市场发展
- 行业格局和竞争分析,涵盖市场集中度、热图分析、知名参与者以及霍尔效应特斯拉计市场的最新发展
- 详细的公司简介
- 历史分析(2 年)、基准年、预测(7 年)及复合年增长率
- PEST 和 SWOT 分析
- 市场规模价值/数量 - 全球、区域、国家
- 行业和竞争格局
- Excel 数据集

Report Coverage
Revenue forecast, Company Analysis, Industry landscape, Growth factors, and Trends

Segment Covered
This text is related
to segments covered.

Regional Scope
North America, Europe, Asia Pacific, Middle East & Africa, South & Central America

Country Scope
This text is related
to country scope.
常见问题
The incremental growth expected to be recorded for the hall effect teslameter market during the forecast period is US$ 144.10 million.
The hall effect teslameter market is expected to reach US$ 352.09 billion by 2031.
The key players holding majority shares in the hall effect teslameter market OMEGA Engineering inc.; Kanetec; TUNKIA Co., Ltd.; Brockhaus; and Hirst Magnetic Instruments.
Growing adoption of industrial automation is anticipated to play a significant role in the hall effect teslameter market in the coming years.
Increasing demand for electric vehicles and rising demand in scientific research are the major factors that propel the hall effect teslameter market.
The hall effect teslameter market was estimated to be US$ 207.98 million in 2023 and is expected to grow at a CAGR of 6.8 % during the forecast period 2023 – 2031.
Trends and growth analysis reports related to Electronics and Semiconductor : READ MORE..
The List of Companies- Hall Effect Teslameter Market
- PCE Instruments UK Ltd
- OMEGA Engineering, Inc.
- Coliy Group
- Senis AG
- Hirst Magnetic Instruments
- Dr. Brockhaus Messtechnik GmbH & Co. KG
- Calamit S.r.l
- Maurer Magnetic AG
- Magnaflux
- Lake Shore Cryotronics, Inc.
- AlphaLab, Inc.
- TUNKIA Co., Ltd.
- XIAMEN DEXING MAGNET TECH. CO., LTD.
- Magnetic Instrumentation
- MAGNET-PHYSIK Dr. Steingroever GmbH
The Insight Partners performs research in 4 major stages: Data Collection & Secondary Research, Primary Research, Data Analysis and Data Triangulation & Final Review.
- Data Collection and Secondary Research:
As a market research and consulting firm operating from a decade, we have published and advised several client across the globe. First step for any study will start with an assessment of currently available data and insights from existing reports. Further, historical and current market information is collected from Investor Presentations, Annual Reports, SEC Filings, etc., and other information related to company’s performance and market positioning are gathered from Paid Databases (Factiva, Hoovers, and Reuters) and various other publications available in public domain.
Several associations trade associates, technical forums, institutes, societies and organization are accessed to gain technical as well as market related insights through their publications such as research papers, blogs and press releases related to the studies are referred to get cues about the market. Further, white papers, journals, magazines, and other news articles published in last 3 years are scrutinized and analyzed to understand the current market trends.
- Primary Research:
The primarily interview analysis comprise of data obtained from industry participants interview and answers to survey questions gathered by in-house primary team.
For primary research, interviews are conducted with industry experts/CEOs/Marketing Managers/VPs/Subject Matter Experts from both demand and supply side to get a 360-degree view of the market. The primary team conducts several interviews based on the complexity of the markets to understand the various market trends and dynamics which makes research more credible and precise.
A typical research interview fulfils the following functions:
- Provides first-hand information on the market size, market trends, growth trends, competitive landscape, and outlook
- Validates and strengthens in-house secondary research findings
- Develops the analysis team’s expertise and market understanding
Primary research involves email interactions and telephone interviews for each market, category, segment, and sub-segment across geographies. The participants who typically take part in such a process include, but are not limited to:
- Industry participants: VPs, business development managers, market intelligence managers and national sales managers
- Outside experts: Valuation experts, research analysts and key opinion leaders specializing in the electronics and semiconductor industry.
Below is the breakup of our primary respondents by company, designation, and region:

Once we receive the confirmation from primary research sources or primary respondents, we finalize the base year market estimation and forecast the data as per the macroeconomic and microeconomic factors assessed during data collection.
- Data Analysis:
Once data is validated through both secondary as well as primary respondents, we finalize the market estimations by hypothesis formulation and factor analysis at regional and country level.
- Macro-Economic Factor Analysis:
We analyse macroeconomic indicators such the gross domestic product (GDP), increase in the demand for goods and services across industries, technological advancement, regional economic growth, governmental policies, the influence of COVID-19, PEST analysis, and other aspects. This analysis aids in setting benchmarks for various nations/regions and approximating market splits. Additionally, the general trend of the aforementioned components aid in determining the market's development possibilities.
- Country Level Data:
Various factors that are especially aligned to the country are taken into account to determine the market size for a certain area and country, including the presence of vendors, such as headquarters and offices, the country's GDP, demand patterns, and industry growth. To comprehend the market dynamics for the nation, a number of growth variables, inhibitors, application areas, and current market trends are researched. The aforementioned elements aid in determining the country's overall market's growth potential.
- Company Profile:
The “Table of Contents” is formulated by listing and analyzing more than 25 - 30 companies operating in the market ecosystem across geographies. However, we profile only 10 companies as a standard practice in our syndicate reports. These 10 companies comprise leading, emerging, and regional players. Nonetheless, our analysis is not restricted to the 10 listed companies, we also analyze other companies present in the market to develop a holistic view and understand the prevailing trends. The “Company Profiles” section in the report covers key facts, business description, products & services, financial information, SWOT analysis, and key developments. The financial information presented is extracted from the annual reports and official documents of the publicly listed companies. Upon collecting the information for the sections of respective companies, we verify them via various primary sources and then compile the data in respective company profiles. The company level information helps us in deriving the base number as well as in forecasting the market size.
- Developing Base Number:
Aggregation of sales statistics (2020-2022) and macro-economic factor, and other secondary and primary research insights are utilized to arrive at base number and related market shares for 2022. The data gaps are identified in this step and relevant market data is analyzed, collected from paid primary interviews or databases. On finalizing the base year market size, forecasts are developed on the basis of macro-economic, industry and market growth factors and company level analysis.
- Data Triangulation and Final Review:
The market findings and base year market size calculations are validated from supply as well as demand side. Demand side validations are based on macro-economic factor analysis and benchmarks for respective regions and countries. In case of supply side validations, revenues of major companies are estimated (in case not available) based on industry benchmark, approximate number of employees, product portfolio, and primary interviews revenues are gathered. Further revenue from target product/service segment is assessed to avoid overshooting of market statistics. In case of heavy deviations between supply and demand side values, all thes steps are repeated to achieve synchronization.
We follow an iterative model, wherein we share our research findings with Subject Matter Experts (SME’s) and Key Opinion Leaders (KOLs) until consensus view of the market is not formulated – this model negates any drastic deviation in the opinions of experts. Only validated and universally acceptable research findings are quoted in our reports.
We have important check points that we use to validate our research findings – which we call – data triangulation, where we validate the information, we generate from secondary sources with primary interviews and then we re-validate with our internal data bases and Subject matter experts. This comprehensive model enables us to deliver high quality, reliable data in shortest possible time.
 获取此报告的免费样本