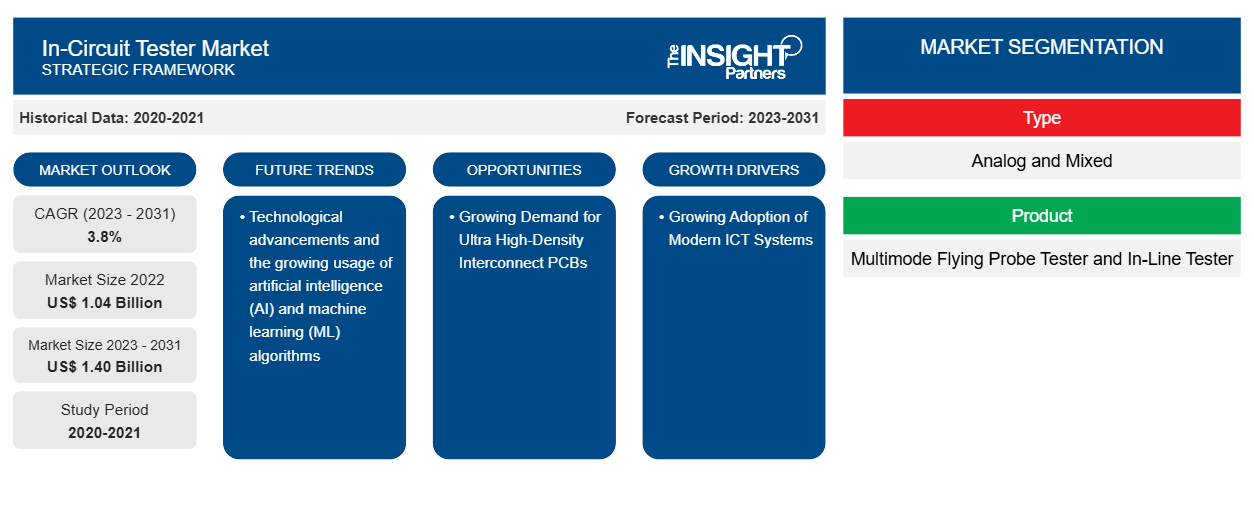
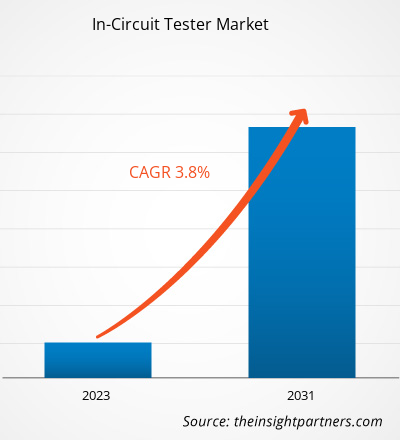
在线测试仪市场规模预计将从 2022 年的 10.4 亿美元增至 2030 年的 14 亿美元。预计 2022-2030 年期间市场复合年增长率将达到 3.8%。技术进步以及人工智能 (AI) 和机器学习 (ML) 算法的日益普及可能仍是市场的主要趋势。CAGR of 3.8% during 2022–2030. Technological advancements and the growing usage of artificial intelligence (AI) and machine learning (ML) algorithms are likely to remain key trends in the market.
在线测试仪市场分析
由于各种终端行业越来越多地使用测试仪来检测制造缺陷,以及数字在线测试的日益普及,在线测试市场正在快速增长。受汽车和消费电子行业不断扩张的推动,市场正在稳步扩张。此外,对超高密度互连 PCB 的需求不断增长,以及 5G 技术的出现为市场增长提供了丰厚的机会。PCBs, and the advent of 5G technology is providing lucrative opportunities for market growth.
在线测试仪市场概况
在线测试用于检测电子电路制造过程中的错误和缺陷。这种测试方法可用于检测多种缺陷,包括开路连接、错误或缺失的组件以及焊锡短路。在线测试的基本原理是评估 PCB 上特定位置的电气特性,以确保每个组件在更广泛的电路中正常运行。对 PCB 完整性的严格评估对于确保产品质量至关重要。该方法用于验证印刷电路板 (PCB) 和电路的完整性和功能性。PCB's integrity is critical in ensuring product quality. The method is used to verify the integrity and functionality of printed circuit boards (PCBs) and electrical circuits.
定制此报告以满足您的需求
您可以免费定制任何报告,包括本报告的部分内容、国家级分析、Excel 数据包,以及为初创企业和大学提供优惠和折扣
- 获取此报告的关键市场趋势。这个免费样品将包括数据分析,从市场趋势到估计和预测。
在线测试仪市场驱动因素和机遇
现代 ICT 系统日益普及,市场受益
ICT 使用先进技术来测试 PCB 上的各种组件。测试探针是精心制作的小型针脚,可与电路板上的测试点接触。这些探针连接到测试系统,该系统可以施加电压、测量电流和监控信号,以评估电阻器、电容器和集成电路的性能。
现代 ICT 系统包括先进的软件,可实现测试过程的精确控制和自动化。这可在多个电路板和制造过程中实现一致且可重复的结果。此外,现代计算机可以检查测试数据以发现手动检查过程中可能无法覆盖的微小缺陷。现代 ICT 系统可以根据单个 PCB 和产品线的特定需求进行定制。这种灵活性意味着测试方法适合每个组件的特定特性。ICT systems include sophisticated software that enables exact control and automation of the testing process. This enables consistent and repeatable results across several boards and manufacturing runs. Furthermore, modern computers can examine test data to uncover tiny flaws that may not covered in the manual inspection process. Modern ICT systems can be tailored to the specific needs of individual PCBs and product lines. This flexibility means that the testing method is suited to the specific characteristics of each assembly.
超高密度互连 PCB 需求不断增长PCBs
目前,电子行业正朝着微型化方向发展。元件变得越来越小,对它们所连接的 PCB 的设计提出了新的要求。这增加了对超高密度互连 PCB 的需求,用于生产更小、更轻的电子设备。此外,产品小型化趋势的不断增长增加了对超高密度互连 PCB 的需求,为市场创造了机会。在线测试仪对于通过减少紧凑空间中的误差来验证每个元件的功能至关重要。因此,制造微型电子产品的复杂性不断增加,对高密度互连 PCB 的需求激增,为预测期内的市场创造了增长机会。PCBs to which they are attached. This increases the demand for ultra-high-density interconnect PCBs for producing smaller and light-weight electronics devices. Moreover, the growing trend of product miniaturization increases the demand for ultra-high-density interconnect PCBs, creating opportunities in the market. In-circuit tester is highly essential to verify the function of each component by reducing the errors in compact spaces. Thus, the growing complexities of manufacturing miniaturized PCBs, creating growth opportunities for the market during the forecast period.
在线测试仪市场报告细分分析
有助于得出在线测试仪市场分析的关键部分是类型、产品、便携性和最终用途行业。
- 根据类型,在线测试仪市场分为模拟和混合。模拟部分在 2022 年占据了较大的市场份额。
- 按产品划分,市场分为多模飞针测试仪和在线测试仪。在线测试仪细分市场在 2022 年占据了较大的市场份额。multimode flying probe tester and in-line tester. The in-line tester segment is segment held a larger market share in 2022.
- 根据便携性,在线测试仪市场分为便携式和非便携式。非便携式部分在 2022 年占据了较大的市场份额。
- 就终端使用行业而言,市场细分为消费电子、汽车、医疗设备、航空航天和国防等。消费电子领域在 2022 年占据了更大的市场份额。defence, and others. The consumer electronics segment held a larger market share in 2022.
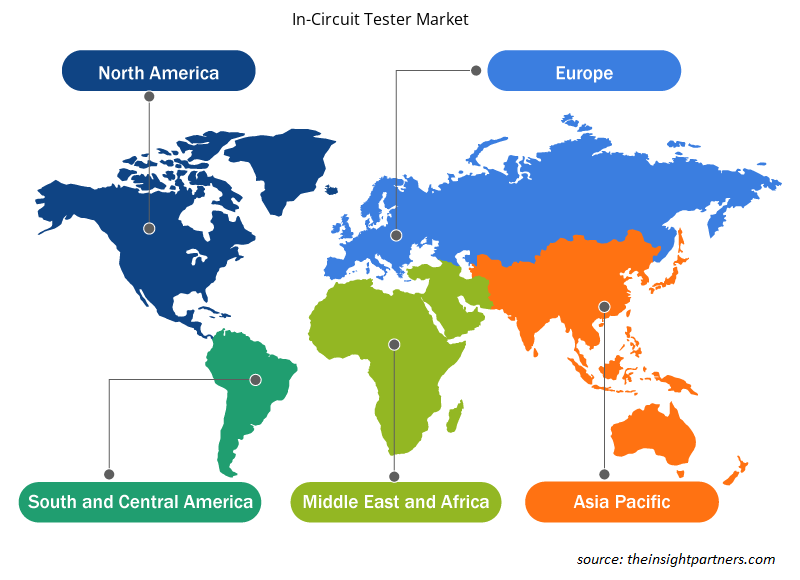
在线测试仪市场份额按地区分析
在线测试仪市场报告的地理范围主要分为五个区域:北美、亚太、欧洲、中东和非洲、南美和中美。
预计亚太地区将占据在线测试仪市场的最大市场份额。人口增长和城市化导致需要大规模基础设施建设,从而推动了该地区对电子产品的需求。根据印度电气和电子制造商协会 (IEEMA) 的数据,印度的发电能力预计将从 2010 年的 200 吉瓦增长到 2032 年的 800 吉瓦以上,以满足日益增长的电力需求。因此,未来 3-4 年需要在电力设备制造方面投入约 3000 亿美元的巨额资金,这将增加对这些设备的在线测试的需求。IEEMA), the electricity generation capacity in India is anticipated to grow from 200 GW in 2010 to over 800 GW by 2032 to execute the increasing demand for power. Thus, there is a need for a huge investment of ~US$ 300 billion in the next 3–4 years in power equipment manufacturing, which will increase the demand for in-circuit testing of these equipment.
在线测试仪市场区域洞察
Insight Partners 的分析师已详尽解释了预测期内影响在线测试仪市场的区域趋势和因素。本节还讨论了北美、欧洲、亚太地区、中东和非洲以及南美和中美洲的在线测试仪市场细分和地理位置。
- 获取在线测试仪市场的区域特定数据
在线测试仪市场报告范围
报告属性 | 细节 |
---|---|
2022 年市场规模 | 10.4亿美元 |
2030 年市场规模 | 14亿美元 |
全球复合年增长率(2023 - 2031) | 3.8% |
史料 | 2020-2021 |
预测期 | 2023-2031 |
涵盖的领域 | 按类型
|
覆盖地区和国家 | 北美
|
市场领导者和主要公司简介 |
|
在线测试仪市场参与者密度:了解其对业务动态的影响
在线测试仪市场正在快速增长,这得益于终端用户需求的不断增长,这些需求源于消费者偏好的不断变化、技术进步以及对产品优势的认识不断提高等因素。随着需求的增加,企业正在扩大其产品范围,进行创新以满足消费者的需求,并利用新兴趋势,从而进一步推动市场增长。
市场参与者密度是指在特定市场或行业内运营的企业或公司的分布情况。它表明在给定市场空间中,相对于其规模或总市场价值,有多少竞争对手(市场参与者)存在。
在线测试仪市场的主要运营公司有:
- 泰瑞达公司
- 数字测试有限公司
- inTEST 公司
- 日置电机株式会社
- 是德科技公司
- 康拉德有限公司
免责声明:上面列出的公司没有按照任何特定顺序排列。
- 获取在线测试仪市场顶级关键参与者概览
在线测试仪市场新闻和最新发展
在线测试仪市场通过收集一手和二手研究后的定性和定量数据进行评估,其中包括重要的公司出版物、协会数据和数据库。下面列出了在线测试仪市场的一些发展情况:
- Test Research, Inc. 推出了 TR5001E SII 系列,这是一款在线测试仪 (ICT) 系列,可为客户提供经济高效且可定制的解决方案。TR5001E SII 系列提供全面的测试功能,可通过降低成本来简化生产线。(来源:Test Research, Inc.,公司网站,2023 年 7 月)
- SPEA SpA 在 2023 年中国国际电子生产设备展览会 (Nepcon China 2023) 上展示了 3030IL 全自动针床测试仪。3030IL 测试仪用于在线测试,无需装载 PCB 或执行测试即可提供极高的吞吐量。(来源:SPEA SpA,公司网站,2023 年 7 月)
在线测试器市场报告覆盖范围和交付成果
“在线测试仪市场规模和预测(2020-2030)”报告对以下领域进行了详细的市场分析:
- 范围内所有关键细分市场的全球、区域和国家级在线测试仪市场规模和预测
- 在线测试仪市场趋势以及市场动态,如驱动因素、限制因素和关键机遇
- 详细的 PEST/波特五力分析和 SWOT 分析
- 在线测试仪市场分析涵盖主要市场趋势、全球和区域框架、主要参与者、法规和最新市场发展
- 行业格局和竞争分析,涵盖市场集中度、热图分析、知名参与者以及在线测试仪市场的最新发展
- 详细的公司简介
- Historical Analysis (2 Years), Base Year, Forecast (7 Years) with CAGR
- PEST and SWOT Analysis
- Market Size Value / Volume - Global, Regional, Country
- Industry and Competitive Landscape
- Excel Dataset
Report Coverage
Revenue forecast, Company Analysis, Industry landscape, Growth factors, and Trends
Segment Covered
This text is related
to segments covered.
Regional Scope
North America, Europe, Asia Pacific, Middle East & Africa, South & Central America
Country Scope
This text is related
to country scope.
Frequently Asked Questions
The report can be delivered in PDF/PPT format; we can also share excel dataset based on the request.
Some of the customization options available based on the request are additional 3–5 company profiles and country-specific analysis of 3–5 countries of your choice. Customizations are to be requested/discussed before making final order confirmation, as our team would review the same and check the feasibility.
The global in-circuit tester market is estimated to register a CAGR of 3.8% during the forecast period 2022–2030.
The rising adoption of in-circuit testers in automotive electronic testing is the major factors that propel the global in-circuit tester market.
The key players holding majority shares in the global in-circuit tester market are Teradyne Inc, Digitaltest GmbH, inTEST Corporation, HIOKI E.E. CORPORATION, Keysight Technologies Inc, Konrad GmbH, Kyoritsu Test System Co., Ltd., SEICA SPA, SPEA S.p.A., and Test Research, Inc.
Technological advancements and the growing usage of artificial intelligence (AI) and machine learning (ML) algorithms to play a significant role in the global in-circuit tester market in the coming years.
Trends and growth analysis reports related to Electronics and Semiconductor : READ MORE..
The List of Companies - In-Circuit Tester Market
- Teradyne Inc
- Digitaltest GmbH
- inTEST Corporation
- HIOKI E.E. CORPORATION
- Keysight Technologies Inc
- Konrad GmbH
- Kyoritsu Test System Co Ltd
- SEICA SPA
- SPEA S.p.A.
- Test Research, Inc.
The Insight Partners performs research in 4 major stages: Data Collection & Secondary Research, Primary Research, Data Analysis and Data Triangulation & Final Review.
- Data Collection and Secondary Research:
As a market research and consulting firm operating from a decade, we have published and advised several client across the globe. First step for any study will start with an assessment of currently available data and insights from existing reports. Further, historical and current market information is collected from Investor Presentations, Annual Reports, SEC Filings, etc., and other information related to company’s performance and market positioning are gathered from Paid Databases (Factiva, Hoovers, and Reuters) and various other publications available in public domain.
Several associations trade associates, technical forums, institutes, societies and organization are accessed to gain technical as well as market related insights through their publications such as research papers, blogs and press releases related to the studies are referred to get cues about the market. Further, white papers, journals, magazines, and other news articles published in last 3 years are scrutinized and analyzed to understand the current market trends.
- Primary Research:
The primarily interview analysis comprise of data obtained from industry participants interview and answers to survey questions gathered by in-house primary team.
For primary research, interviews are conducted with industry experts/CEOs/Marketing Managers/VPs/Subject Matter Experts from both demand and supply side to get a 360-degree view of the market. The primary team conducts several interviews based on the complexity of the markets to understand the various market trends and dynamics which makes research more credible and precise.
A typical research interview fulfils the following functions:
- Provides first-hand information on the market size, market trends, growth trends, competitive landscape, and outlook
- Validates and strengthens in-house secondary research findings
- Develops the analysis team’s expertise and market understanding
Primary research involves email interactions and telephone interviews for each market, category, segment, and sub-segment across geographies. The participants who typically take part in such a process include, but are not limited to:
- Industry participants: VPs, business development managers, market intelligence managers and national sales managers
- Outside experts: Valuation experts, research analysts and key opinion leaders specializing in the electronics and semiconductor industry.
Below is the breakup of our primary respondents by company, designation, and region:
Once we receive the confirmation from primary research sources or primary respondents, we finalize the base year market estimation and forecast the data as per the macroeconomic and microeconomic factors assessed during data collection.
- Data Analysis:
Once data is validated through both secondary as well as primary respondents, we finalize the market estimations by hypothesis formulation and factor analysis at regional and country level.
- Macro-Economic Factor Analysis:
We analyse macroeconomic indicators such the gross domestic product (GDP), increase in the demand for goods and services across industries, technological advancement, regional economic growth, governmental policies, the influence of COVID-19, PEST analysis, and other aspects. This analysis aids in setting benchmarks for various nations/regions and approximating market splits. Additionally, the general trend of the aforementioned components aid in determining the market's development possibilities.
- Country Level Data:
Various factors that are especially aligned to the country are taken into account to determine the market size for a certain area and country, including the presence of vendors, such as headquarters and offices, the country's GDP, demand patterns, and industry growth. To comprehend the market dynamics for the nation, a number of growth variables, inhibitors, application areas, and current market trends are researched. The aforementioned elements aid in determining the country's overall market's growth potential.
- Company Profile:
The “Table of Contents” is formulated by listing and analyzing more than 25 - 30 companies operating in the market ecosystem across geographies. However, we profile only 10 companies as a standard practice in our syndicate reports. These 10 companies comprise leading, emerging, and regional players. Nonetheless, our analysis is not restricted to the 10 listed companies, we also analyze other companies present in the market to develop a holistic view and understand the prevailing trends. The “Company Profiles” section in the report covers key facts, business description, products & services, financial information, SWOT analysis, and key developments. The financial information presented is extracted from the annual reports and official documents of the publicly listed companies. Upon collecting the information for the sections of respective companies, we verify them via various primary sources and then compile the data in respective company profiles. The company level information helps us in deriving the base number as well as in forecasting the market size.
- Developing Base Number:
Aggregation of sales statistics (2020-2022) and macro-economic factor, and other secondary and primary research insights are utilized to arrive at base number and related market shares for 2022. The data gaps are identified in this step and relevant market data is analyzed, collected from paid primary interviews or databases. On finalizing the base year market size, forecasts are developed on the basis of macro-economic, industry and market growth factors and company level analysis.
- Data Triangulation and Final Review:
The market findings and base year market size calculations are validated from supply as well as demand side. Demand side validations are based on macro-economic factor analysis and benchmarks for respective regions and countries. In case of supply side validations, revenues of major companies are estimated (in case not available) based on industry benchmark, approximate number of employees, product portfolio, and primary interviews revenues are gathered. Further revenue from target product/service segment is assessed to avoid overshooting of market statistics. In case of heavy deviations between supply and demand side values, all thes steps are repeated to achieve synchronization.
We follow an iterative model, wherein we share our research findings with Subject Matter Experts (SME’s) and Key Opinion Leaders (KOLs) until consensus view of the market is not formulated – this model negates any drastic deviation in the opinions of experts. Only validated and universally acceptable research findings are quoted in our reports.
We have important check points that we use to validate our research findings – which we call – data triangulation, where we validate the information, we generate from secondary sources with primary interviews and then we re-validate with our internal data bases and Subject matter experts. This comprehensive model enables us to deliver high quality, reliable data in shortest possible time.