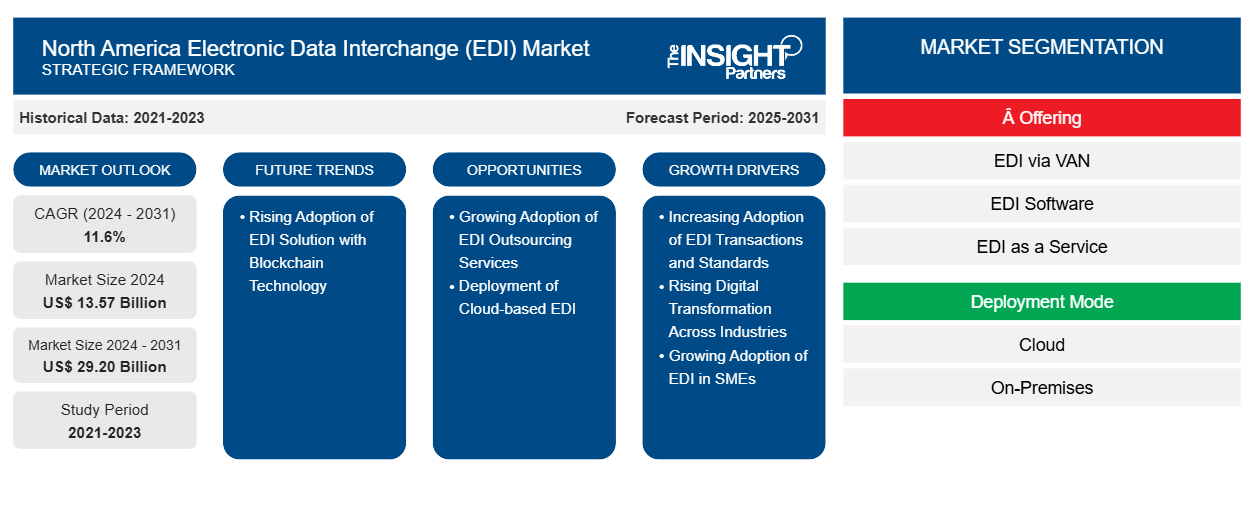
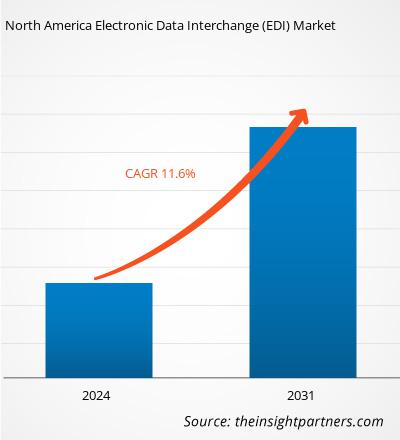
北美电子数据交换 (EDI) 市场规模预计将从 2024 年的 135.7 亿美元增至 2031 年的 292 亿美元。预计 2024 年至 2031 年期间该市场的复合年增长率将达到 11.6%。对人工智能驱动的个性化需求的不断增长可能会带来新的市场趋势。
北美电子数据交换(EDI)市场分析
EDI 解决方案需要持续维护,因为组织业务的整体工作流程依赖于它。许多组织认为 EDI 必须遵守众多合规性和标准。这阻碍了小型企业与大型组织合作部署更新版本的文档标准。这些组织直接与客户交换 EDI 文档,或使用第三方服务提供商。随着业务文档数字化以提高处理效率的趋势日益增长,多项合规性要求应运而生,这推动了全球范围内从纸质发票向电子发票的转变。
金融服务、保险和保险业(BFSI)、零售和制造业的数字化转型和EDI解决方案在数据交易领域的应用日益普及,加之EDI相关的合规性要求不断提高,以及政府为推动EDI解决方案采用而推出的优惠举措,这些都是推动北美EDI解决方案需求增长的关键因素。然而,高昂的实施成本以及耗时的解决方案部署阻碍了其市场的增长。尽管存在这些限制,但随着EDI交易和标准的日益普及以及各行各业数字化转型的不断推进,预计将在预测期内推动市场增长。
北美电子数据交换(EDI)市场概览
借助 EDI,组织与贸易伙伴之间交换的一些常见材料包括发票、采购订单、提前装运通知、海关、付款、库存、提单和运输状态文件。EDI 使组织能够规范供应链应用程序之间的数据交换。EDI 为组织提供帮助,并确保关键业务数据按时发送。EDI 通过邮件的自动准备和处理取代了传统的业务沟通。它帮助组织标准化通过业务文档交换的信息,从而实现无纸化交换。EDI 解决方案使组织能够提高整体工作流程的绩效。快速准确地处理 EDI 文档可以减少重复工作,并减少订单取消和缺货的情况。EDI are invoices, purchase orders, advance ship notices, customs, payment, inventory, bills of lading, and shipping status documents. EDI allows organizations to regulate the exchange of data between supply chain applications. EDI helps the organization and guarantees the business-critical data to be sent on time. The EDI replaced traditional business communication with mail preparation and handling automatically. It helps the organizations to standardize the information interchanged via business documents, which makes it a paperless exchange. The EDI solutions permit organizations to enhance the overall workflow performance. The fast and accurate processing of EDI documents leads to less repeated work, along with fewer canceled orders and stock-outs.
定制此报告以满足您的要求
您可以免费定制任何报告,包括本报告的部分内容、国家级分析、Excel 数据包,以及为初创企业和大学提供优惠和折扣
北美电子数据交换(EDI)市场:EDI) Market:
- 获取此报告的顶级关键市场趋势。此免费样品将包括数据分析,从市场趋势到估计和预测。
北美电子数据交换(EDI)市场驱动因素和机遇EDI) Market Drivers and Opportunities
各行各业数字化转型不断升温
企业正在持续投资数字技术,以通过降低成本提高运营效率来革新业务流程。云计算的日益普及是部署EDI技术和服务消费模式的重要因素之一。企业正专注于应用程序、数据、连接和云集成,包括EDI。例如,根据PublicFirst的调查,2022年,51%的企业表示他们目前使用某种形式的云服务(包括IaaS、PaaS和SaaS),21%的企业确认他们使用IaaS或PaaS作为其IT基础设施的替代或补充。尽管云计算呈指数级增长,但训练有素的IT专业人员仍然短缺。流程自动化和数字化转型可以为企业创造大量机会,创造更多价值并增加收入。发票开具是所有业务领域(包括B2B和B2C)中一项重要的功能,需要投入大量的成本、时间和人力。除了纸质发票外,每天都会生成大量的电子发票,从而降低企业的整体生产力成本。电子发票的日益普及,帮助企业节省了与发票生成和传输给最终客户相关的大量成本。通过电子发票实现发票流程自动化,为买家、供应商和管理人员带来诸多战略和运营效益。EDI 解决方案的优势包括降低成本、提高准确性、加快付款速度、改善现金管理、提高生产力、带来环境效益以及增强合规性。因此,蓬勃发展的数字化转型推动了北美 EDI 市场的发展。EDI technology and service consumption models. Organizations are focusing on applications, data, connections, and cloud integration, including EDI. For instance, as per the PublicFirst survey, in 2022, 51% of businesses stated that they currently use some form of cloud services (including IaaS, PaaS, and SaaS), and 21% confirmed that they use IaaS or PaaS as a replacement or complement for their IT infrastructure. Although cloud computing has grown exponentially, there is a shortage of well-trained IT professionals. Process automation and digital transformation can create numerous opportunities for businesses to create more value and increase revenue. Invoicing is a considerable function in all business segments, including B2B and B2C, which require a substantial cost, time, and workforce. Along with paper-based invoices, a large number of e-invoices are generated daily, thereby reducing the overall productivity cost of the business. The rising adoption of e-invoicing helps businesses save substantial costs associated with invoicing generation and transmission to end customers. Automating the invoicing process through e-invoicing offers several strategic and operational benefits to buyers, suppliers, and managers. A few advantages of EDI solutions are reduced costs, increased accuracy, faster payments, improved cash management, enhanced productivity, environmental benefits, and improved compliance. Thus, the rising digital transformation drives the North America EDI market.
企业正在逐步采用基于云的 EDI 解决方案。云 EDI 软件提供技术和业务流程改进设计。从精简的自动化到数据转换功能,云 EDI 工具可帮助您克服潜在的集成挑战,而无需部署和管理软件和硬件。此外,实施基于云的 EDI 的一些优势如下:
- 灵活性和可扩展性:基于云的 EDI 托管服务解决方案减少了构建一系列内部点解决方案的要求,并且其灵活性可以随着业务需求的波动而扩展。
- 降低成本:基于云的 EDI 解决方案利用云计算功能。它减少了升级和购买硬件的资本支出。
基于云的 EDI 提供商通过尖端技术提供服务,其正常运行时间约为 100%。此外,AWS 于 2024 年 1 月推出了 B2B 数据交换平台,该平台使企业能够自动化和监控基于云的 EDI 业务交易的转换。该服务提供低代码界面,用于管理贸易伙伴并将 EDI 文档转换为 JSON 和 XML 格式。因此,基于云的 EDI 部署的不断增长可以显著提高成本效率、可扩展性、安全性和运营效率,预计这将在预测期内为北美 EDI 市场创造巨大的机遇。
北美电子数据交换(EDI)市场报告细分分析
有助于得出北美电子数据交换 (EDI) 市场分析的关键部分是产品、部署模式和企业规模。
- 根据产品类型,北美电子数据交换 (EDI) 市场细分为通过 VAN 的 EDI、EDI 软件和 EDI 即服务。2024 年,通过 VAN 的 EDI 占据了市场主导地位。
- 根据部署模式,北美电子数据交换 (EDI) 市场分为云端部署和本地部署。2024 年,云端部署占据了市场主导地位。
- 就企业规模而言,北美电子数据交换 (EDI) 市场分为中小企业和大型企业。2024 年,大型企业占据了市场主导地位。
北美电子数据交换(EDI)市场份额(按地区)分析
- 医疗保健和金融服务业(BFSI)领域对云服务支出的不断增长,以及EDI技术的日益普及,推动了北美EDI市场的增长。由于外包活动(包括索赔处理和管理、收入周期管理和合作伙伴管理服务)的兴起,医疗保健领域对EDI服务的需求正在上升。该地区拥有发达的医疗保健基础设施、良好的监管环境和广泛的保险覆盖范围。此外,该地区对医疗保健供应链管理解决方案的需求也在增长,私营医疗保健市场参与者的数量也在不断增加,知名医疗保健IT公司也纷纷涌现。
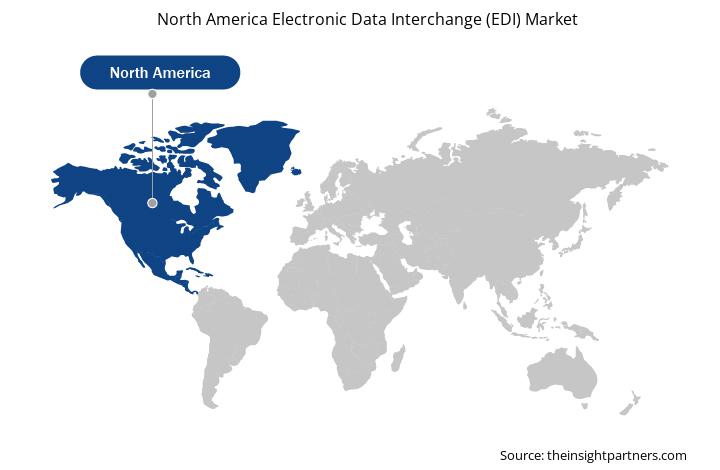
北美电子数据交换(EDI)市场区域洞察
Insight Partners 的分析师已详尽阐述了预测期内影响北美电子数据交换 (EDI) 市场的区域趋势和因素。本节还讨论了北美电子数据交换 (EDI) 市场的各个细分领域,涵盖北美、欧洲、亚太地区、中东和非洲以及南美和中美洲。
- 获取北美电子数据交换(EDI)市场的区域特定数据
北美电子数据交换(EDI)市场报告范围
| 报告属性 | 细节 |
|---|---|
| 2024年的市场规模 | 135.7亿美元 |
| 2031年的市场规模 | 292亿美元 |
| 全球复合年增长率(2024-2031) | 11.6% |
| 史料 | 2021-2023 |
| 预测期 | 2025-2031 |
| 涵盖的领域 | 通过“提供
|
| 覆盖地区和国家 | 北美
|
| 市场领导者和主要公司简介 |
|
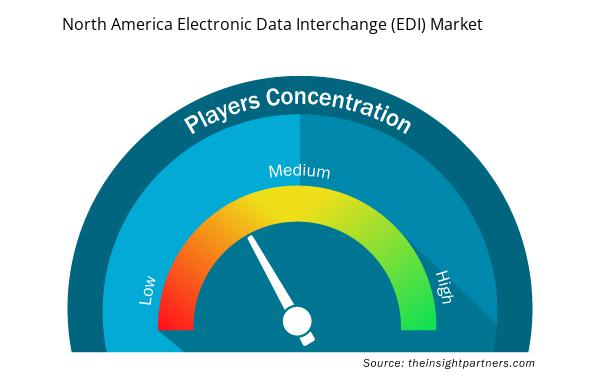
北美电子数据交换(EDI)市场参与者密度:了解其对业务动态的影响
北美电子数据交换 (EDI) 市场正在快速增长,这得益于终端用户需求的不断增长,而这些需求的驱动因素包括消费者偏好的演变、技术进步以及对产品优势的认知度的提升。随着需求的增长,企业正在扩展产品线,不断创新以满足消费者需求,并抓住新兴趋势,从而进一步推动市场增长。
市场参与者密度是指特定市场或行业内企业或公司的分布情况。它表明特定市场空间内竞争对手(市场参与者)的数量相对于其规模或总市值而言。
在北美电子数据交换(EDI)市场运营的主要公司有:
- 开放文本公司
- IBM 公司
- 康马奇公司
- 西门子股份公司
- 软件股份公司
- Epicor 软件公司
免责声明:以上列出的公司没有按照任何特定顺序排列。
- 获取北美电子数据交换(EDI)市场顶级关键参与者概览
北美电子数据交换(EDI)市场新闻及最新发展
北美电子数据交换 (EDI) 市场的评估是通过收集一手和二手资料后进行的定性和定量数据进行的,这些数据包括重要的公司出版物、协会数据和数据库。以下列出了北美电子数据交换 (EDI) 市场的一些发展情况:
(来源:OpenText Corp,新闻稿,2024 年 3 月)
- 海德堡材料公司是全球最大的综合建筑材料和解决方案制造商之一。该公司业务遍及50多个国家,因此决定采用Comarch EDI系统实现其发票流程的数字化。广泛的货物流通和大量的发票必须得到有效管理。Comarch已成为一家全方位服务的软件供应商,服务范围涵盖所有行业,包括电子发票,以及会计系统的国际联网。
(来源:Comarch SA,新闻稿,2024 年 2 月)
北美电子数据交换(EDI)市场报告覆盖范围和交付成果
“北美电子数据交换 (EDI) 市场规模和预测(2021-2031 年)”对以下领域进行了详细的市场分析:
- 北美电子数据交换 (EDI) 市场规模以及涵盖范围之内所有关键细分市场的全球、区域和国家层面的预测
- 北美电子数据交换 (EDI) 市场趋势以及市场动态,例如驱动因素、限制因素和关键机遇
- 详细的 PEST 和 SWOT 分析
- 北美电子数据交换 (EDI) 市场分析涵盖主要市场趋势、全球和区域框架、主要参与者、法规和最新市场发展
- 行业格局和竞争分析,涵盖市场集中度、热图分析、知名参与者以及北美电子数据交换 (EDI) 市场的最新发展
- 详细的公司简介
- 历史分析(2 年)、基准年、预测(7 年)及复合年增长率
- PEST 和 SWOT 分析
- 市场规模价值/数量 - 全球、区域、国家
- 行业和竞争格局
- Excel 数据集
- Vertical Farming Crops Market
- Collagen Peptides Market
- Pharmacovigilance and Drug Safety Software Market
- Transdermal Drug Delivery System Market
- Dropshipping Market
- Sleep Apnea Diagnostics Market
- Cling Films Market
- Educational Furniture Market
- Asset Integrity Management Market
- Arterial Blood Gas Kits Market

Report Coverage
Revenue forecast, Company Analysis, Industry landscape, Growth factors, and Trends

Segment Covered
This text is related
to segments covered.

Regional Scope
North America, Europe, Asia Pacific, Middle East & Africa, South & Central America

Country Scope
This text is related
to country scope.
常见问题
The North America electronic data interchange (EDI) market is expected to reach US$ 29.19 billion by 2031.
The EDI via VAN segment led the electronic data interchange (EDI) market with a significant share in 2024 and it is also expected to grow with the highest CAGR.
US is anticipated to grow with the highest CAGR over the forecast period.
The rising adoption of EDI solution with blockchain technology are the major future trends for the North America electronic data interchange (EDI) market.
The North America electronic data interchange (EDI) market was estimated to be USD 13.56 billion in 2024 and is expected to grow at a CAGR of 11.6 %, during the forecast period 2024 - 2031.
The increasing adoption of EDI transactions and standards and the rising digital transformation across industries are the factors driving the EDI market growth.
The key players, holding majority shares, in electronic data interchange (EDI) market includes SPS Commerce Inc, Truecommerce, Boomi Inc, Cleo, and Mulesoft LLC.
Trends and growth analysis reports related to Technology, Media and Telecommunications : READ MORE..
The List of Companies - North America Electronic Data Interchange (EDI) Market
- Open Text Corporation
- IBM Corporation
- Comarch SA
- Siemens AG
- Software AG
- Epicor Software Corporation
- Mulesoft
- Axway
- A3Logics, and
- A.P. Moller-Maeserk
The Insight Partners performs research in 4 major stages: Data Collection & Secondary Research, Primary Research, Data Analysis and Data Triangulation & Final Review.
- Data Collection and Secondary Research:
As a market research and consulting firm operating from a decade, we have published and advised several client across the globe. First step for any study will start with an assessment of currently available data and insights from existing reports. Further, historical and current market information is collected from Investor Presentations, Annual Reports, SEC Filings, etc., and other information related to company’s performance and market positioning are gathered from Paid Databases (Factiva, Hoovers, and Reuters) and various other publications available in public domain.
Several associations trade associates, technical forums, institutes, societies and organization are accessed to gain technical as well as market related insights through their publications such as research papers, blogs and press releases related to the studies are referred to get cues about the market. Further, white papers, journals, magazines, and other news articles published in last 3 years are scrutinized and analyzed to understand the current market trends.
- Primary Research:
The primarily interview analysis comprise of data obtained from industry participants interview and answers to survey questions gathered by in-house primary team.
For primary research, interviews are conducted with industry experts/CEOs/Marketing Managers/VPs/Subject Matter Experts from both demand and supply side to get a 360-degree view of the market. The primary team conducts several interviews based on the complexity of the markets to understand the various market trends and dynamics which makes research more credible and precise.
A typical research interview fulfils the following functions:
- Provides first-hand information on the market size, market trends, growth trends, competitive landscape, and outlook
- Validates and strengthens in-house secondary research findings
- Develops the analysis team’s expertise and market understanding
Primary research involves email interactions and telephone interviews for each market, category, segment, and sub-segment across geographies. The participants who typically take part in such a process include, but are not limited to:
- Industry participants: VPs, business development managers, market intelligence managers and national sales managers
- Outside experts: Valuation experts, research analysts and key opinion leaders specializing in the electronics and semiconductor industry.
Below is the breakup of our primary respondents by company, designation, and region:

Once we receive the confirmation from primary research sources or primary respondents, we finalize the base year market estimation and forecast the data as per the macroeconomic and microeconomic factors assessed during data collection.
- Data Analysis:
Once data is validated through both secondary as well as primary respondents, we finalize the market estimations by hypothesis formulation and factor analysis at regional and country level.
- Macro-Economic Factor Analysis:
We analyse macroeconomic indicators such the gross domestic product (GDP), increase in the demand for goods and services across industries, technological advancement, regional economic growth, governmental policies, the influence of COVID-19, PEST analysis, and other aspects. This analysis aids in setting benchmarks for various nations/regions and approximating market splits. Additionally, the general trend of the aforementioned components aid in determining the market's development possibilities.
- Country Level Data:
Various factors that are especially aligned to the country are taken into account to determine the market size for a certain area and country, including the presence of vendors, such as headquarters and offices, the country's GDP, demand patterns, and industry growth. To comprehend the market dynamics for the nation, a number of growth variables, inhibitors, application areas, and current market trends are researched. The aforementioned elements aid in determining the country's overall market's growth potential.
- Company Profile:
The “Table of Contents” is formulated by listing and analyzing more than 25 - 30 companies operating in the market ecosystem across geographies. However, we profile only 10 companies as a standard practice in our syndicate reports. These 10 companies comprise leading, emerging, and regional players. Nonetheless, our analysis is not restricted to the 10 listed companies, we also analyze other companies present in the market to develop a holistic view and understand the prevailing trends. The “Company Profiles” section in the report covers key facts, business description, products & services, financial information, SWOT analysis, and key developments. The financial information presented is extracted from the annual reports and official documents of the publicly listed companies. Upon collecting the information for the sections of respective companies, we verify them via various primary sources and then compile the data in respective company profiles. The company level information helps us in deriving the base number as well as in forecasting the market size.
- Developing Base Number:
Aggregation of sales statistics (2020-2022) and macro-economic factor, and other secondary and primary research insights are utilized to arrive at base number and related market shares for 2022. The data gaps are identified in this step and relevant market data is analyzed, collected from paid primary interviews or databases. On finalizing the base year market size, forecasts are developed on the basis of macro-economic, industry and market growth factors and company level analysis.
- Data Triangulation and Final Review:
The market findings and base year market size calculations are validated from supply as well as demand side. Demand side validations are based on macro-economic factor analysis and benchmarks for respective regions and countries. In case of supply side validations, revenues of major companies are estimated (in case not available) based on industry benchmark, approximate number of employees, product portfolio, and primary interviews revenues are gathered. Further revenue from target product/service segment is assessed to avoid overshooting of market statistics. In case of heavy deviations between supply and demand side values, all thes steps are repeated to achieve synchronization.
We follow an iterative model, wherein we share our research findings with Subject Matter Experts (SME’s) and Key Opinion Leaders (KOLs) until consensus view of the market is not formulated – this model negates any drastic deviation in the opinions of experts. Only validated and universally acceptable research findings are quoted in our reports.
We have important check points that we use to validate our research findings – which we call – data triangulation, where we validate the information, we generate from secondary sources with primary interviews and then we re-validate with our internal data bases and Subject matter experts. This comprehensive model enables us to deliver high quality, reliable data in shortest possible time.
 获取此报告的免费样本