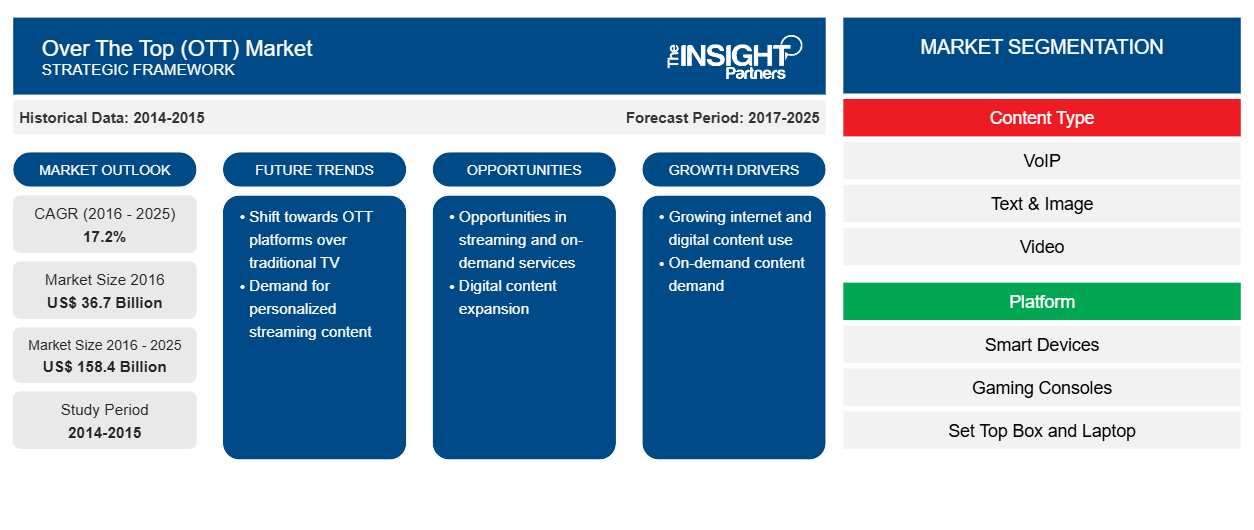
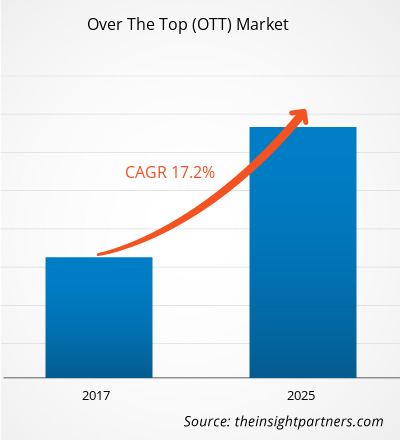
2016 年全球 Over The Top (OTT) 市场规模为 367 亿美元,预计 2017-2025 年期间的复合年增长率为 17.16%,到 2025 年将达到 1584 亿美元。
我们已经进入了一个工作时间和生活压力比以往任何时候都要大的时代。人们发现自己无法为自己烹饪像样的健康餐,而是更喜欢快餐。一切都变得忙碌起来,以适应现代生活的快节奏。在高压力的生活中,人们放松身心、为自己找时间放松身心变得极为重要。大多数人承认,当想从这种忙碌的生活方式中稍作休息时,他们会倾向于看电影和电视剧。但有时,几乎不可能找到时间在节目播出的确切时间一口气看完你最喜欢的节目。人们希望根据自己的时间和舒适度定制这种体验。Over the top 或 Over The Top (OTT) 是一个根据您的时间和需求通过互联网在您的智能手机或智能电视上提供电视或电影内容的平台。所有这些优势使得Over The Top (OTT) 市场成为一种诱人的产品,尤其是成本最低,也激发了市场的巨大投资。
未来趋势
任何具有增长潜力和丰厚回报的市场都会吸引众多供应商和投资者。发达国家和发展中国家的 Over The Top (OTT) 市场最近一直蓬勃发展。预计未来几年北美和西欧市场的收入将同比增长。亚马逊和 Netflix 等 Over The Top (OTT) 先驱的原创内容已在娱乐行业占据一席之地。所有权比授权有许多优势,例如节省成本。然而,如果它没有获得足够的吸引力,就会有风险,导致无法弥补的损失。
许多 Over The Top (OTT) 市场参与者正在考虑的下一个重大举措是整合直播内容。这将把 OTT 内容与付费电视内容区分开来。例如,亚马逊在 2014 年投资了名为 Twitch 的直播服务。甚至雅虎也制作了在线直播美式足球比赛。从目前的趋势来看,再加上潜在的未来计划,Over The Top (OTT) 市场前景光明。
定制此报告以满足您的需求
您可以免费定制任何报告,包括本报告的部分内容、国家级分析、Excel 数据包,以及为初创企业和大学提供优惠和折扣
互联网电视 (OTT) 市场:
- 获取此报告的关键市场趋势。这个免费样品将包括数据分析,从市场趋势到估计和预测。
驱动程序
智能手机使用量的不断增长导致 OTT 使用量增加
电信业的发展受制于科技界的变化。与传统电视相比,OTT 的受欢迎程度是最新的技术进步,而该行业近年来迅速增长的原因有很多。由于智能手机拥有众多应用,其销量不可避免地出现了激增。12 岁以下的学生拥有智能手机并不罕见,尤其是因为出现了许多帮助学习课程的应用。使用手机非常方便,因为您可以在任何地方、在旅途中使用它,甚至可以使用耳机确保不会打扰任何人。智能手机的日益普及及其易用性不可避免地将观众的注意力转移到使用 OTT,而不是在传统有线电视上观看他们喜爱的节目。除了不方便的观看体验之外,有线电视提供商还提供价格低廉的套餐,选项有限,例如没有播放选项。这些设施似乎是一种奢侈,因此大多数人都愿意投资 OTT
云服务介绍
云是震撼技术世界的另一项进步。云部署背后的想法是将数据或内容存储在连接到互联网的服务器上。这会在互联网上传播,因此可以从任何地方访问。基于云的存储改变了数据存储的面貌,如今许多云服务(例如 Microsoft、Dropbox、Apple、Amazon 和 Google)都已推出。
该服务具有出色的便携性,可从任何地方轻松访问中央云位置,让用户可以轻松上传任何数据、图片、视频和其他媒体。再加上 OTT 平台的优势,为 Over The Top (OTT) 市场带来了蓬勃发展的机会。
限制
监管和语言碎片化
OTT 最初由 WhatsApp 和 Skype 等通讯服务推动,后来逐渐扩展到 HBO、YouTube 和 Netflix 等媒体提供商。然而,它们受到监管问题的限制。政府机构必须审查由于过去几年 OTT 的快速增长而引发的安全问题。由于语言变化剧烈,从一个国家转移到另一个国家时,这种问题更加严重。监管问题加上语言分化,阻碍了风险投资的发展。
市场细分
按内容类型
OTT 平台的日益普及推动了该领域的增长
根据内容类型,全球 Over The Top (OTT) 市场分为IP 语音 (VoIP)、文本和图像以及视频。2016 年,视频部分占据市场主导地位,收入份额最大,预计在预测期内复合年增长率最高。
OTT 服务也被称为增值服务。它们随时随地提供下一代电视体验。Netflix 和 Hulu 等提供商是这一领域的领军企业。OTT 是过去几年的一大趋势,其采用率不断上升,尤其是在发展中国家。
按平台
便捷的交通促进了细分市场的增长
全球 Over The Top (OTT) 市场按平台划分为智能设备、游戏机、机顶盒、笔记本电脑、平板电脑和台式机。统计数据显示,智能设备在 2016 年以 66.91% 的市场份额领先市场,预计在 2025 年将继续占据主导地位。
智能设备类别主要包括智能电视、智能手机和其他联网设备。智能手机提供了下载任何应用程序的可能性,让您只需动动手指即可获得影院级的体验。大多数设备都无法做到这一点,尤其是当我们想使用不同的平台时,还具有其他功能,例如屏幕投影或暂停和播放功能。
区域洞察
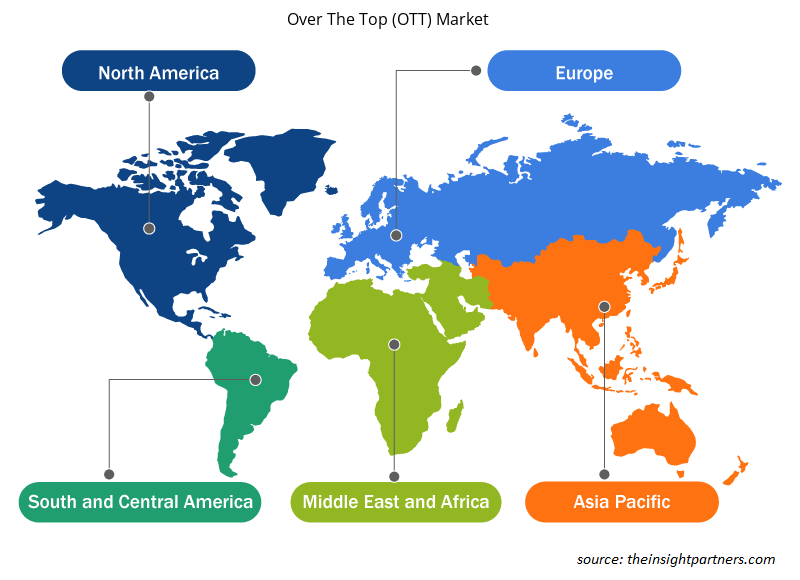
从地理上看,全球 Over The Top (OTT) 市场包括北美、欧洲、亚太地区 (APAC)、中东和非洲 (MEA) 以及南美和中美 (SCAM)。
北美和欧洲占据了整个市场的一半以上。
北美市场包括美国、加拿大和墨西哥。该地区对 OTT 服务的需求不断增长,尤其是在美国。美国行业参与者预计 Over The Top (OTT) 市场将持续增长一段时间,这得益于大量投资、激烈的竞争以及创新服务的推出,包括利基或专用产品。OTT 服务的主要要求(例如连接设备、宽带和支付系统)已经到位,以跟上预期的快速发展。
亚太地区是全球最具潜力的市场。由于该地区有两个最大的发展中国家(印度和中国),大多数市场都表现出显著的增长。OTT 市场也是如此。由于技术和互联网在该地区近 40% 的地区普及,主要经济体对此类平台的需求巨大。这推动了该地区的 Over The Top (OTT) 市场。此外,该地区语言多样性高,人口占世界总人口的 60%。这增加了对不同语言内容的需求,扩大了市场范围。
主要市场参与者
- Akamai Technologies, Inc.(美国)
- Amazon.com, Inc.(美国)
- Apple 公司(美国)
- CBS Corporation, Inc.(美国)
- Facebook, Inc.(美国)
- 谷歌公司(美国)
- HBO NOW(美国)
- Hulu LLC(美国)
- Netflix, Inc.(美国)
- Roku, Inc.(美国)
互联网电视 (OTT) 市场报告范围
互联网 (OTT) 市场区域洞察
Insight Partners 的分析师已详细解释了预测期内影响 Over The Top (OTT) 市场的区域趋势和因素。本节还讨论了北美、欧洲、亚太地区、中东和非洲以及南美和中美洲的 Over The Top (OTT) 市场细分和地理位置。
- 获取 Over The Top (OTT) 市场的区域特定数据
互联网电视 (OTT) 市场报告范围
| 报告属性 | 细节 |
|---|---|
| 2016年市场规模 | 367亿美元 |
| 2025 年市场规模 | 1584亿美元 |
| 全球复合年增长率(2016 - 2025) | 17.2% |
| 史料 | 2014-2015 |
| 预测期 | 2017-2025 |
| 涵盖的领域 | 按内容类型
|
| 覆盖地区和国家 | 北美
|
| 市场领导者和主要公司简介 |
|
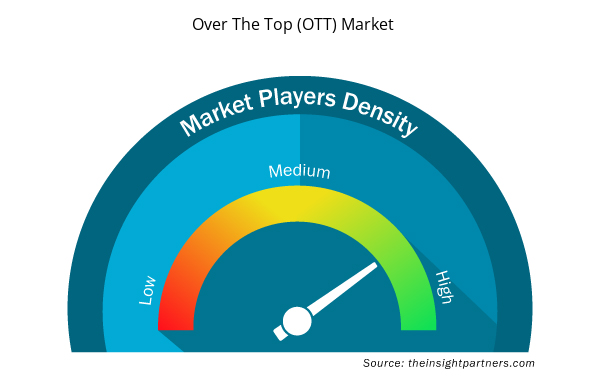
市场参与者密度:了解其对商业动态的影响
由于消费者偏好的不断变化、技术进步以及对产品优势的认识不断提高等因素,终端用户需求不断增加,推动了 Over The Top (OTT) 市场快速增长。随着需求的增加,企业正在扩大其产品范围,进行创新以满足消费者需求,并利用新兴趋势,从而进一步推动市场增长。
市场参与者密度是指在特定市场或行业内运营的企业或公司的分布情况。它表明在给定市场空间中,相对于其规模或总市场价值,有多少竞争对手(市场参与者)存在。
在 Over The Top(OTT)市场运营的主要公司有:
- Akamai 技术公司
- 亚马逊公司(Amazon.com, Inc.)
- 苹果公司
- 哥伦比亚广播公司
- Facebook 公司
免责声明:上面列出的公司没有按照任何特定顺序排列。
- 获取 Over The Top (OTT) 市场顶级关键参与者概览
关键进展
- 2017 年 6 月:哥伦比亚广播公司 (CBS Corporation) 和辛克莱广播集团 (Sinclair Broadcast Group, Inc.) 宣布了一项多年期协议,续签其拥有或运营的四个电台的电台加盟协议。
- 2017 年 4 月:Amedia TV 和 CBS Studios International 宣布达成多平台许可协议,播放 CBS 和 SHOWTIME 制作的节目,包括 2017 年最受期待的电视首映之一的俄罗斯付费电视独家播放权。
- 2016 年 6 月:日立美国有限公司加入 Roku 电视授权计划。通过加入该计划,日立将利用该公司的低成本电视参考设计来生产运行 Roku OS 的优质智能电视
- 2016 年 9 月:Akamai Technologies, Inc. 收购了 Concord Systems,后者致力于提供大规模高性能数据处理技术。此次收购有望增强 Akamai 现有数据处理平台的功能。
报告范围
全球 Over The Top (OTT) 市场研究报告提供了有关再生医学和细胞培养的详细见解,涉及规模、份额、趋势和预测。它提供了有关驱动因素、限制因素、机会、细分市场和工业格局的清晰而精确的专业知识。全球和区域市场洞察提供了当前和未来的工业情景,以确定投资决策。一份关键市场参与者名单及其近年来各自的发展情况已被特别提及。
- 历史分析(2 年)、基准年、预测(7 年)及复合年增长率
- PEST 和 SWOT 分析
- 市场规模价值/数量 - 全球、区域、国家
- 行业和竞争格局
- Excel 数据集
- Redistribution Layer Material Market
- Machine Condition Monitoring Market
- Online Recruitment Market
- Radiopharmaceuticals Market
- Compounding Pharmacies Market
- Joint Pain Injection Market
- Environmental Consulting Service Market
- Electronic Shelf Label Market
- Architecture Software Market
- Occupational Health Market

Report Coverage
Revenue forecast, Company Analysis, Industry landscape, Growth factors, and Trends

Segment Covered
This text is related
to segments covered.

Regional Scope
North America, Europe, Asia Pacific, Middle East & Africa, South & Central America

Country Scope
This text is related
to country scope.
Trends and growth analysis reports related to Technology, Media and Telecommunications : READ MORE..
The List of Companies
1. Akamai Technologies, Inc.
2. Amazon.com, Inc.
3. Apple, Inc.
4. CBS Corporation, Inc
5. Facebook, Inc.
6. Google, Inc.
7. HBO NOW
8. Hulu L.L.C.
9. Netflix, Inc.
!0. Roku, Inc.
The Insight Partners performs research in 4 major stages: Data Collection & Secondary Research, Primary Research, Data Analysis and Data Triangulation & Final Review.
- Data Collection and Secondary Research:
As a market research and consulting firm operating from a decade, we have published and advised several client across the globe. First step for any study will start with an assessment of currently available data and insights from existing reports. Further, historical and current market information is collected from Investor Presentations, Annual Reports, SEC Filings, etc., and other information related to company’s performance and market positioning are gathered from Paid Databases (Factiva, Hoovers, and Reuters) and various other publications available in public domain.
Several associations trade associates, technical forums, institutes, societies and organization are accessed to gain technical as well as market related insights through their publications such as research papers, blogs and press releases related to the studies are referred to get cues about the market. Further, white papers, journals, magazines, and other news articles published in last 3 years are scrutinized and analyzed to understand the current market trends.
- Primary Research:
The primarily interview analysis comprise of data obtained from industry participants interview and answers to survey questions gathered by in-house primary team.
For primary research, interviews are conducted with industry experts/CEOs/Marketing Managers/VPs/Subject Matter Experts from both demand and supply side to get a 360-degree view of the market. The primary team conducts several interviews based on the complexity of the markets to understand the various market trends and dynamics which makes research more credible and precise.
A typical research interview fulfils the following functions:
- Provides first-hand information on the market size, market trends, growth trends, competitive landscape, and outlook
- Validates and strengthens in-house secondary research findings
- Develops the analysis team’s expertise and market understanding
Primary research involves email interactions and telephone interviews for each market, category, segment, and sub-segment across geographies. The participants who typically take part in such a process include, but are not limited to:
- Industry participants: VPs, business development managers, market intelligence managers and national sales managers
- Outside experts: Valuation experts, research analysts and key opinion leaders specializing in the electronics and semiconductor industry.
Below is the breakup of our primary respondents by company, designation, and region:

Once we receive the confirmation from primary research sources or primary respondents, we finalize the base year market estimation and forecast the data as per the macroeconomic and microeconomic factors assessed during data collection.
- Data Analysis:
Once data is validated through both secondary as well as primary respondents, we finalize the market estimations by hypothesis formulation and factor analysis at regional and country level.
- Macro-Economic Factor Analysis:
We analyse macroeconomic indicators such the gross domestic product (GDP), increase in the demand for goods and services across industries, technological advancement, regional economic growth, governmental policies, the influence of COVID-19, PEST analysis, and other aspects. This analysis aids in setting benchmarks for various nations/regions and approximating market splits. Additionally, the general trend of the aforementioned components aid in determining the market's development possibilities.
- Country Level Data:
Various factors that are especially aligned to the country are taken into account to determine the market size for a certain area and country, including the presence of vendors, such as headquarters and offices, the country's GDP, demand patterns, and industry growth. To comprehend the market dynamics for the nation, a number of growth variables, inhibitors, application areas, and current market trends are researched. The aforementioned elements aid in determining the country's overall market's growth potential.
- Company Profile:
The “Table of Contents” is formulated by listing and analyzing more than 25 - 30 companies operating in the market ecosystem across geographies. However, we profile only 10 companies as a standard practice in our syndicate reports. These 10 companies comprise leading, emerging, and regional players. Nonetheless, our analysis is not restricted to the 10 listed companies, we also analyze other companies present in the market to develop a holistic view and understand the prevailing trends. The “Company Profiles” section in the report covers key facts, business description, products & services, financial information, SWOT analysis, and key developments. The financial information presented is extracted from the annual reports and official documents of the publicly listed companies. Upon collecting the information for the sections of respective companies, we verify them via various primary sources and then compile the data in respective company profiles. The company level information helps us in deriving the base number as well as in forecasting the market size.
- Developing Base Number:
Aggregation of sales statistics (2020-2022) and macro-economic factor, and other secondary and primary research insights are utilized to arrive at base number and related market shares for 2022. The data gaps are identified in this step and relevant market data is analyzed, collected from paid primary interviews or databases. On finalizing the base year market size, forecasts are developed on the basis of macro-economic, industry and market growth factors and company level analysis.
- Data Triangulation and Final Review:
The market findings and base year market size calculations are validated from supply as well as demand side. Demand side validations are based on macro-economic factor analysis and benchmarks for respective regions and countries. In case of supply side validations, revenues of major companies are estimated (in case not available) based on industry benchmark, approximate number of employees, product portfolio, and primary interviews revenues are gathered. Further revenue from target product/service segment is assessed to avoid overshooting of market statistics. In case of heavy deviations between supply and demand side values, all thes steps are repeated to achieve synchronization.
We follow an iterative model, wherein we share our research findings with Subject Matter Experts (SME’s) and Key Opinion Leaders (KOLs) until consensus view of the market is not formulated – this model negates any drastic deviation in the opinions of experts. Only validated and universally acceptable research findings are quoted in our reports.
We have important check points that we use to validate our research findings – which we call – data triangulation, where we validate the information, we generate from secondary sources with primary interviews and then we re-validate with our internal data bases and Subject matter experts. This comprehensive model enables us to deliver high quality, reliable data in shortest possible time.
 获取此报告的免费样本