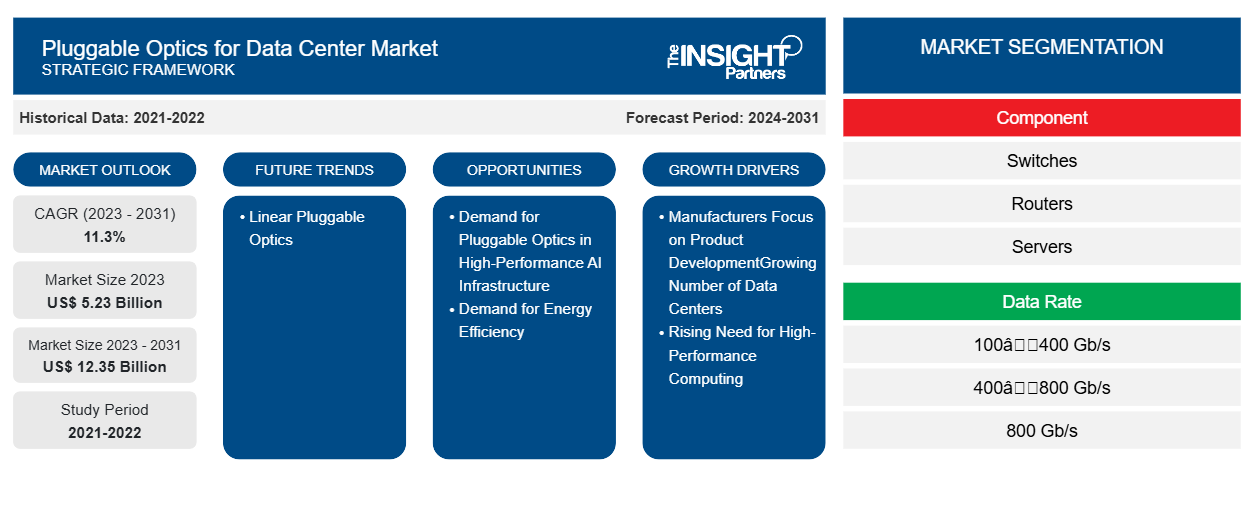
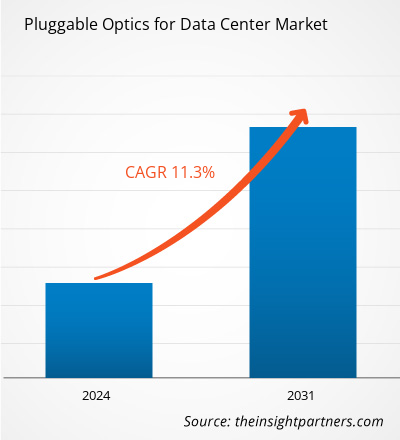
2023 年数据中心可插拔光学器件市场规模价值 52.3 亿美元,预计到 2031 年将达到 123.5 亿美元。预计 2023 年至 2031 年数据中心可插拔光学器件市场的复合年增长率为 11.3%。在预测期内,线性可插拔光学器件的扩张可能会成为市场趋势。
数据中心可插拔光学器件市场分析
物联网 (IoT) 的日益普及、对海量数据存储需求的不断增长以及数字化的不断发展,推动了对数据中心的需求。它是一种出色的数据存储解决方案,可为公司提供对大量数据的快速安全访问。集中式数据管理、可扩展性和安全性鼓励企业采用这些解决方案来实现数据驱动的业务格局。因此,一些公司正在投资在北美开发数据中心。根据年利达律师事务所的数据,北美在数据中心交易价值方面保持领先地位,占 2023 年全球总额的 62%,占 2024 年 4 月投资的 69%,总额达 150 亿美元,其中美国占总额的最大份额。
可插拔概述
可插拔光学器件是可互换的收发器模块,可连接各种网络组件,包括交换机、路由器和服务器,将高速电信号转换为光信号,反之亦然。可插拔光学器件最常用于数据中心光学器件,因为它们灵活、可扩展,并与各种网络设备和标准兼容。可插拔光学器件的一个优点是,用户可以根据数据速率和其他网络架构要求定制模块内的收发器,而其他光学互连使用光在计算架构内传输数据。由于可插拔光学器件具有成本效益、广泛兼容性以及降低功耗的能力等优势,数据中心对可插拔光学器件的需求正在增加。它们通常是一种高速、低功耗解决方案,并且与各种其他设备兼容。
定制此报告以满足您的需求
您可以免费定制任何报告,包括本报告的部分内容、国家级分析、Excel 数据包,以及为初创企业和大学提供优惠和折扣
数据中心市场的可插拔光学器件:
- 获取此报告的关键市场趋势。这个免费样品将包括数据分析,从市场趋势到估计和预测。
数据中心可插拔光学器件的市场驱动因素和机遇
注重产品开发以赢得市场
可插拔光学器件使数据中心运营商能够轻松升级或更换收发器,而无需完全重建电缆系统。数据中心对可插拔光学器件的需求不断增长,这促使制造商开发能够满足客户动态需求的创新产品。例如,2024 年 3 月,Infinera Corporation 推出了新的 ICE-D 系列,以改善数据中心内部连接。ICE-D 是基于单片磷化铟 (InP) 和光子集成电路 (PIC) 技术的新型高速数据中心内部光学器件系列。ICE-D 光学器件旨在显着降低每比特成本和功耗,同时提供 1.6 兆比特每秒 (Tb/s) 或更高速度的数据中心内部连接。这项技术使数据中心运营商能够满足不断增长的带宽需求,同时保持成本效益。
能源效率需求不断增长
绿色数据中心的出现是导致能源效率需求不断增长的另一个因素。绿色数据中心是可持续的数据中心,使用节能技术来减少能源消耗和环境影响。企业正在转向绿色数据中心,以降低数据中心成本并最大限度地减少碳影响。这可以通过使用节能设备和组件来实现,这可以产生对紧凑和高度集成的可插拔光学器件的需求,因为它们更节能。安装可插拔光学器件可以节省网络运营支出,例如冷却成本。因此,对节能解决方案的需求是导致可插拔光学器件部署的关键因素,可以为可插拔光学器件创造有利可图的机会,促进数据中心市场的增长。
数据中心可插拔光学器件市场报告细分分析
有助于得出用于数据中心市场分析的可插拔光学器件的关键部分是组件和数据速率。
- 就组件而言,市场分为交换机、路由器和服务器。交换机部分在 2023 年占据了市场主导地位。
- 根据数据速率,市场分为 100-400 Gb/s、400-800 Gb/s 和 800 Gb/s 及以上。400-800 Gb/s 细分市场在 2023 年占据市场主导地位。
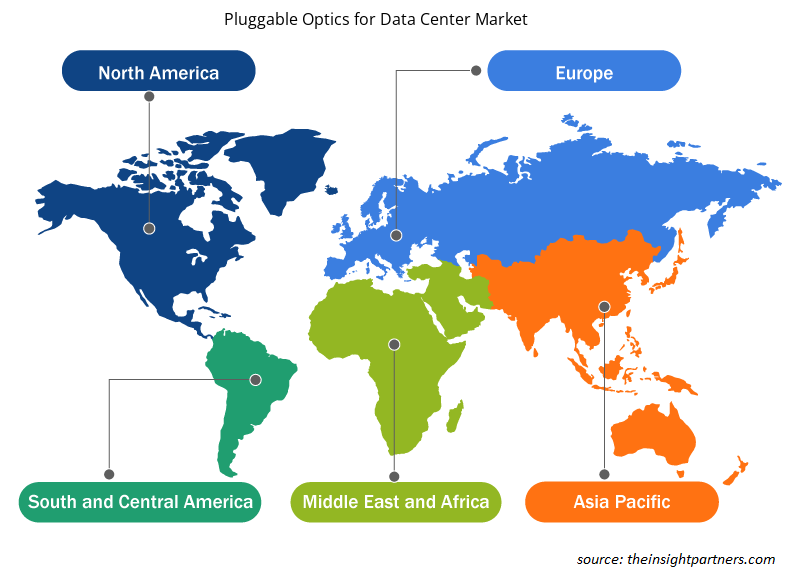
数据中心可插拔光学器件市场份额按地区分析
数据中心可插拔光学器件市场报告的地理范围主要分为五个区域:北美、欧洲、亚太地区(APAC)、中东和非洲(MEA)和南美(SAM)。
德国、法国、英国和意大利是推动欧洲数据中心可插拔光学器件市场增长的主要国家。数据总量呈指数级增长,导致欧洲数据中心行业需求强劲。人工智能 (AI)、机器学习 (ML) 和物联网 (IoT) 等快速发展的技术正在推动对可插拔光学器件的需求,预计未来三到五年内可插拔光学器件的需求将继续超过供应。例如,根据 TMT Consultants Ltd 于 2024 年 6 月发布的数据,欧洲数据中心对人工智能技术和数据存储容量的使用正在增长。
由于投资不断增长以及主机托管数据中心 IT 容量不断提高,预计未来几年德国数据中心可插拔光学器件市场将大幅扩张。根据德国数据中心协会发布的《德国 2024 年数据中心影响报告》,到 2029 年,德国数据中心预计将获得超过 265.8 亿美元(240 亿欧元)的投资,用于扩大主机托管容量。根据上述同一消息来源,到 2029 年,德国主机托管数据中心的 IT 容量预计将从 1.3 GW 扩大到 3.3 GW。数据中心容量不断扩大、数据处理需求增加以及开发数据中心的投资增加是推动市场发展的因素之一。
数据中心可插拔光学器件市场区域洞察
Insight Partners 的分析师已详细解释了预测期内影响数据中心可插拔光学器件市场的区域趋势和因素。本节还讨论了数据中心可插拔光学器件市场的各个细分市场和地理位置,包括北美、欧洲、亚太地区、中东和非洲以及南美和中美洲。
- 获取数据中心市场可插拔光学器件的区域特定数据
数据中心可插拔光学器件市场报告范围
| 报告属性 | 细节 |
|---|---|
| 2023 年的市场规模 | 52.3亿美元 |
| 2031 年市场规模 | 123.5亿美元 |
| 全球复合年增长率(2023 - 2031) | 11.3% |
| 史料 | 2021-2022 |
| 预测期 | 2024-2031 |
| 涵盖的领域 | 按组件
|
| 覆盖地区和国家 | 北美
|
| 市场领导者和主要公司简介 |
|
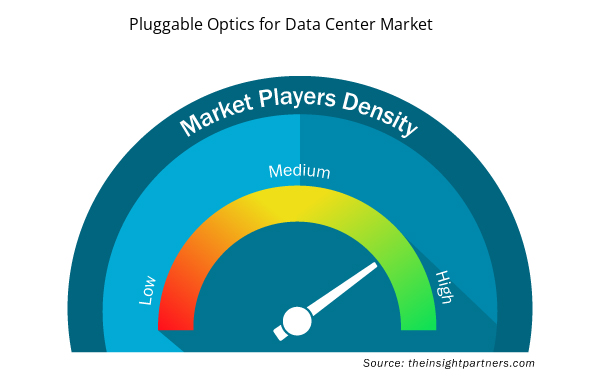
市场参与者密度:了解其对商业动态的影响
数据中心可插拔光学器件市场正在快速增长,这得益于终端用户需求的不断增长,这些需求源于消费者偏好的不断变化、技术进步以及对产品优势的认识不断提高等因素。随着需求的增加,企业正在扩大其产品范围,进行创新以满足消费者需求,并利用新兴趋势,从而进一步推动市场增长。
市场参与者密度是指在特定市场或行业内运营的企业或公司的分布情况。它表明在给定市场空间中,相对于其规模或总市场价值,有多少竞争对手(市场参与者)存在。
在数据中心可插拔光学器件市场运营的主要公司有:
- 相干公司
- 诺基亚公司
- 思科系统公司
- 英飞朗公司
- 爱立信电信
- Ciena公司
免责声明:上面列出的公司没有按照任何特定顺序排列。
- 获取数据中心可插拔光学器件市场顶级关键参与者概览
数据中心可插拔光学器件市场新闻和最新发展
通过收集一手和二手研究后的定性和定量数据来评估数据中心可插拔光学器件市场,其中包括重要的公司出版物、协会数据和数据库。以下列出了数据中心可插拔光学器件市场的一些发展情况:
- 诺基亚公司宣布推出一套全面的全新光传输解决方案,针对 CSP、网络规模和企业客户的城域边缘部署进行了优化。该公司的产品组合新增了 100 Gb/s、400 Gb/s 和 800 Gb/s 可插拔相干模块、新的紧凑型光传输平台以及针对城域边缘应用进行了优化的新卡。(来源:诺基亚公司,新闻稿,2024 年 3 月)
- Infinera 宣布扩大与日本网络基础设施解决方案提供商 APRESIA Systems, Ltd. (APRESIA) 的合作伙伴关系,将 Infinera 的软件可编程 ICE-X 相干可插拔产品集成到 APRESIA 的本地制造的第 2/3 层交换和光传输产品组合中。Infinera 的 ICE-X 相干可插拔产品使 APRESIA 能够增强其接入网络解决方案,并为其客户提供更高的运营价值,包括新的创收服务、降低资本支出和运营支出以及最大限度地利用光纤资产。(来源:Infinera,新闻稿,2024 年 7 月)
数据中心可插拔光学器件市场报告覆盖范围和交付成果
“数据中心可插拔光学器件市场规模和预测(2021-2031 年)”报告对市场进行了详细分析,涵盖以下领域:
- 数据中心可插拔光学器件市场规模以及范围内涵盖的所有关键细分市场的全球、区域和国家/地区预测
- 数据中心可插拔光学器件的市场趋势以及市场动态,例如驱动因素、限制因素和关键机遇
- 详细的 PEST/波特五力分析和 SWOT 分析
- 数据中心可插拔光学器件市场分析,涵盖关键市场趋势、全球和区域框架、主要参与者、法规和最新市场发展
- 行业格局和竞争分析,涵盖市场集中度、热图分析、知名参与者以及数据中心可插拔光学器件市场的最新发展
- 详细的公司简介
- 历史分析(2 年)、基准年、预测(7 年)及复合年增长率
- PEST 和 SWOT 分析
- 市场规模价值/数量 - 全球、区域、国家
- 行业和竞争格局
- Excel 数据集

Report Coverage
Revenue forecast, Company Analysis, Industry landscape, Growth factors, and Trends

Segment Covered
This text is related
to segments covered.

Regional Scope
North America, Europe, Asia Pacific, Middle East & Africa, South & Central America

Country Scope
This text is related
to country scope.
常见问题
The market is expected to grow at a CAGR of 11.3% during the forecast period.
The estimated value of the pluggable optics for data center market is expected to reach US$ 12.35 billion by 2031.
Coherent Corp, Nokia Corp, Cisco Systems Inc, Infinera Corp, and Telefonaktiebolaget LM Ericsson are among the leading players in the pluggable optics for data center market.
The expansion of linear pluggable optics is likely to trend in the market during the forecast period.
The manufacturers’ focus on product development, growing number of data centers globally, and rising need for high-performance computing are factors anticipated to fuel the pluggable optics for data center market.
North America dominated the pluggable optics for data center market in 2023.
Trends and growth analysis reports related to Electronics and Semiconductor : READ MORE..
The List of companies - Pluggable Optics for data center market
- Coherent Corp
- Nokia Corp
- Cisco Systems Inc
- Infinera Corp
- Telefonaktiebolaget LM Ericsson
- Ciena Corp
- Intel Corp
- Lumentum Holdings Inc.
- Juniper Networks Inc
- Marvell Technology Inc
The Insight Partners performs research in 4 major stages: Data Collection & Secondary Research, Primary Research, Data Analysis and Data Triangulation & Final Review.
- Data Collection and Secondary Research:
As a market research and consulting firm operating from a decade, we have published and advised several client across the globe. First step for any study will start with an assessment of currently available data and insights from existing reports. Further, historical and current market information is collected from Investor Presentations, Annual Reports, SEC Filings, etc., and other information related to company’s performance and market positioning are gathered from Paid Databases (Factiva, Hoovers, and Reuters) and various other publications available in public domain.
Several associations trade associates, technical forums, institutes, societies and organization are accessed to gain technical as well as market related insights through their publications such as research papers, blogs and press releases related to the studies are referred to get cues about the market. Further, white papers, journals, magazines, and other news articles published in last 3 years are scrutinized and analyzed to understand the current market trends.
- Primary Research:
The primarily interview analysis comprise of data obtained from industry participants interview and answers to survey questions gathered by in-house primary team.
For primary research, interviews are conducted with industry experts/CEOs/Marketing Managers/VPs/Subject Matter Experts from both demand and supply side to get a 360-degree view of the market. The primary team conducts several interviews based on the complexity of the markets to understand the various market trends and dynamics which makes research more credible and precise.
A typical research interview fulfils the following functions:
- Provides first-hand information on the market size, market trends, growth trends, competitive landscape, and outlook
- Validates and strengthens in-house secondary research findings
- Develops the analysis team’s expertise and market understanding
Primary research involves email interactions and telephone interviews for each market, category, segment, and sub-segment across geographies. The participants who typically take part in such a process include, but are not limited to:
- Industry participants: VPs, business development managers, market intelligence managers and national sales managers
- Outside experts: Valuation experts, research analysts and key opinion leaders specializing in the electronics and semiconductor industry.
Below is the breakup of our primary respondents by company, designation, and region:

Once we receive the confirmation from primary research sources or primary respondents, we finalize the base year market estimation and forecast the data as per the macroeconomic and microeconomic factors assessed during data collection.
- Data Analysis:
Once data is validated through both secondary as well as primary respondents, we finalize the market estimations by hypothesis formulation and factor analysis at regional and country level.
- Macro-Economic Factor Analysis:
We analyse macroeconomic indicators such the gross domestic product (GDP), increase in the demand for goods and services across industries, technological advancement, regional economic growth, governmental policies, the influence of COVID-19, PEST analysis, and other aspects. This analysis aids in setting benchmarks for various nations/regions and approximating market splits. Additionally, the general trend of the aforementioned components aid in determining the market's development possibilities.
- Country Level Data:
Various factors that are especially aligned to the country are taken into account to determine the market size for a certain area and country, including the presence of vendors, such as headquarters and offices, the country's GDP, demand patterns, and industry growth. To comprehend the market dynamics for the nation, a number of growth variables, inhibitors, application areas, and current market trends are researched. The aforementioned elements aid in determining the country's overall market's growth potential.
- Company Profile:
The “Table of Contents” is formulated by listing and analyzing more than 25 - 30 companies operating in the market ecosystem across geographies. However, we profile only 10 companies as a standard practice in our syndicate reports. These 10 companies comprise leading, emerging, and regional players. Nonetheless, our analysis is not restricted to the 10 listed companies, we also analyze other companies present in the market to develop a holistic view and understand the prevailing trends. The “Company Profiles” section in the report covers key facts, business description, products & services, financial information, SWOT analysis, and key developments. The financial information presented is extracted from the annual reports and official documents of the publicly listed companies. Upon collecting the information for the sections of respective companies, we verify them via various primary sources and then compile the data in respective company profiles. The company level information helps us in deriving the base number as well as in forecasting the market size.
- Developing Base Number:
Aggregation of sales statistics (2020-2022) and macro-economic factor, and other secondary and primary research insights are utilized to arrive at base number and related market shares for 2022. The data gaps are identified in this step and relevant market data is analyzed, collected from paid primary interviews or databases. On finalizing the base year market size, forecasts are developed on the basis of macro-economic, industry and market growth factors and company level analysis.
- Data Triangulation and Final Review:
The market findings and base year market size calculations are validated from supply as well as demand side. Demand side validations are based on macro-economic factor analysis and benchmarks for respective regions and countries. In case of supply side validations, revenues of major companies are estimated (in case not available) based on industry benchmark, approximate number of employees, product portfolio, and primary interviews revenues are gathered. Further revenue from target product/service segment is assessed to avoid overshooting of market statistics. In case of heavy deviations between supply and demand side values, all thes steps are repeated to achieve synchronization.
We follow an iterative model, wherein we share our research findings with Subject Matter Experts (SME’s) and Key Opinion Leaders (KOLs) until consensus view of the market is not formulated – this model negates any drastic deviation in the opinions of experts. Only validated and universally acceptable research findings are quoted in our reports.
We have important check points that we use to validate our research findings – which we call – data triangulation, where we validate the information, we generate from secondary sources with primary interviews and then we re-validate with our internal data bases and Subject matter experts. This comprehensive model enables us to deliver high quality, reliable data in shortest possible time.
 获取此报告的免费样本