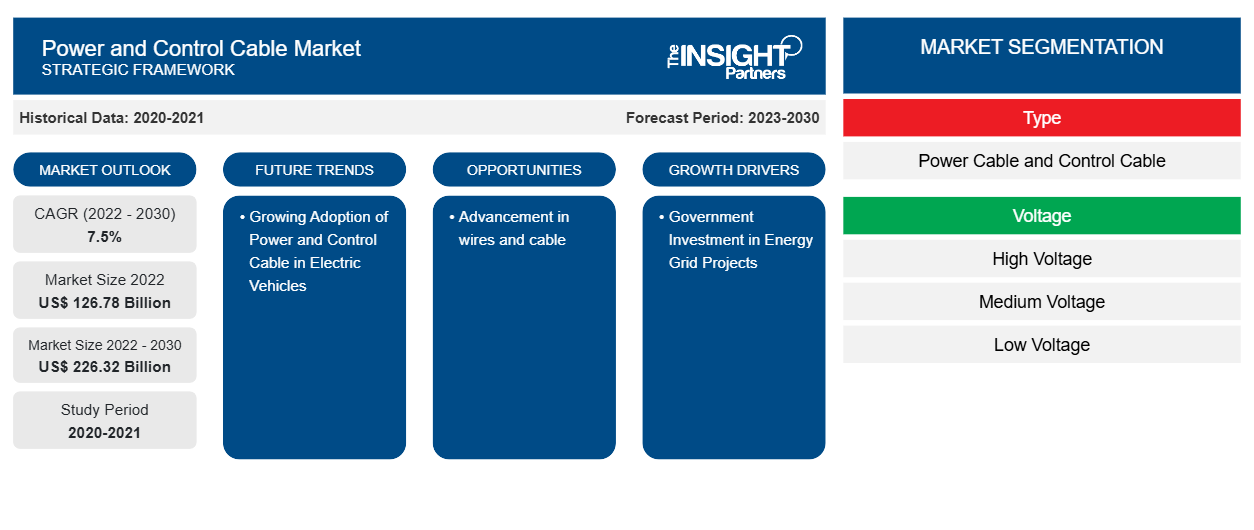
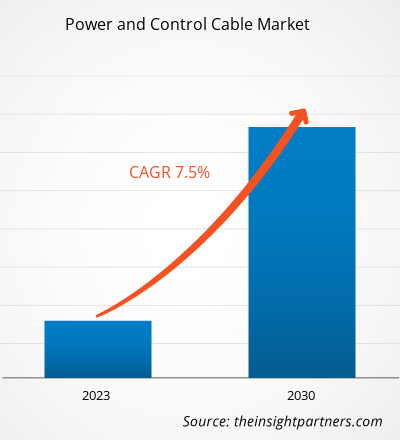
电力和控制电缆市场规模预计将从 2022 年的 1267.8 亿美元增至 2030 年的 2263.2 亿美元。预计 2022-2030 年期间市场复合年增长率将达到7.5 %。电线电缆的进步可能仍是市场的主要趋势。
电力和控制电缆市场分析
电动汽车中电力和控制电缆的日益普及以及对可靠电力的需求不断增长,推动了市场的发展。由于输配电行业的发展,预计预测期内市场将增长。此外,政府对电网项目的投资以及对数据中心和云计算的需求不断增长,为市场创造了丰厚的机会。
电力和控制电缆市场概览
电力电缆将能量从电源传输到设备。控制电缆传输控制设备运行的信号。电力电缆和控制电缆是住宅、商业和工业应用中用于供电和传输信号的最流行的电缆类型。电力电缆和控制电缆的应用需求在电压等级、屏蔽替代品、灵活性要求、耐油性和绝缘类型方面有所不同,以适应环境和操作环境。
定制此报告以满足您的需求
您可以免费定制任何报告,包括本报告的部分内容、国家级分析、Excel 数据包,以及为初创企业和大学提供优惠和折扣
电力和控制电缆市场:
- 获取此报告的关键市场趋势。这个免费样品将包括数据分析,从市场趋势到估计和预测。
电力和控制电缆市场驱动因素和机遇
电动汽车中电力和控制电缆的采用日益增多,有利于市场
2022 年 8 月,日本经济产业省估计,需要投资超过 240 亿美元来开发用于电动汽车 ( EV ) 和储能系统的电池的竞争性制造基地。电动汽车需求的增加和政府对电动汽车采用的支持正在推动市场的发展。2023 年 2 月,韩国政府宣布计划将补贴电动汽车的数量提高34%,从 2022 年的 160,000 辆增加到 2023 年的 215,000 辆。电动汽车需求的不断增长推动了对充电基础设施的需求,从而推动了对电力电缆的需求。
政府对能源网项目的投资
工业活动数量的增加使各行业对能源的需求激增,并增加了电力和控制电缆的采用,以实现适当的能源传输。对能源的需求促使政府采取纠正措施,实现有效的能源传输。以下是政府为扩大能源网项目而进行的几项投资-
- 2023 年 6 月,世界银行批准了一笔 2.684 亿美元的贷款,用于突尼斯-意大利互连线( ELMED ) 项目,该项目旨在通过一条 600 兆瓦的海底电缆将突尼斯电网与欧洲电网连接起来。欧洲复兴开发银行 ( EBRD )、欧洲投资银行 ( EIB ) 和德国国有银行KfW将为这个 10.8 亿美元的项目提供部分融资,意大利TSO Terna将提供其余融资。
- 2023 年 3 月,意大利TSO Terna宣布计划在未来十年内投资超过 222 亿美元用于开发意大利电网。该投资公告是Terna 2023 年国家电网发展计划的一部分。
此外,预测期内,政府对电网项目的投资增加将为市场创造机会。
电力和控制电缆市场报告细分分析
有助于得出电力和控制电缆市场分析的关键部分是类型、电压和应用。
- 根据类型,电力和控制电缆市场分为电力电缆和控制电缆。 2022 年,电力电缆部分占据了较大的市场份额。
- 根据电压,市场分为高压、中压和低压。低压部分在 2022 年占据了更大的市场份额。
- 根据应用,市场分为公用事业和工业。公用事业部门在 2022 年占据了更大的市场份额。
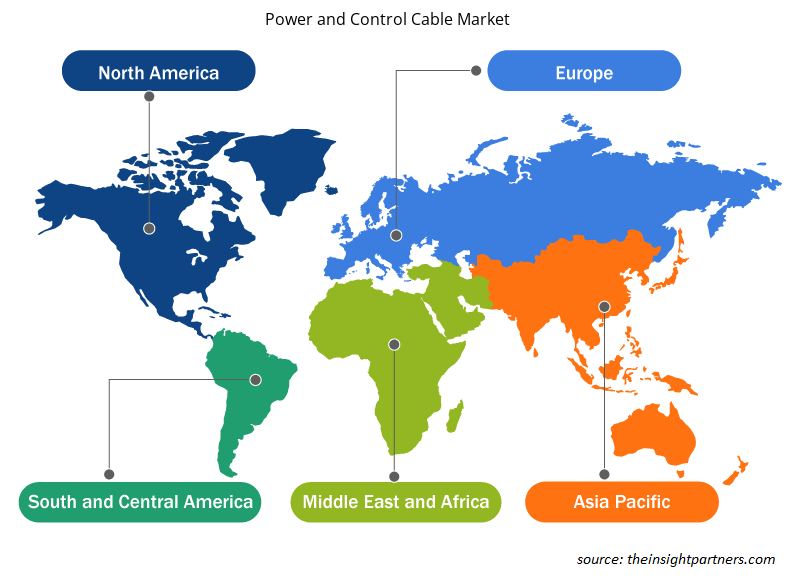
电力和控制电缆市场份额按地区分析
电力和控制电缆市场报告的地理范围主要分为五个区域:北美、亚太、欧洲、中东和非洲、南美和中美。
预计亚太地区市场将在预测期内扩大。2023 年 4 月,印度政府宣布计划到 2024-2025 年将线路公里 (ckm) 从 4,25,500(截至 2020 年 5 月 31 日)扩大到 4,54,200 ckm,从而根据 Gati Shakti 总体规划增加约 28,700 ckm。该增加量是在州际输电系统 (ISTS) 网络和 220kV 及以上电压等级中提出的。同样,2023 年 2 月,国有电网公司通过基于关税的竞争性招标方式获得了五个州际电力传输项目,这些项目将以建设、拥有、运营和转让 (BOOT) 的方式完成。因此,政府改善电力传输的举措正在推动该地区的市场发展。
电力和控制电缆市场区域洞察
Insight Partners 的分析师已详尽解释了预测期内影响电力和控制电缆市场的区域趋势和因素。本节还讨论了北美、欧洲、亚太地区、中东和非洲以及南美和中美洲的电力和控制电缆市场细分和地理位置。
- 获取电力和控制电缆市场的区域特定数据
电力和控制电缆市场报告范围
| 报告属性 | 细节 |
|---|---|
| 2022 年市场规模 | 1267.8亿美元 |
| 2030 年市场规模 | 2263.2亿美元 |
| 全球复合年增长率(2022 - 2030 年) | 7.5% |
| 史料 | 2020-2021 |
| 预测期 | 2023-2030 |
| 涵盖的领域 | 按类型
|
| 覆盖地区和国家 | 北美
|
| 市场领导者和主要公司简介 |
|
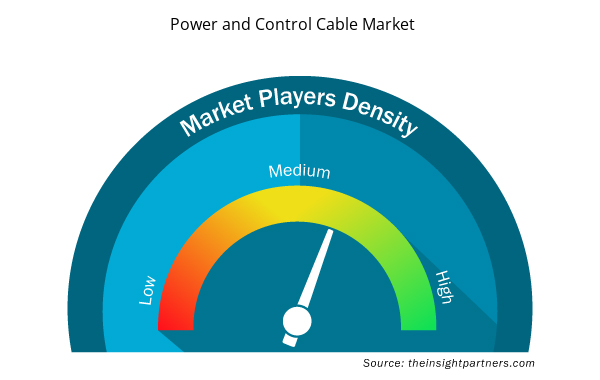
市场参与者密度:了解其对商业动态的影响
电力和控制电缆市场正在快速增长,这得益于最终用户需求的不断增长,这些需求源于消费者偏好的不断变化、技术进步以及对产品优势的认识不断提高等因素。随着需求的增加,企业正在扩大其产品范围,进行创新以满足消费者的需求,并利用新兴趋势,从而进一步推动市场增长。
市场参与者密度是指在特定市场或行业内运营的企业或公司的分布情况。它表明在给定市场空间中,相对于其规模或总市场价值,有多少竞争对手(市场参与者)存在。
在电力和控制电缆市场运营的主要公司有:
- 贝尔通公司
- 安可电线公司
- 古河电气工业株式会社
- 亨通集团有限公司
- 莱尼公司
- 耐克森公司
免责声明:上面列出的公司没有按照任何特定顺序排列。
- 获取电力和控制电缆市场顶级关键参与者概览
电力和控制电缆市场新闻和最新发展
电力和控制电缆市场通过收集一手和二手研究后的定性和定量数据进行评估,其中包括重要的公司出版物、协会数据和数据库。电力和控制电缆市场的一些发展情况如下:
- 住友电气工业株式会社宣布计划在英国苏格兰建立一家电力电缆工厂。(来源:住友电气工业株式会社,公司网站,2023 年 3 月)
电力和控制电缆市场报告范围和交付成果
“电力和控制电缆市场规模和预测(2020-2030 年)”报告对以下领域进行了详细的市场分析:
- 范围内涵盖的所有主要细分市场的全球、区域和国家层面的电力和控制电缆市场规模和预测
- 电力和控制电缆市场趋势以及市场动态,如驱动因素、限制因素和关键机遇
- 详细的 PEST/波特五力分析和 SWOT 分析
- 电力和控制电缆市场分析涵盖主要市场趋势、全球和区域框架、主要参与者、法规和最新市场发展
- 行业格局和竞争分析,涵盖市场集中度、热图分析、知名参与者以及电力和控制电缆市场的最新发展
- 详细的公司简介
- 历史分析(2 年)、基准年、预测(7 年)及复合年增长率
- PEST 和 SWOT 分析
- 市场规模价值/数量 - 全球、区域、国家
- 行业和竞争格局
- Excel 数据集
- Toothpaste Market
- Aerosol Paints Market
- Oxy-fuel Combustion Technology Market
- Animal Genetics Market
- USB Device Market
- Health Economics and Outcome Research (HEOR) Services Market
- Cell Line Development Market
- Maritime Analytics Market
- Social Employee Recognition System Market
- Medical Collagen Market

Report Coverage
Revenue forecast, Company Analysis, Industry landscape, Growth factors, and Trends

Segment Covered
This text is related
to segments covered.

Regional Scope
North America, Europe, Asia Pacific, Middle East & Africa, South & Central America

Country Scope
This text is related
to country scope.
常见问题
The global power and control cable market is estimated to register a CAGR of 7.5% during the forecast period 2022–2030.
The key players holding majority shares in the global power and control cable market are Belden Inc, Encore Wire Corp, Furukawa Electric Co Ltd, HENGTONG GROUP CO., LTD, LEONI AG, Nexans SA, Prysmian SpA, Riyadh Cables Group Co, Southwire Company LLC, Sumitomo Electric Industries Ltd.
The global power and control cable market is expected to reach US$ 226.32 billion by 2030.
Asia Pacific dominated the power and control cable market in 2022.
The growing adoption of video analytics powered by computer vision and the rising adoption of the Industry 4.0 Concept are the major factors that propel the global power and control cable market.
Advancements in wires and cable to play a significant role in the global power and control cable market in the coming years.
Trends and growth analysis reports related to Electronics and Semiconductor : READ MORE..
The List of Companies - Power and Control Cable Market
- Belden Inc
- Encore Wire Corp
- Furukawa Electric Co Ltd
- HENGTONG GROUP CO., LTD
- LEONI AG
- Nexans SA
- Prysmian SpA
- Riyadh Cables Group
- Southwire Company LLC
- Sumitomo Electric Industries Ltd
The Insight Partners performs research in 4 major stages: Data Collection & Secondary Research, Primary Research, Data Analysis and Data Triangulation & Final Review.
- Data Collection and Secondary Research:
As a market research and consulting firm operating from a decade, we have published and advised several client across the globe. First step for any study will start with an assessment of currently available data and insights from existing reports. Further, historical and current market information is collected from Investor Presentations, Annual Reports, SEC Filings, etc., and other information related to company’s performance and market positioning are gathered from Paid Databases (Factiva, Hoovers, and Reuters) and various other publications available in public domain.
Several associations trade associates, technical forums, institutes, societies and organization are accessed to gain technical as well as market related insights through their publications such as research papers, blogs and press releases related to the studies are referred to get cues about the market. Further, white papers, journals, magazines, and other news articles published in last 3 years are scrutinized and analyzed to understand the current market trends.
- Primary Research:
The primarily interview analysis comprise of data obtained from industry participants interview and answers to survey questions gathered by in-house primary team.
For primary research, interviews are conducted with industry experts/CEOs/Marketing Managers/VPs/Subject Matter Experts from both demand and supply side to get a 360-degree view of the market. The primary team conducts several interviews based on the complexity of the markets to understand the various market trends and dynamics which makes research more credible and precise.
A typical research interview fulfils the following functions:
- Provides first-hand information on the market size, market trends, growth trends, competitive landscape, and outlook
- Validates and strengthens in-house secondary research findings
- Develops the analysis team’s expertise and market understanding
Primary research involves email interactions and telephone interviews for each market, category, segment, and sub-segment across geographies. The participants who typically take part in such a process include, but are not limited to:
- Industry participants: VPs, business development managers, market intelligence managers and national sales managers
- Outside experts: Valuation experts, research analysts and key opinion leaders specializing in the electronics and semiconductor industry.
Below is the breakup of our primary respondents by company, designation, and region:

Once we receive the confirmation from primary research sources or primary respondents, we finalize the base year market estimation and forecast the data as per the macroeconomic and microeconomic factors assessed during data collection.
- Data Analysis:
Once data is validated through both secondary as well as primary respondents, we finalize the market estimations by hypothesis formulation and factor analysis at regional and country level.
- Macro-Economic Factor Analysis:
We analyse macroeconomic indicators such the gross domestic product (GDP), increase in the demand for goods and services across industries, technological advancement, regional economic growth, governmental policies, the influence of COVID-19, PEST analysis, and other aspects. This analysis aids in setting benchmarks for various nations/regions and approximating market splits. Additionally, the general trend of the aforementioned components aid in determining the market's development possibilities.
- Country Level Data:
Various factors that are especially aligned to the country are taken into account to determine the market size for a certain area and country, including the presence of vendors, such as headquarters and offices, the country's GDP, demand patterns, and industry growth. To comprehend the market dynamics for the nation, a number of growth variables, inhibitors, application areas, and current market trends are researched. The aforementioned elements aid in determining the country's overall market's growth potential.
- Company Profile:
The “Table of Contents” is formulated by listing and analyzing more than 25 - 30 companies operating in the market ecosystem across geographies. However, we profile only 10 companies as a standard practice in our syndicate reports. These 10 companies comprise leading, emerging, and regional players. Nonetheless, our analysis is not restricted to the 10 listed companies, we also analyze other companies present in the market to develop a holistic view and understand the prevailing trends. The “Company Profiles” section in the report covers key facts, business description, products & services, financial information, SWOT analysis, and key developments. The financial information presented is extracted from the annual reports and official documents of the publicly listed companies. Upon collecting the information for the sections of respective companies, we verify them via various primary sources and then compile the data in respective company profiles. The company level information helps us in deriving the base number as well as in forecasting the market size.
- Developing Base Number:
Aggregation of sales statistics (2020-2022) and macro-economic factor, and other secondary and primary research insights are utilized to arrive at base number and related market shares for 2022. The data gaps are identified in this step and relevant market data is analyzed, collected from paid primary interviews or databases. On finalizing the base year market size, forecasts are developed on the basis of macro-economic, industry and market growth factors and company level analysis.
- Data Triangulation and Final Review:
The market findings and base year market size calculations are validated from supply as well as demand side. Demand side validations are based on macro-economic factor analysis and benchmarks for respective regions and countries. In case of supply side validations, revenues of major companies are estimated (in case not available) based on industry benchmark, approximate number of employees, product portfolio, and primary interviews revenues are gathered. Further revenue from target product/service segment is assessed to avoid overshooting of market statistics. In case of heavy deviations between supply and demand side values, all thes steps are repeated to achieve synchronization.
We follow an iterative model, wherein we share our research findings with Subject Matter Experts (SME’s) and Key Opinion Leaders (KOLs) until consensus view of the market is not formulated – this model negates any drastic deviation in the opinions of experts. Only validated and universally acceptable research findings are quoted in our reports.
We have important check points that we use to validate our research findings – which we call – data triangulation, where we validate the information, we generate from secondary sources with primary interviews and then we re-validate with our internal data bases and Subject matter experts. This comprehensive model enables us to deliver high quality, reliable data in shortest possible time.
 获取此报告的免费样本