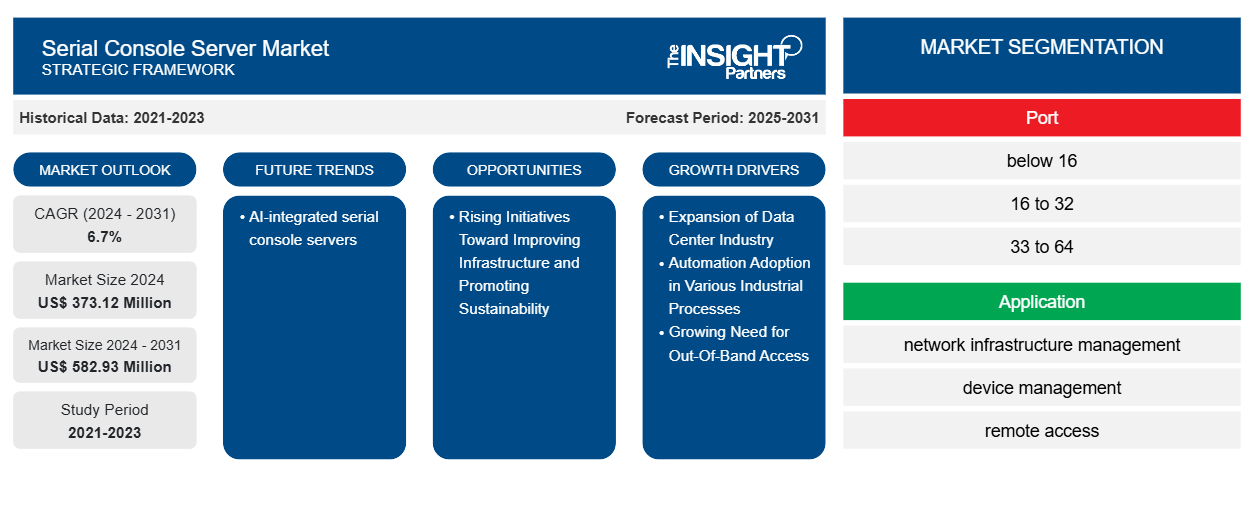
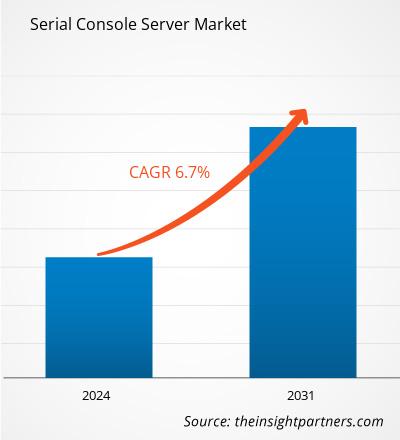
2024 年串行控制台服务器市场规模为 3.7312 亿美元,预计到 2031 年将达到 5.8293 亿美元;预计 2024-2031 年复合年增长率为 6.7%。集成 AI 的串行控制台服务器很可能在未来几年继续成为主要市场趋势。
串行控制台服务器市场分析
由于自动化和数字化转型趋势的加速,串行控制台服务器市场在未来几年将实现显着增长。串行控制台服务器在数据中心中必不可少,可为路由器、交换机和防火墙等设备提供安全的远程管理。对云服务的需求不断增长导致全球数据中心的快速发展,预计这将在预测期内为串行控制台服务器市场增长创造新的机会。此外,超大规模和主机托管数据数量的增加推动了串行控制台服务器市场的发展。
串行控制台服务器市场概览
串行控制台服务器允许 IT 和网络管理员远程访问、监控和管理带有控制台端口的设备,例如路由器、交换机、服务器、存储硬件、防火墙、配电单元 (PDU) 和不间断电源 (UPS)。部署串行控制台服务器可以提高业务连续性,使 IT 维护和管理更加轻松快捷,并节省成本和时间。IT 团队可以从中心位置使用串行控制台技术对设备进行故障排除、配置或重新启动,无论设备位于何处:在现场数据中心、附近的建筑物或主机托管设施中,甚至在其他城市的远程办公室和设施中。
定制此报告以满足您的需求
您可以免费定制任何报告,包括本报告的部分内容、国家级分析、Excel 数据包,以及为初创企业和大学提供优惠和折扣
串行控制台服务器市场:
- 获取此报告的关键市场趋势。这个免费样品将包括数据分析,从市场趋势到估计和预测。
串行控制台服务器市场驱动因素和机遇
各种工业流程中的自动化应用
自动化正在改变各个行业的门禁系统,导致对传感器和电机等相关产品的需求大幅增加。随着组织专注于提高运营效率和降低成本,将串行控制台服务器集成到自动化系统中变得至关重要。这些服务器可实现无缝数据通信,使自动化系统能够实时收集、传输和分析来自传统设备的数据。随着企业继续优先考虑效率和降低成本,串行设备服务器在自动化中的作用变得越来越重要。这些服务器提供的通信可实现远程监控、数据分析和预测性维护等关键功能,这些功能对于优化性能和减少自动化系统的停机时间至关重要。例如,2023 年 3 月,EPEVER 推出了 EPEVER TCP 306,这是一款专为实时远程监控控制器和逆变器而设计的服务器。该服务器提供长距离高速数据传输,同时最大限度地降低功耗。因此,各个行业对自动化的采用推动了串行控制台服务器市场的发展。
带外访问需求日益增长
在灾难恢复场景中,企业并不完全依赖基于软件的网络和系统管理工具,因为这些工具可能会因中断而不可用。为了克服这一挑战,通过串行控制台服务器进行带外访问非常有价值。串行控制台服务器独立于操作系统运行,并提供各种连接选项,为用户提供通过串行端口对网络设备和 IT基础设施的紧急访问。带外访问的一些主要好处包括远程故障排除、维护和管理串行控制台服务器(即使在失去网络访问的情况下),通过快速从灾难、中断和其他问题中恢复来最大限度地减少停机时间,并节省与派遣技术人员到远程站点相关的差旅费用。
串行控制台服务器市场报告细分分析
有助于得出串行控制台服务器市场分析的关键部分是端口、应用程序和最终用户行业。
- 根据端口,市场分为 16 以下、16 到 32、33 到 64 和 64 以上。16 到 32 部分在 2024 年占据串行控制台服务器市场的最大份额。
- 根据应用,市场细分为网络基础设施管理、设备管理、远程访问、安全管理和灾难恢复。远程访问部分在 2024 年占据串行控制台服务器市场的最大份额。
- 根据最终用户行业,市场分为 IT 和电信、BFSI、医疗保健、制造、零售等。2024 年,IT 和电信部门在串行控制台服务器市场中占有最大份额
串行控制台服务器市场份额(按地区)分析
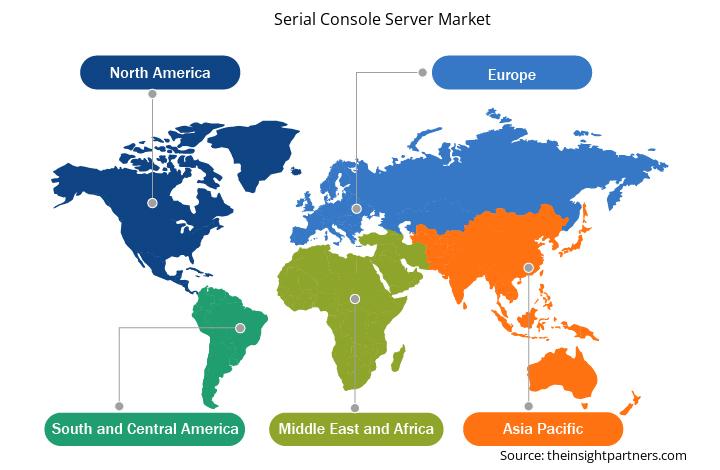
- 串行控制台服务器市场分为五个主要区域:北美、欧洲、亚太地区 (APAC)、中东和非洲 (MEA) 以及南美和中美。北美在 2024 年占据市场主导地位,其次是欧洲和亚太地区。
- 在亚太地区,随着数字基础设施的兴起,对云环境的强大和安全管理工具的需求也在增加。对云服务的这种依赖推动了对串行控制台服务器的需求,这些服务器对于远程管理、监控和排除基于云的服务器故障至关重要。随着制造商采用人工智能、物联网和自动化等数字技术,未来几年对涉及软件、硬件和 IT 基础设施的先进解决方案的需求预计也会增加。这一因素促使人们采用串行控制台服务器来管理数据中心、网络设备和 IT 基础设施。电信行业的扩张促进了 5G 网络、光纤基础设施和快速数据传输的进步。这一因素推动了对可靠和可扩展 IT 基础设施的需求,这进一步推动了对串行控制台服务器的需求,以远程管理和监控网络设备,确保平稳运行并最大限度地减少停机时间。
串行控制台服务器市场区域洞察
Insight Partners 的分析师已详细解释了预测期内影响串行控制台服务器市场的区域趋势和因素。本节还讨论了北美、欧洲、亚太地区、中东和非洲以及南美和中美洲的串行控制台服务器市场细分和地理位置。
- 获取串行控制台服务器市场的区域特定数据
串行控制台服务器市场报告范围
| 报告属性 | 细节 |
|---|---|
| 2024 年的市场规模 | 3.7312亿美元 |
| 2031 年市场规模 | 5.8293亿美元 |
| 全球复合年增长率(2024 - 2031) | 6.7% |
| 史料 | 2021-2023 |
| 预测期 | 2025-2031 |
| 涵盖的领域 | 按港口
|
| 覆盖地区和国家 | 北美
|
| 市场领导者和主要公司简介 |
|
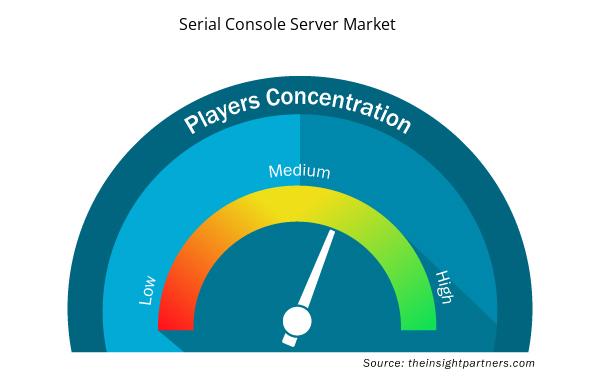
串行控制台服务器市场参与者密度:了解其对业务动态的影响
串行控制台服务器市场正在快速增长,这得益于最终用户需求的不断增长,而这些需求又源于消费者偏好的不断变化、技术进步以及对产品优势的认识不断提高等因素。随着需求的增加,企业正在扩大其产品范围,进行创新以满足消费者的需求,并利用新兴趋势,从而进一步推动市场增长。
市场参与者密度是指在特定市场或行业内运营的企业或公司的分布情况。它表明在给定市场空间中,相对于其规模或总市场价值,有多少竞争对手(市场参与者)存在。
在串行控制台服务器市场运营的主要公司有:
- 宏正自动科技股份有限公司
- 黑匣子
- 惠普企业发展有限公司
- Lantronix 公司
- Opengear 公司
- Perle 系统
免责声明:上面列出的公司没有按照任何特定顺序排列。
- 获取串行控制台服务器市场顶级关键参与者概述
串行控制台服务器市场新闻和最新发展
通过收集主要和次要研究后的定性和定量数据来评估串行控制台服务器市场,其中包括重要的公司出版物、协会数据和数据库。下面列出了串行控制台服务器市场的一些发展情况:
- Lantronix Inc. 是支持 AI Edge 智能的 IoT 解决方案的计算和连接领域的全球领导者,该公司将于 2025 年 2 月 10 日至 14 日在阿姆斯特丹 RAI 的 Cisco Live 期间在 A10 展台首次推出其新的 LM4 AI 驱动带外管理 (OOBM) 平台。Lantronix 的 LM4 是业界第一款专为中间配线架 (IDF) 和紧凑型环境(如 ATM、自助服务终端和网络聚合点)设计、尺寸和定价的控制台服务器。LM4 专为医疗保健、金融、公用事业、电信、政府、零售和制造业而设计,利用在军事和金融网络中经过验证的技术,提供企业级自动化、合规性和网络安全功能。(来源:Lantronix Inc.,新闻稿,2025 年 2 月)
- 伊顿宣布推出伊顿 NetDirector KVM(北美) over IP 交换机,这是一种新的解决方案,可让数据中心和分布式 IT 环境的运营商远程管理连接的 IT 设备。凭借远程管理功能以及广泛的兼容性和可扩展性,伊顿的 NetDirector KVM over IP 交换机为多种环境中的机架级设备提供了方便且安全的入口。
(来源:伊顿公司,新闻稿,2024 年 5 月)
串行控制台服务器市场报告覆盖范围和交付成果
“串行控制台服务器市场规模和预测(2021-2031)”提供了详细的市场分析,涵盖以下领域:
- 串行控制台服务器市场规模以及范围涵盖的所有关键细分市场的全球、区域和国家/地区预测
- 串行控制台服务器市场趋势以及市场动态,如驱动因素、限制因素和关键机遇
- 详细的 PEST 和 SWOT 分析
- 串行控制台服务器市场分析涵盖关键市场趋势、全球和区域框架、主要参与者、法规和最新市场发展
- 行业格局和竞争分析,涵盖市场集中度、热图分析、知名参与者以及串行控制台服务器市场的最新发展
- 详细的公司简介
- 历史分析(2 年)、基准年、预测(7 年)及复合年增长率
- PEST 和 SWOT 分析
- 市场规模价值/数量 - 全球、区域、国家
- 行业和竞争格局
- Excel 数据集
- Data Center Cooling Market
- Sleep Apnea Diagnostics Market
- Single Pair Ethernet Market
- Airport Runway FOD Detection Systems Market
- Electronic Health Record Market
- Webbing Market
- Transdermal Drug Delivery System Market
- Arterial Blood Gas Kits Market
- Environmental Consulting Service Market
- Malaria Treatment Market

Report Coverage
Revenue forecast, Company Analysis, Industry landscape, Growth factors, and Trends

Segment Covered
This text is related
to segments covered.

Regional Scope
North America, Europe, Asia Pacific, Middle East & Africa, South & Central America

Country Scope
This text is related
to country scope.
常见问题
The serial console server market is expected to reach US$ 582.93 million by 2031.
The key players, holding majority shares, in serial console server market includes ATEN International, Vertiv Group Corp, Blackbox, Raritran, Inc, (Legrand), and WTI – Western Telematic, Inc.
The AI-integrated serial console servers are the major future trends for the global serial console server market.
The expansion of data center industry, automation adoption in various industrial processes and growing need for out-of-band access are the factors driving the serial console server market growth.
APAC is anticipated to grow with the highest CAGR over the forecast period.
The global serial console server market was estimated to be USD 373.12 million in 2024 and is expected to grow at a CAGR of 6.7%, during the forecast period 2025 - 2031.
The 16 to 32 segment led the serial console server market with a significant share in 2024.
Trends and growth analysis reports related to Electronics and Semiconductor : READ MORE..
The List of Companies - Serial Console Server Market
- ATEN International Co, Ltd
- Black Box
- Hewlett Packard Enterprise Development LP
- Lantronix, Inc.
- Opengear, Inc.
- Perle Systems
- Raritan Inc.
- Eaton
- Vertiv
- WTI–Western Telematic, Inc
The Insight Partners performs research in 4 major stages: Data Collection & Secondary Research, Primary Research, Data Analysis and Data Triangulation & Final Review.
- Data Collection and Secondary Research:
As a market research and consulting firm operating from a decade, we have published and advised several client across the globe. First step for any study will start with an assessment of currently available data and insights from existing reports. Further, historical and current market information is collected from Investor Presentations, Annual Reports, SEC Filings, etc., and other information related to company’s performance and market positioning are gathered from Paid Databases (Factiva, Hoovers, and Reuters) and various other publications available in public domain.
Several associations trade associates, technical forums, institutes, societies and organization are accessed to gain technical as well as market related insights through their publications such as research papers, blogs and press releases related to the studies are referred to get cues about the market. Further, white papers, journals, magazines, and other news articles published in last 3 years are scrutinized and analyzed to understand the current market trends.
- Primary Research:
The primarily interview analysis comprise of data obtained from industry participants interview and answers to survey questions gathered by in-house primary team.
For primary research, interviews are conducted with industry experts/CEOs/Marketing Managers/VPs/Subject Matter Experts from both demand and supply side to get a 360-degree view of the market. The primary team conducts several interviews based on the complexity of the markets to understand the various market trends and dynamics which makes research more credible and precise.
A typical research interview fulfils the following functions:
- Provides first-hand information on the market size, market trends, growth trends, competitive landscape, and outlook
- Validates and strengthens in-house secondary research findings
- Develops the analysis team’s expertise and market understanding
Primary research involves email interactions and telephone interviews for each market, category, segment, and sub-segment across geographies. The participants who typically take part in such a process include, but are not limited to:
- Industry participants: VPs, business development managers, market intelligence managers and national sales managers
- Outside experts: Valuation experts, research analysts and key opinion leaders specializing in the electronics and semiconductor industry.
Below is the breakup of our primary respondents by company, designation, and region:

Once we receive the confirmation from primary research sources or primary respondents, we finalize the base year market estimation and forecast the data as per the macroeconomic and microeconomic factors assessed during data collection.
- Data Analysis:
Once data is validated through both secondary as well as primary respondents, we finalize the market estimations by hypothesis formulation and factor analysis at regional and country level.
- Macro-Economic Factor Analysis:
We analyse macroeconomic indicators such the gross domestic product (GDP), increase in the demand for goods and services across industries, technological advancement, regional economic growth, governmental policies, the influence of COVID-19, PEST analysis, and other aspects. This analysis aids in setting benchmarks for various nations/regions and approximating market splits. Additionally, the general trend of the aforementioned components aid in determining the market's development possibilities.
- Country Level Data:
Various factors that are especially aligned to the country are taken into account to determine the market size for a certain area and country, including the presence of vendors, such as headquarters and offices, the country's GDP, demand patterns, and industry growth. To comprehend the market dynamics for the nation, a number of growth variables, inhibitors, application areas, and current market trends are researched. The aforementioned elements aid in determining the country's overall market's growth potential.
- Company Profile:
The “Table of Contents” is formulated by listing and analyzing more than 25 - 30 companies operating in the market ecosystem across geographies. However, we profile only 10 companies as a standard practice in our syndicate reports. These 10 companies comprise leading, emerging, and regional players. Nonetheless, our analysis is not restricted to the 10 listed companies, we also analyze other companies present in the market to develop a holistic view and understand the prevailing trends. The “Company Profiles” section in the report covers key facts, business description, products & services, financial information, SWOT analysis, and key developments. The financial information presented is extracted from the annual reports and official documents of the publicly listed companies. Upon collecting the information for the sections of respective companies, we verify them via various primary sources and then compile the data in respective company profiles. The company level information helps us in deriving the base number as well as in forecasting the market size.
- Developing Base Number:
Aggregation of sales statistics (2020-2022) and macro-economic factor, and other secondary and primary research insights are utilized to arrive at base number and related market shares for 2022. The data gaps are identified in this step and relevant market data is analyzed, collected from paid primary interviews or databases. On finalizing the base year market size, forecasts are developed on the basis of macro-economic, industry and market growth factors and company level analysis.
- Data Triangulation and Final Review:
The market findings and base year market size calculations are validated from supply as well as demand side. Demand side validations are based on macro-economic factor analysis and benchmarks for respective regions and countries. In case of supply side validations, revenues of major companies are estimated (in case not available) based on industry benchmark, approximate number of employees, product portfolio, and primary interviews revenues are gathered. Further revenue from target product/service segment is assessed to avoid overshooting of market statistics. In case of heavy deviations between supply and demand side values, all thes steps are repeated to achieve synchronization.
We follow an iterative model, wherein we share our research findings with Subject Matter Experts (SME’s) and Key Opinion Leaders (KOLs) until consensus view of the market is not formulated – this model negates any drastic deviation in the opinions of experts. Only validated and universally acceptable research findings are quoted in our reports.
We have important check points that we use to validate our research findings – which we call – data triangulation, where we validate the information, we generate from secondary sources with primary interviews and then we re-validate with our internal data bases and Subject matter experts. This comprehensive model enables us to deliver high quality, reliable data in shortest possible time.
 获取此报告的免费样本