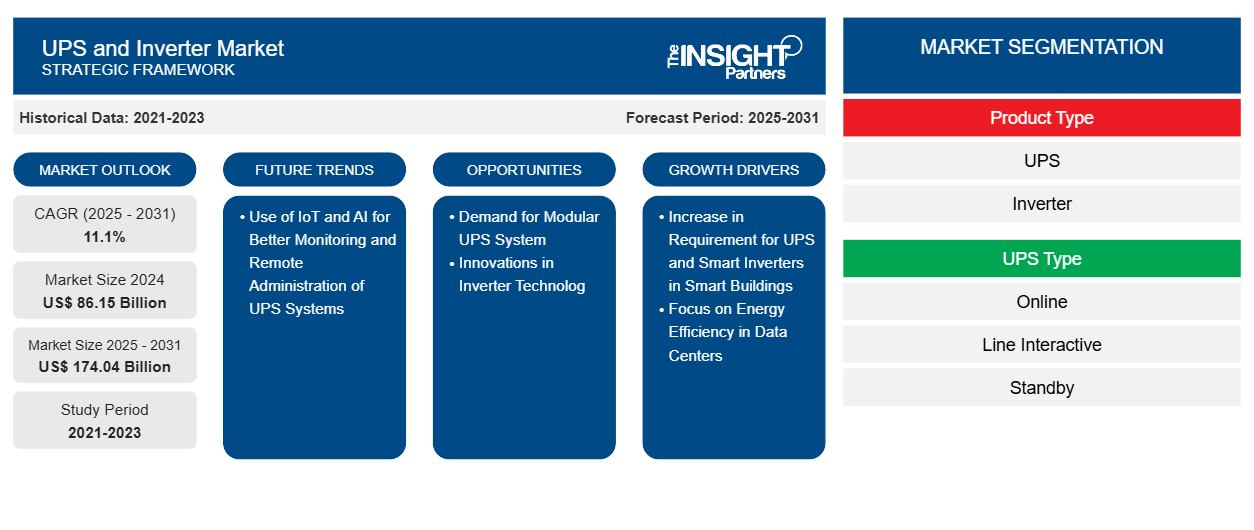
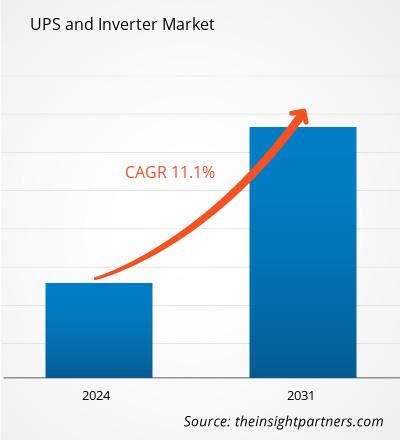
2024 年 UPS 和逆变器市场价值为 861.5 亿美元,预计到 2031 年将达到 1740.4 亿美元。预计 2025 年至 2031 年 UPS 和逆变器市场复合年增长率 为11.1%。使用物联网和人工智能更好地监控和远程管理 UPS 系统可能会继续成为市场的主要趋势。
UPS 和逆变器市场分析
由于模块化 UPS 系统能够帮助适应不断变化的电力需求,因此其日益普及,预计将为未来几年 UPS 市场的增长创造机会。此外,可再生能源的需求和逆变器技术的创新预计将在预测期内使逆变器市场受益。此外,物联网和人工智能在更好的监控和远程管理方面的日益普及预计将成为未来几年UPS 和逆变器市场的主要趋势。数据中心占全球能源使用量的很大一部分,而且随着数据需求的增加,这一数字预计只会上升。根据 2023 年 AFL 数据,全球数据中心利用了总能源输出的约 3%,超大规模数据中心占全球数据中心电力需求的 20%,到 2020 年增长到 50%。微软位于伊利诺伊州芝加哥的 700,000 平方英尺数据中心是世界上最大的设施之一,能够消耗 198 兆瓦的电力。
UPS 和逆变器市场概况
UPS 提供备用电源,防止电网断电时设备损坏。UPS 系统广泛用于数据服务器、计算机系统、工业环境和实验室。由于 UPS 可保护工厂中不同类型的连接设备,因此它特别适用于易受断电或其他电能质量问题影响的设施。例如,UPS 系统通常用于支持计算机和服务器,因为突然断电可能会导致数据丢失。逆变器将电力从直流电 (DC) 转换为交流电 (AC)。这些系统用于广泛的应用,包括小型汽车适配器、家庭或办公室应用以及大型电网系统。在断电期间,它将电池、太阳能电池板或整流器中存储的直流电转换为交流电,随后可供冰箱或电视等不同的家用设备使用。太阳能系统将使用太阳能电池板提供的直流电转换为交流电,供住宅或其他大规模使用。
定制此报告以满足您的需求
您可以免费定制任何报告,包括本报告的部分内容、国家级分析、Excel 数据包,以及为初创企业和大学提供优惠和折扣
UPS 和逆变器市场:
- 获取此报告的关键市场趋势。这个免费样品将包括数据分析,从市场趋势到估计和预测。
UPS 和逆变器市场驱动因素和机遇
智能建筑对UPS和智能逆变器的需求增加有利于市场
智能建筑使用现代楼宇自动化技术来优化能源使用。UPS 在高需求期间提供补充电力,降低建筑物的总体能耗。此外,它的使用可以减少能源开支,实现可持续和环保的建筑。此外,UPS 还可以提高建筑物电气系统的整体可靠性。它可以充当电气系统和外部电源之间的缓冲器,减少电压波动并提高电能质量。它的作用还可以确保该系统更高效地运行,减少设备的磨损并延长其使用寿命。eco-friendly construction. Moreover, UPS can contribute to the overall reliability of a building's electrical system. It can function as a buffer between the electrical system and external power sources, reducing voltage fluctuations and improving power quality. Its role also ensures that this system runs more efficiently, reducing wear and tear on equipment and increasing its lifespan.
关注数据中心的能源效率以创造市场增长机会
数据中心的电力负荷较高,因此需要安装更大的 UPS 系统来支持它们。节能 UPS 系统可能包括“生态模式”,其特点是能够减少电力损耗。在生态模式下运行 UPS 系统可以将其能源费用降低高达 2%。与标准 UPS 系统相比,经 ENERGY STAR 认证的 UPS 可以帮助减少与能源消耗相关的财务损失 30-55%。例如,大型数据中心使用的 1,000 kVA UPS 每年可节省 18,000 美元。此外,根据能源部 (DOE) 的数据,一个 15,000 平方英尺的数据中心以每平方英尺 100 瓦的功率运行,每年需要 13,140 兆瓦时的能源用于 IT 设备。如果将提供如此大功率的 UPS 系统的效率提高 90-95%,每年将节省 768,421 千瓦时的电能,以每千瓦时 0.12 美元的费率计算,能源成本将降低近 90,000 美元。因此,预计在预测期内,数据中心对能源效率的关注将推动 UPS 和逆变器市场的发展。
UPS 和逆变器市场报告细分分析
有助于得出 UPS 和逆变器市场分析的关键部分是类型、UPS 类型、逆变器额定值和应用。
- 根据类型,市场分为 UPS 和逆变器。近场细分市场在 2024 年占据市场主导地位。
- 根据 UPS 类型,市场分为备用、在线互动和在线。在线市场在 2024 年占据市场主导地位。
- 根据逆变器额定功率,UPS 和逆变器市场细分为小于 5 kW、5KW 至 100 kW、100KW 至 500 kW 和 500 kW 以上。5KW 至 100 kW 细分市场在 2024 年占据市场主导地位。
- 根据应用,UPS 和逆变器市场分为商业、住宅和工业。工业领域在 2024 年占据市场主导地位。
UPS 和逆变器市场份额按地区分析
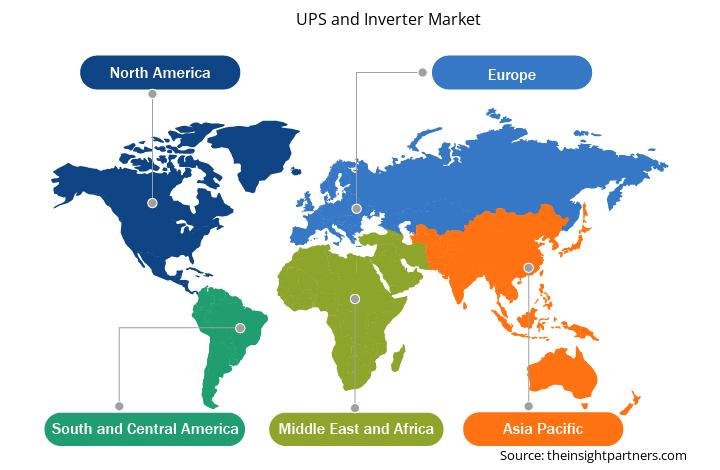
UPS 和逆变器市场报告的地理范围主要分为五个地区:北美、欧洲、亚太地区、中东和非洲以及南美和中美。北美在 2024 年占据了相当大的市场份额。由于拥有完善的数据中心,它是一个工业和经济先进的地区。2024 年 10 月,微软宣布计划在利金县开发三个数据中心园区,初期投资 10 亿美元。这些园区将在纽奥尔巴尼、希思和希伯伦开发,最初每个园区都有一栋建筑;不过,它计划以后在每个站点容纳几栋建筑。这些园区将帮助微软扩展其云基础设施,以支持全球数字服务的增长。除了这些发展之外,该地区对智能电网投资的增加也促进了对 UPS 和逆变器的需求增加。 2023 年,美国能源部宣布拨款 35 亿美元,用于增加风能和太阳能发电能力、加强电线抵御极端天气的能力、整合电池和电动汽车,以及开发微电网以确保停电期间灯光正常运转。
UPS 和逆变器市场区域洞察
Insight Partners 的分析师已详尽解释了预测期内影响 UPS 和逆变器市场的区域趋势和因素。本节还讨论了北美、欧洲、亚太地区、中东和非洲以及南美和中美洲的 UPS 和逆变器市场细分和地理位置。
- 获取 UPS 和逆变器市场的区域特定数据
UPS 和逆变器市场报告范围
| 报告属性 | 细节 |
|---|---|
| 2024 年的市场规模 | 861.5亿美元 |
| 2031 年市场规模 | 1740.4亿美元 |
| 全球复合年增长率(2025 - 2031) | 11.1% |
| 史料 | 2021-2023 |
| 预测期 | 2025-2031 |
| 涵盖的领域 | 按产品类型
|
| 覆盖地区和国家 | 北美
|
| 市场领导者和主要公司简介 |
|
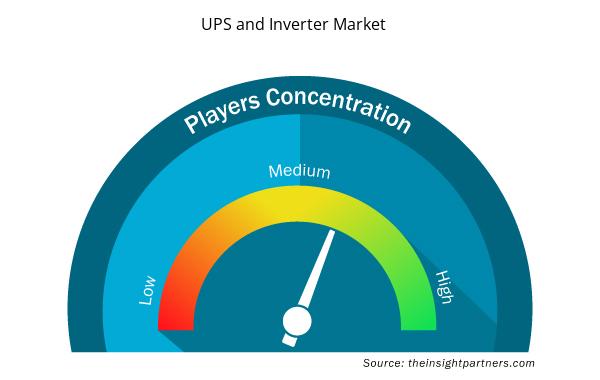
UPS 和逆变器市场参与者密度:了解其对业务动态的影响
由于消费者偏好的不断变化、技术进步以及对产品优势的认识不断提高等因素,终端用户需求不断增加,推动了 UPS 和逆变器市场快速增长。随着需求的增加,企业正在扩大其产品范围,进行创新以满足消费者需求,并利用新兴趋势,从而进一步推动市场增长。
市场参与者密度是指在特定市场或行业内运营的企业或公司的分布情况。它表明在给定市场空间中,相对于其规模或总市场价值,有多少竞争对手(市场参与者)存在。
在 UPS 和逆变器市场运营的主要公司有:
- 施耐德电气
- ABB有限公司
- 东芝公司
- Cyber Power Systems(美国)有限公司
- 伊顿公司
- 艾默生电气公司
免责声明:上面列出的公司没有按照任何特定顺序排列。
- 获取 UPS 和逆变器市场顶级关键参与者概览
UPS 和逆变器市场新闻和最新发展
UPS 和逆变器市场通过收集主要和次要研究后的定性和定量数据进行评估,其中包括重要的公司出版物、协会数据和数据库。以下列出了 UPS 和逆变器市场的一些发展情况:
- Su-Kam Power Systems Ltd. 是电力备份和太阳能解决方案行业的领先企业,该公司制定了一个雄心勃勃的目标,即在未来 5 年内实现 600 亿印度卢比的收入。该公司预计本财年的营业额将达到 70 亿印度卢比,并有信心实现营业额同比增长 200% 的目标收入数字。(来源:Su-Kam Power Systems Ltd,新闻稿,2024 年 7 月)
- 台达宣布推出其最新创新产品 UZR Gen3 系列 UPS 锂离子电池系统。这款最先进的锂离子电池架解决方案专为数据中心行业设计,旨在实现无与伦比的安全性、可靠性和总拥有成本 (TCO) 降低。UZR Gen3 系列代表了关键电源管理的重大飞跃,可与现有的台达解决方案无缝集成,包括电力设备、冷却系统和其他必要的电气硬件。(来源:台达,新闻稿,2024 年 6 月)
UPS 和逆变器市场报告范围和交付成果
“UPS 和逆变器市场规模和预测(2021-2031 年)”报告对市场进行了详细分析,涵盖以下领域:
- 范围内涵盖的所有主要细分市场的全球、区域和国家层面的 UPS 和逆变器市场规模和预测
- UPS 和逆变器市场趋势以及市场动态,如驱动因素、限制因素和关键机遇
- 详细的 PEST/波特五力分析和 SWOT 分析
- UPS 和逆变器市场分析涵盖主要市场趋势、全球和区域框架、主要参与者、法规和最新市场发展
- 行业格局和竞争分析,涵盖市场集中度、热图分析、知名参与者以及 UPS 和逆变器市场的最新发展
- 详细的公司简介
- 历史分析(2 年)、基准年、预测(7 年)及复合年增长率
- PEST 和 SWOT 分析
- 市场规模价值/数量 - 全球、区域、国家
- 行业和竞争格局
- Excel 数据集

Report Coverage
Revenue forecast, Company Analysis, Industry landscape, Growth factors, and Trends

Segment Covered
This text is related
to segments covered.

Regional Scope
North America, Europe, Asia Pacific, Middle East & Africa, South & Central America

Country Scope
This text is related
to country scope.
常见问题
Asia Pacific dominated the UPS and inverter market in 2024.
The increase in requirement for UPS and smart inverters in smart buildings, and the focus on energy efficiency in data centers are the major factors bolstering the market.
The use of IoT and AI for better monitoring and remote administration of UPS systems is likely to prevail as a key trend in the market.
Eaton, Cyber Power Systems, Schneider Electric, ABB Ltd, and Toshiba Corporation are among the leading players in the UPS and inverter market.
The UPS and Inverter market is expected to reach an estimated value of US$ 174.04 billion by 2031.
The market is expected to grow at a CAGR of 11.1% over the forecast period.
Trends and growth analysis reports related to Electronics and Semiconductor : READ MORE..
The List of Companies - UPS and Inverter Market
- Schneider Electric SE
- ABB Ltd
- TOSHIBA CORPORATION
- Cyber Power Systems (USA) Inc
- Eaton Corp Plc
- Emerson Electric Co
- Delta Electronics Inc
- Legrand SA
- Kirloskar Electric Company
- OMRON Corp
- Exide Industries Ltd
- Luminous Power Technologies Pvt Ltd
- Microtek
- Su-Kam Power Systems Ltd.
- Kehua Data Co Ltd
The Insight Partners performs research in 4 major stages: Data Collection & Secondary Research, Primary Research, Data Analysis and Data Triangulation & Final Review.
- Data Collection and Secondary Research:
As a market research and consulting firm operating from a decade, we have published and advised several client across the globe. First step for any study will start with an assessment of currently available data and insights from existing reports. Further, historical and current market information is collected from Investor Presentations, Annual Reports, SEC Filings, etc., and other information related to company’s performance and market positioning are gathered from Paid Databases (Factiva, Hoovers, and Reuters) and various other publications available in public domain.
Several associations trade associates, technical forums, institutes, societies and organization are accessed to gain technical as well as market related insights through their publications such as research papers, blogs and press releases related to the studies are referred to get cues about the market. Further, white papers, journals, magazines, and other news articles published in last 3 years are scrutinized and analyzed to understand the current market trends.
- Primary Research:
The primarily interview analysis comprise of data obtained from industry participants interview and answers to survey questions gathered by in-house primary team.
For primary research, interviews are conducted with industry experts/CEOs/Marketing Managers/VPs/Subject Matter Experts from both demand and supply side to get a 360-degree view of the market. The primary team conducts several interviews based on the complexity of the markets to understand the various market trends and dynamics which makes research more credible and precise.
A typical research interview fulfils the following functions:
- Provides first-hand information on the market size, market trends, growth trends, competitive landscape, and outlook
- Validates and strengthens in-house secondary research findings
- Develops the analysis team’s expertise and market understanding
Primary research involves email interactions and telephone interviews for each market, category, segment, and sub-segment across geographies. The participants who typically take part in such a process include, but are not limited to:
- Industry participants: VPs, business development managers, market intelligence managers and national sales managers
- Outside experts: Valuation experts, research analysts and key opinion leaders specializing in the electronics and semiconductor industry.
Below is the breakup of our primary respondents by company, designation, and region:

Once we receive the confirmation from primary research sources or primary respondents, we finalize the base year market estimation and forecast the data as per the macroeconomic and microeconomic factors assessed during data collection.
- Data Analysis:
Once data is validated through both secondary as well as primary respondents, we finalize the market estimations by hypothesis formulation and factor analysis at regional and country level.
- Macro-Economic Factor Analysis:
We analyse macroeconomic indicators such the gross domestic product (GDP), increase in the demand for goods and services across industries, technological advancement, regional economic growth, governmental policies, the influence of COVID-19, PEST analysis, and other aspects. This analysis aids in setting benchmarks for various nations/regions and approximating market splits. Additionally, the general trend of the aforementioned components aid in determining the market's development possibilities.
- Country Level Data:
Various factors that are especially aligned to the country are taken into account to determine the market size for a certain area and country, including the presence of vendors, such as headquarters and offices, the country's GDP, demand patterns, and industry growth. To comprehend the market dynamics for the nation, a number of growth variables, inhibitors, application areas, and current market trends are researched. The aforementioned elements aid in determining the country's overall market's growth potential.
- Company Profile:
The “Table of Contents” is formulated by listing and analyzing more than 25 - 30 companies operating in the market ecosystem across geographies. However, we profile only 10 companies as a standard practice in our syndicate reports. These 10 companies comprise leading, emerging, and regional players. Nonetheless, our analysis is not restricted to the 10 listed companies, we also analyze other companies present in the market to develop a holistic view and understand the prevailing trends. The “Company Profiles” section in the report covers key facts, business description, products & services, financial information, SWOT analysis, and key developments. The financial information presented is extracted from the annual reports and official documents of the publicly listed companies. Upon collecting the information for the sections of respective companies, we verify them via various primary sources and then compile the data in respective company profiles. The company level information helps us in deriving the base number as well as in forecasting the market size.
- Developing Base Number:
Aggregation of sales statistics (2020-2022) and macro-economic factor, and other secondary and primary research insights are utilized to arrive at base number and related market shares for 2022. The data gaps are identified in this step and relevant market data is analyzed, collected from paid primary interviews or databases. On finalizing the base year market size, forecasts are developed on the basis of macro-economic, industry and market growth factors and company level analysis.
- Data Triangulation and Final Review:
The market findings and base year market size calculations are validated from supply as well as demand side. Demand side validations are based on macro-economic factor analysis and benchmarks for respective regions and countries. In case of supply side validations, revenues of major companies are estimated (in case not available) based on industry benchmark, approximate number of employees, product portfolio, and primary interviews revenues are gathered. Further revenue from target product/service segment is assessed to avoid overshooting of market statistics. In case of heavy deviations between supply and demand side values, all thes steps are repeated to achieve synchronization.
We follow an iterative model, wherein we share our research findings with Subject Matter Experts (SME’s) and Key Opinion Leaders (KOLs) until consensus view of the market is not formulated – this model negates any drastic deviation in the opinions of experts. Only validated and universally acceptable research findings are quoted in our reports.
We have important check points that we use to validate our research findings – which we call – data triangulation, where we validate the information, we generate from secondary sources with primary interviews and then we re-validate with our internal data bases and Subject matter experts. This comprehensive model enables us to deliver high quality, reliable data in shortest possible time.
 获取此报告的免费样本