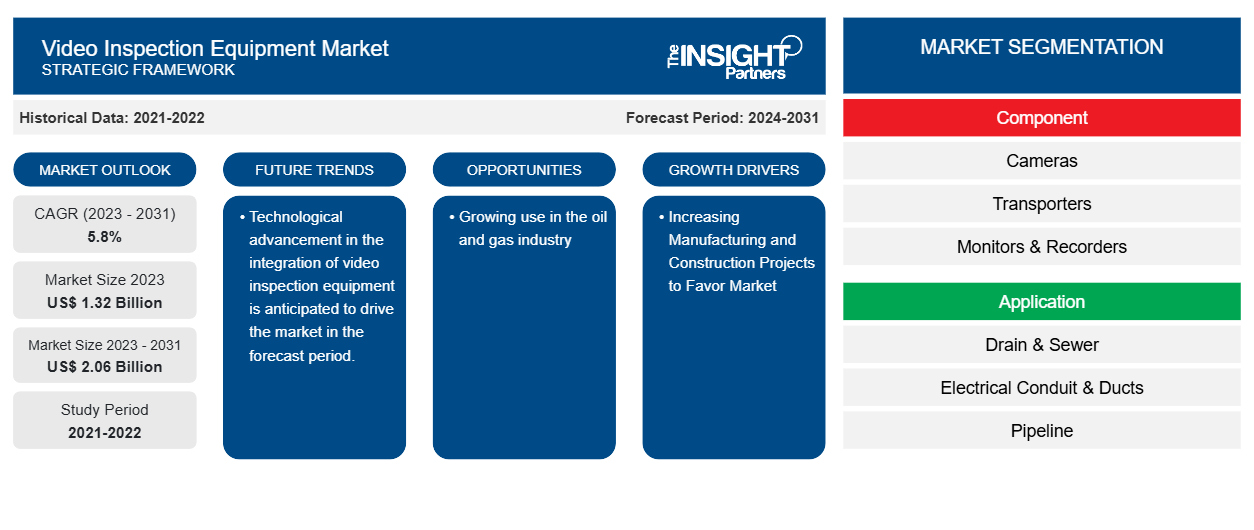
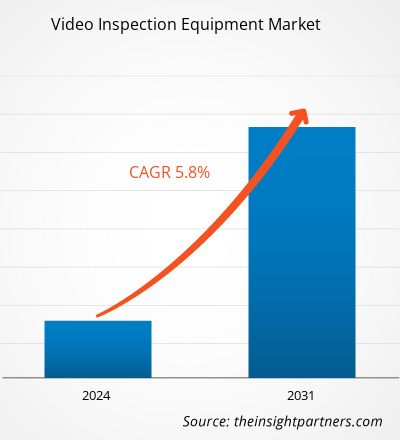
预计到 2031 年,视频检测设备市场规模将从 2023 年的 13.2 亿美元增至 20.6 亿美元。预计 2023-2031 年期间,市场复合年增长率将达到 5.8%。人们对高效污水基础设施的认识不断提高,制造业和建筑业项目的增加可能仍是市场的主要趋势和驱动力。
视频检测设备市场分析
世界各地的下水道运营数量正以指数级的速度推动市场增长。为了确保工业、商业和住宅部门的排水系统和下水道管线不间断地运行,需要及时的维护和清洁服务。美国等发达国家的地方政府当局正在对污水处理工程进行大量投资。美国农业部 (USDA) 管理各种水和废物处理计划,并为农村社区的卫生下水道、饮用水和雨水排水设施提供补助金和贷款。
视频检测设备市场概况
视频检查是地下服务的重要诊断工具。此外,视频管道检查可用于查找泄漏、孔洞和障碍物,可以有效识别进入管道接头的树根。随着树根继续长入管道,这些树根可能会导致泄漏。它还可以识别管道的裂缝区域,这些区域表明未来可能出现问题,以及可能存在的当前泄漏和安装错误。管道接头错位、材料缺陷或其他缺陷都可能导致管道出现问题。
定制此报告以满足您的需求
您可以免费定制任何报告,包括本报告的部分内容、国家级分析、Excel 数据包,以及为初创企业和大学提供优惠和折扣
视频检测设备市场:
- 获取此报告的关键市场趋势。这个免费样品将包括数据分析,从市场趋势到估计和预测。
视频检测设备市场驱动因素和机遇
增加制造业和建筑业项目以利于市场
制造和建筑项目数量的增加推动了视频检测设备市场的发展。住宅、商业和工业领域的建筑项目数量的增加促进了市场的增长。住宅、商业和工业领域的建筑项目数量大幅增长,为排水服务的采用做出了巨大贡献。在购买任何工业用地或房产之前,视频检测设备工具被广泛用于定位堵塞的确切位置。在这个不断变化的世界中,市政工程师的工作变得更加复杂,涉及地下环境的规则和法规也日益复杂。因此,承包商和市政技术人员必须确保在开展任何其他活动之前对地下基础设施进行全面调查。
在石油和天然气工业中的应用日益广泛。
石油和天然气行业是全球规模的基础设施综合体,涉及开采、加工和运输等阶段。严格的风险预防和质量控制措施对于确保石油和天然气行业的安全至关重要。各种类型的视频内窥镜和管道摄像机等视觉检查工具能够发现焊缝缺陷、腐蚀、油脂堆积、孔洞、松动部件、过度磨损和其他缺陷。此外,各种公司都提供视频检查设备。例如,SPI 的 EPIC 管道检查系统和 RECON 视频内窥镜是检查石油和天然气设施中的管道、储罐、阀门、泵和其他关键部件的理想工具。
视频检测设备市场报告细分分析
有助于得出视频检查设备市场分析的关键部分是组件、应用程序和最终用户。
- 根据组件,视频检测设备市场分为摄像机、传送器、监视器和录像机、软件和其他。预计摄像机部分将在预测期内占据相当大的市场份额。
- 根据应用,市场分为排水和下水道、电气导管和管道、管道等。预计排水和下水道部分将在预测期内占据相当大的市场份额。
- 根据最终用户,视频检查设备市场分为石油和天然气、制造和建筑、食品和饮料、化学品和制药等。预计石油和天然气行业在预测期内将占据相当大的市场份额。
按地区划分的视频检测设备市场份额分析
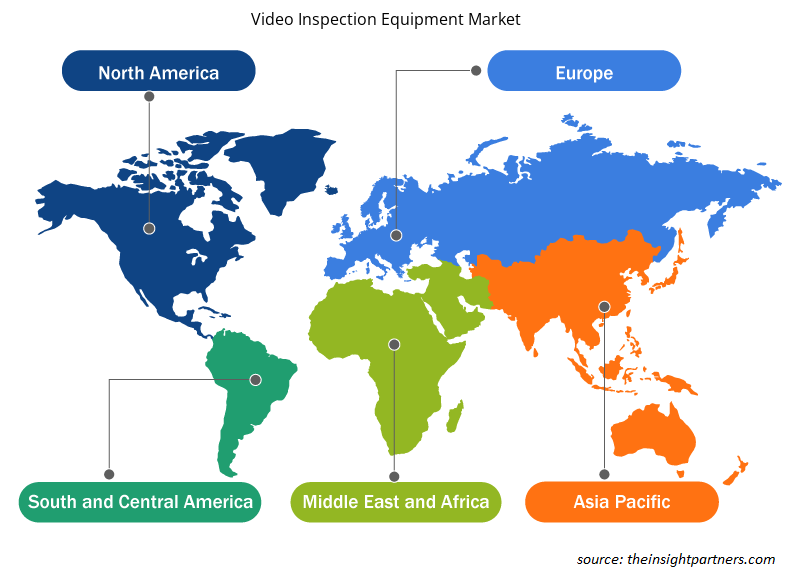
视频检查设备市场报告的地理范围主要分为五个区域:北美、亚太、欧洲、中东和非洲、南美和中美。
北美一直主导着视频检测设备市场。北美地区各行业的高科技采用趋势推动了工程软件市场的增长。数字工具的采用率提高、政府机构的高技术支出以及建筑项目数量的增加等因素预计将推动北美视频检测设备市场的增长。此外,美国和加拿大等发达经济体高度重视研发,这迫使北美参与者将技术先进的解决方案引入市场。此外,美国拥有大量视频检测设备市场参与者,他们越来越专注于开发创新解决方案。所有这些因素都促进了该地区视频检测设备市场的增长。
视频检测设备
视频检测设备市场区域洞察
Insight Partners 的分析师已详尽解释了预测期内影响视频检测设备市场的区域趋势和因素。本节还讨论了北美、欧洲、亚太地区、中东和非洲以及南美和中美洲的视频检测设备市场细分和地理位置。
- 获取视频检测设备市场的区域特定数据
视频检测设备市场报告范围
| 报告属性 | 细节 |
|---|---|
| 2023 年的市场规模 | 13.2亿美元 |
| 2031 年市场规模 | 20.6亿美元 |
| 全球复合年增长率(2023 - 2031) | 5.8% |
| 史料 | 2021-2022 |
| 预测期 | 2024-2031 |
| 涵盖的领域 | 按组件
|
| 覆盖地区和国家 | 北美
|
| 市场领导者和主要公司简介 |
|
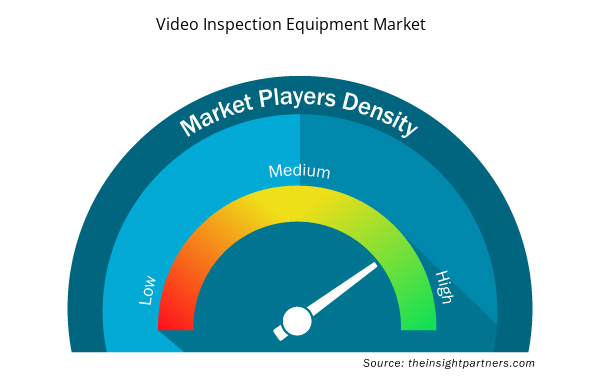
视频检测设备市场参与者密度:了解其对业务动态的影响
视频检测设备市场正在快速增长,这得益于终端用户需求的不断增长,而这些需求又源于消费者偏好的不断变化、技术进步以及对产品优势的认识不断提高等因素。随着需求的增加,企业正在扩大其产品范围,进行创新以满足消费者的需求,并利用新兴趋势,从而进一步推动市场增长。
市场参与者密度是指在特定市场或行业内运营的企业或公司的分布情况。它表明在给定市场空间中,相对于其规模或总市场价值,有多少竞争对手(市场参与者)存在。
在视频检测设备市场运营的主要公司有:
- 白羊座工业
- 公司
- CUES 公司
- 子站电子
- Vivax-Metrotech 公司
- Rausch Electronics USA;有限责任公司
免责声明:上面列出的公司没有按照任何特定顺序排列。
- 了解视频检测设备市场主要参与者概况
视频检测设备市场新闻和最新发展
视频检测设备市场通过收集一手和二手研究后的定性和定量数据进行评估,其中包括重要的公司出版物、协会数据和数据库。以下列出了视频检测设备市场的一些发展情况:
- RICOH Industrial Solutions Inc. 宣布推出 RICOH SC-20,这是一款利用图像识别技术的工作检查相机,可实时确认正确的手动工作流程执行情况。(来源:理光公司网站,2023 年 6 月)
- 日本电产东测株式会社宣布推出用于饮料生产线的节省空间的视觉检查设备。
- (来源:日本电产东测株式会社公司网站,2023 年 3 月)
视频检测设备市场报告范围和交付成果
“视频检测设备市场规模和预测(2021-2031)”报告对以下领域进行了详细的市场分析:
- 范围内涵盖的所有主要细分市场在全球、区域和国家层面的视频检测设备市场规模及预测。
- 视频检查设备市场趋势以及驱动因素、限制因素和关键机遇等市场动态。
- 详细的 PEST/波特五力分析和 SWOT 分析。
- 视频检查设备市场分析涵盖主要市场趋势、全球和区域框架、主要参与者、法规和最新的市场发展。
- 行业格局和竞争分析,涵盖市场集中度、热图分析、知名参与者以及视频检查设备市场的最新发展。
- 详细的公司简介。
- 历史分析(2 年)、基准年、预测(7 年)及复合年增长率
- PEST 和 SWOT 分析
- 市场规模价值/数量 - 全球、区域、国家
- 行业和竞争格局
- Excel 数据集

Report Coverage
Revenue forecast, Company Analysis, Industry landscape, Growth factors, and Trends

Segment Covered
This text is related
to segments covered.

Regional Scope
North America, Europe, Asia Pacific, Middle East & Africa, South & Central America

Country Scope
This text is related
to country scope.
常见问题
North America is anticipated to dominate the video inspection equipment market in 2023.
Rising awareness for efficient sewage infrastructure and an increase in manufacturing and construction projects are some of the factors driving the video inspection equipment market.
Technological advancement in the integration of video inspection equipment is anticipated to drive the market in the forecast period.
The key players holding majority shares in the global video inspection equipment market are Aries Industries, Inc., CUES Inc, Subsite Electronics, Vivax-Metrotech Corp, Rausch Electronics USA; LLC, Envirosight LLC, Hathorn Corporation, IBAK Helmut Hunger GmbH & Cc KG, CDS Corporation, Extech.
The global video inspection equipment market is expected to reach US$ 1.32 billion by 2031.
The expected CAGR of the video inspection equipment market is 5.8%.
Trends and growth analysis reports related to Electronics and Semiconductor : READ MORE..
The Insight Partners performs research in 4 major stages: Data Collection & Secondary Research, Primary Research, Data Analysis and Data Triangulation & Final Review.
- Data Collection and Secondary Research:
As a market research and consulting firm operating from a decade, we have published and advised several client across the globe. First step for any study will start with an assessment of currently available data and insights from existing reports. Further, historical and current market information is collected from Investor Presentations, Annual Reports, SEC Filings, etc., and other information related to company’s performance and market positioning are gathered from Paid Databases (Factiva, Hoovers, and Reuters) and various other publications available in public domain.
Several associations trade associates, technical forums, institutes, societies and organization are accessed to gain technical as well as market related insights through their publications such as research papers, blogs and press releases related to the studies are referred to get cues about the market. Further, white papers, journals, magazines, and other news articles published in last 3 years are scrutinized and analyzed to understand the current market trends.
- Primary Research:
The primarily interview analysis comprise of data obtained from industry participants interview and answers to survey questions gathered by in-house primary team.
For primary research, interviews are conducted with industry experts/CEOs/Marketing Managers/VPs/Subject Matter Experts from both demand and supply side to get a 360-degree view of the market. The primary team conducts several interviews based on the complexity of the markets to understand the various market trends and dynamics which makes research more credible and precise.
A typical research interview fulfils the following functions:
- Provides first-hand information on the market size, market trends, growth trends, competitive landscape, and outlook
- Validates and strengthens in-house secondary research findings
- Develops the analysis team’s expertise and market understanding
Primary research involves email interactions and telephone interviews for each market, category, segment, and sub-segment across geographies. The participants who typically take part in such a process include, but are not limited to:
- Industry participants: VPs, business development managers, market intelligence managers and national sales managers
- Outside experts: Valuation experts, research analysts and key opinion leaders specializing in the electronics and semiconductor industry.
Below is the breakup of our primary respondents by company, designation, and region:

Once we receive the confirmation from primary research sources or primary respondents, we finalize the base year market estimation and forecast the data as per the macroeconomic and microeconomic factors assessed during data collection.
- Data Analysis:
Once data is validated through both secondary as well as primary respondents, we finalize the market estimations by hypothesis formulation and factor analysis at regional and country level.
- Macro-Economic Factor Analysis:
We analyse macroeconomic indicators such the gross domestic product (GDP), increase in the demand for goods and services across industries, technological advancement, regional economic growth, governmental policies, the influence of COVID-19, PEST analysis, and other aspects. This analysis aids in setting benchmarks for various nations/regions and approximating market splits. Additionally, the general trend of the aforementioned components aid in determining the market's development possibilities.
- Country Level Data:
Various factors that are especially aligned to the country are taken into account to determine the market size for a certain area and country, including the presence of vendors, such as headquarters and offices, the country's GDP, demand patterns, and industry growth. To comprehend the market dynamics for the nation, a number of growth variables, inhibitors, application areas, and current market trends are researched. The aforementioned elements aid in determining the country's overall market's growth potential.
- Company Profile:
The “Table of Contents” is formulated by listing and analyzing more than 25 - 30 companies operating in the market ecosystem across geographies. However, we profile only 10 companies as a standard practice in our syndicate reports. These 10 companies comprise leading, emerging, and regional players. Nonetheless, our analysis is not restricted to the 10 listed companies, we also analyze other companies present in the market to develop a holistic view and understand the prevailing trends. The “Company Profiles” section in the report covers key facts, business description, products & services, financial information, SWOT analysis, and key developments. The financial information presented is extracted from the annual reports and official documents of the publicly listed companies. Upon collecting the information for the sections of respective companies, we verify them via various primary sources and then compile the data in respective company profiles. The company level information helps us in deriving the base number as well as in forecasting the market size.
- Developing Base Number:
Aggregation of sales statistics (2020-2022) and macro-economic factor, and other secondary and primary research insights are utilized to arrive at base number and related market shares for 2022. The data gaps are identified in this step and relevant market data is analyzed, collected from paid primary interviews or databases. On finalizing the base year market size, forecasts are developed on the basis of macro-economic, industry and market growth factors and company level analysis.
- Data Triangulation and Final Review:
The market findings and base year market size calculations are validated from supply as well as demand side. Demand side validations are based on macro-economic factor analysis and benchmarks for respective regions and countries. In case of supply side validations, revenues of major companies are estimated (in case not available) based on industry benchmark, approximate number of employees, product portfolio, and primary interviews revenues are gathered. Further revenue from target product/service segment is assessed to avoid overshooting of market statistics. In case of heavy deviations between supply and demand side values, all thes steps are repeated to achieve synchronization.
We follow an iterative model, wherein we share our research findings with Subject Matter Experts (SME’s) and Key Opinion Leaders (KOLs) until consensus view of the market is not formulated – this model negates any drastic deviation in the opinions of experts. Only validated and universally acceptable research findings are quoted in our reports.
We have important check points that we use to validate our research findings – which we call – data triangulation, where we validate the information, we generate from secondary sources with primary interviews and then we re-validate with our internal data bases and Subject matter experts. This comprehensive model enables us to deliver high quality, reliable data in shortest possible time.
 获取此报告的免费样本